DataCenter Energy Advanced Model — Design Your Renewable Energy Mix, Calculate Total Cost and Verify ESG Compliance
Originally published: 16/05/2026 07:29
Publication number: ELQ-76963-1
View all versions & Certificate
certified

DataCenter Energy Advanced Model — Design Your Renewable Energy Mix, Calculate Total Cost and Verify ESG Compliance

Production-ready Excel model for data center energy planning

Description
If you develop, operate or advise on data centers, you know the problem: every procurement decision or ESG reporting cycle requires calculating the total facility load from physical components, pricing out a combination of solar PPA, wind PPA, BESS and grid electricity, checking whether the resulting mix qualifies for RE100 or SBTi, and explaining the whole methodology to a CFO, a sustainability team or a lender who needs a number they can defend. There is no standard tool that does all of this in one place. Most teams build it from scratch each time, or use a spreadsheet that handles either the engineering side or the financial side but never both together.
This model does both.
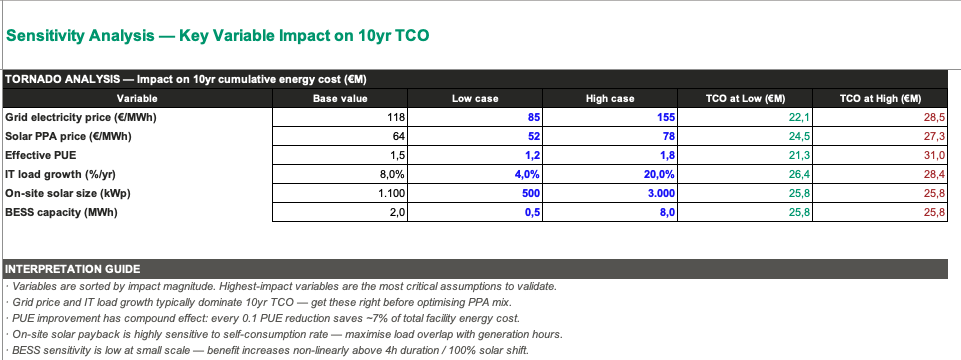
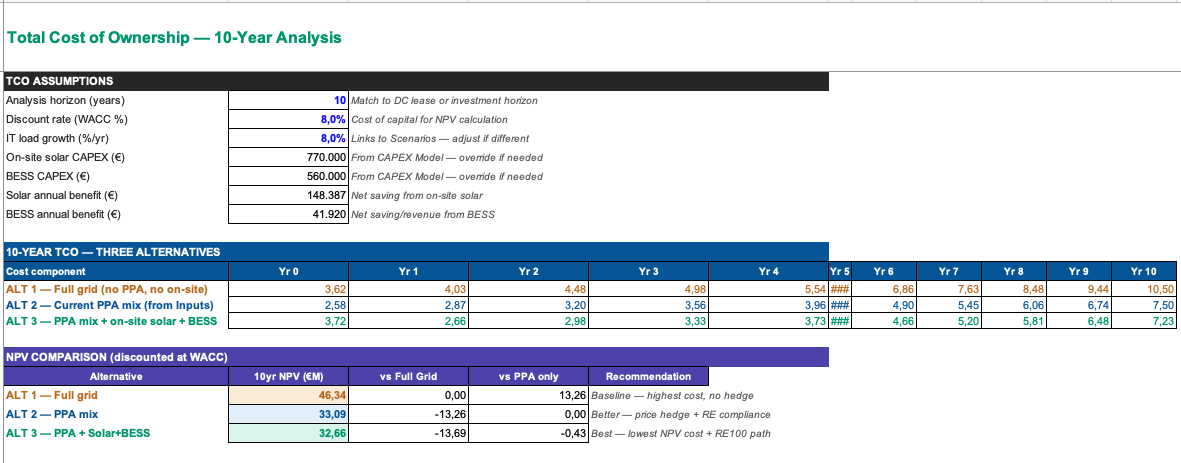
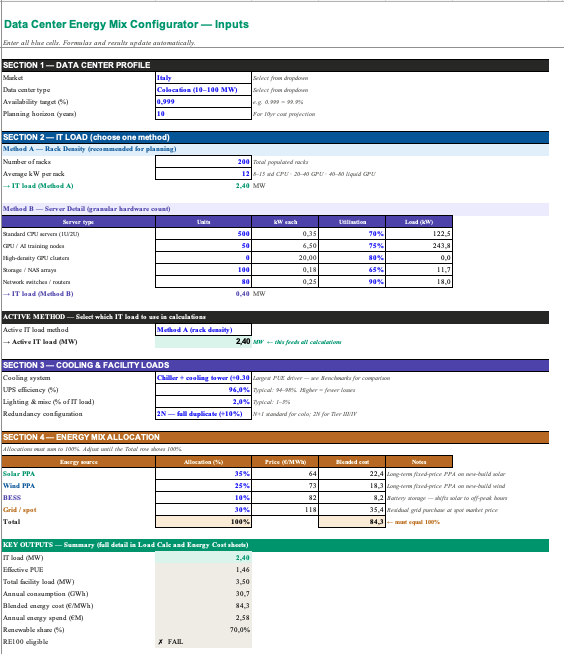
Enter your rack count and density, select your cooling system, allocate your energy mix across solar PPA, wind PPA, BESS and grid — and every output updates automatically. PUE, total facility load, annual consumption, blended energy cost, 10-year cost projection, CAPEX, TCO, sensitivity analysis and a full compliance dashboard. Ready to present to a board, a sustainability committee or a financing partner.


What makes it different from a generic energy cost spreadsheet
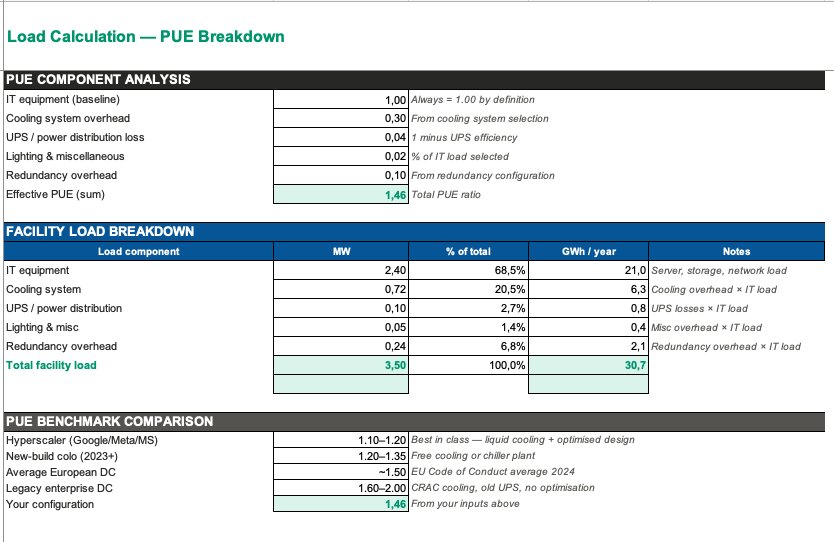
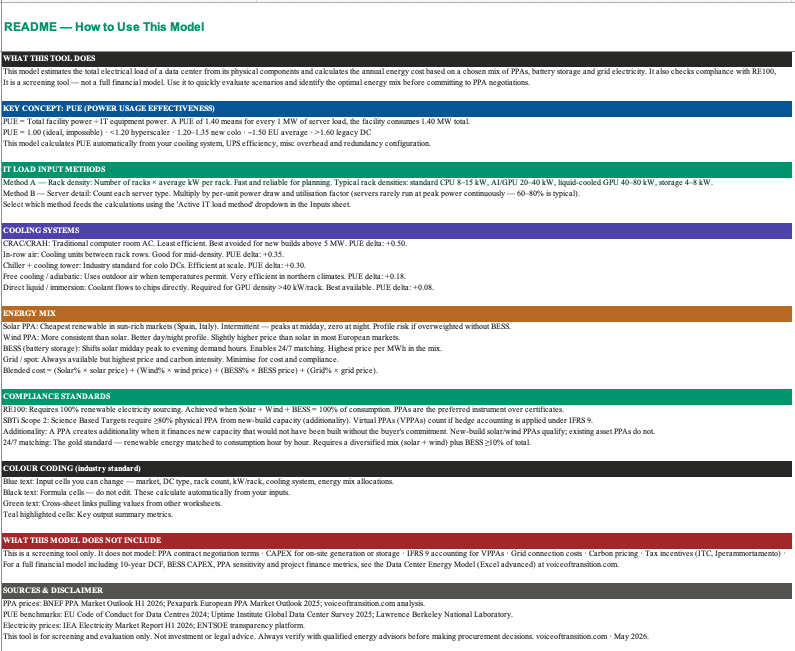
The load calculation is built from physical components, not from a top-down assumption. Two input methods are available: rack density mode, which takes number of racks and average kW per rack and is the right approach for planning stage; and server detail mode, which counts each server type — standard CPU, GPU training nodes, high-density GPU clusters, storage arrays, network switches — with per-unit power draw and utilisation factors. The model calculates PUE automatically from the cooling system selection, UPS efficiency, miscellaneous overhead and redundancy configuration, and benchmarks the result against hyperscaler, new-build colo and legacy EU data center averages. This matters because a data center operator presenting a PUE of 1.46 to a financing partner needs to know immediately whether that is above or below the EU average, and why.
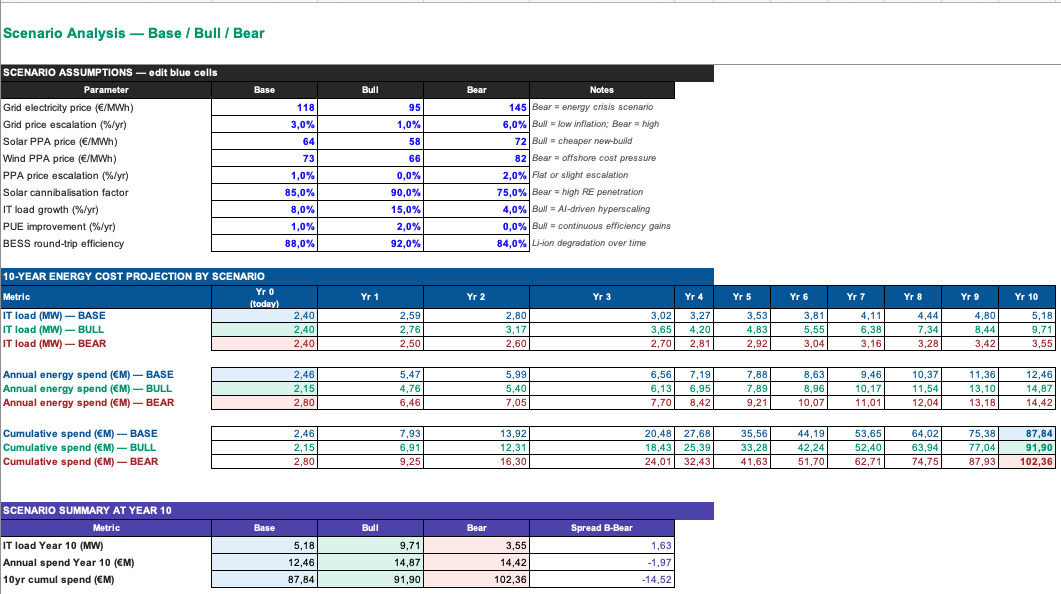
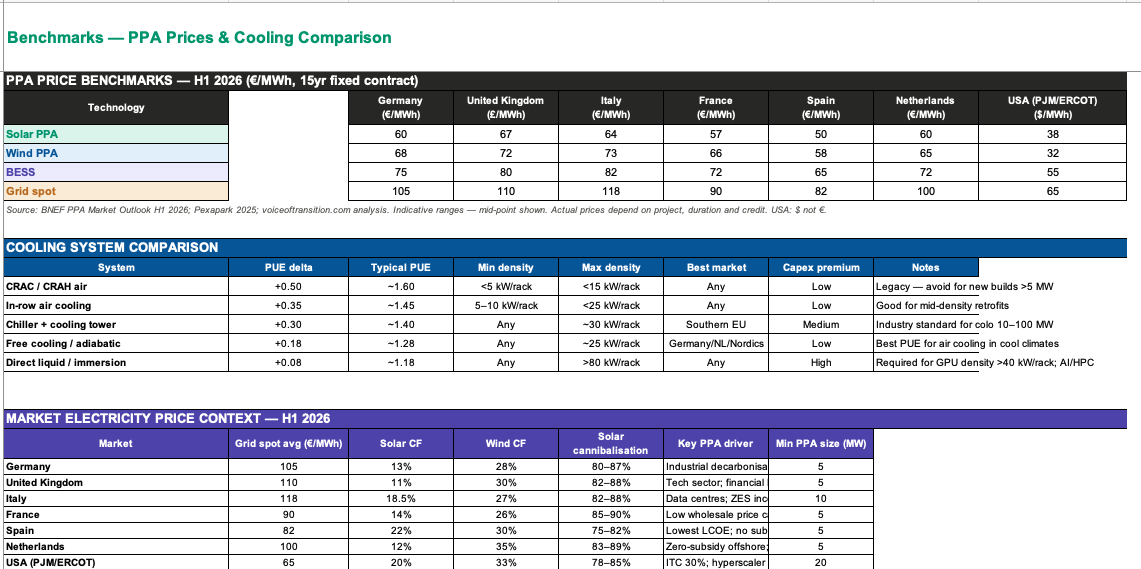
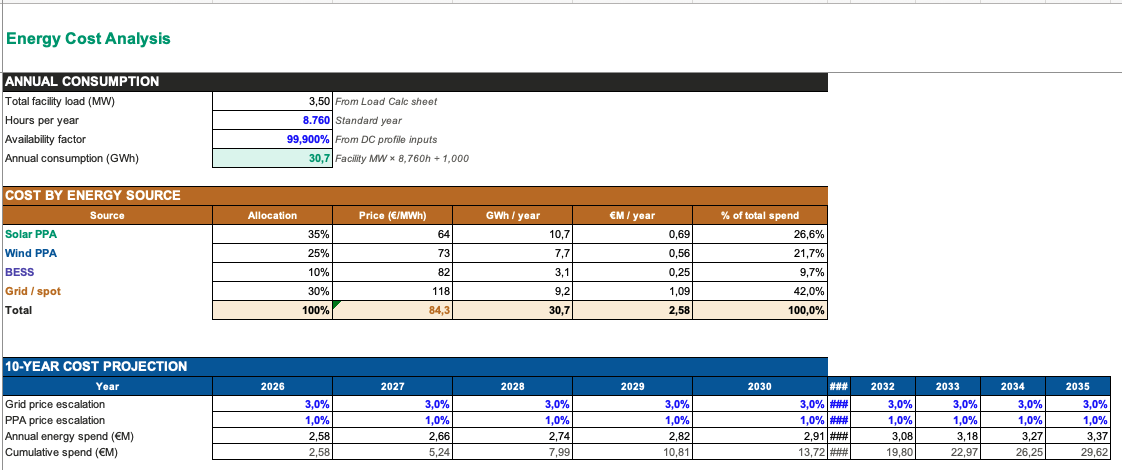
The energy mix module reflects the actual instruments available to a data center buyer. Solar PPA and wind PPA are priced separately with different escalation rates — PPA prices escalate at 1% per year while grid spot escalates at 3% — because the whole point of a long-term PPA is price certainty against a volatile grid. BESS is modelled as a separate allocation that shifts solar midday generation to evening demand hours, enabling 24/7 hourly matching. Benchmark PPA prices for H1 2026 are pre-loaded for seven markets — Germany, UK, Italy, France, Spain, Netherlands and USA — sourced from BNEF PPA Market Outlook H1 2026 and Pexapark 2025.
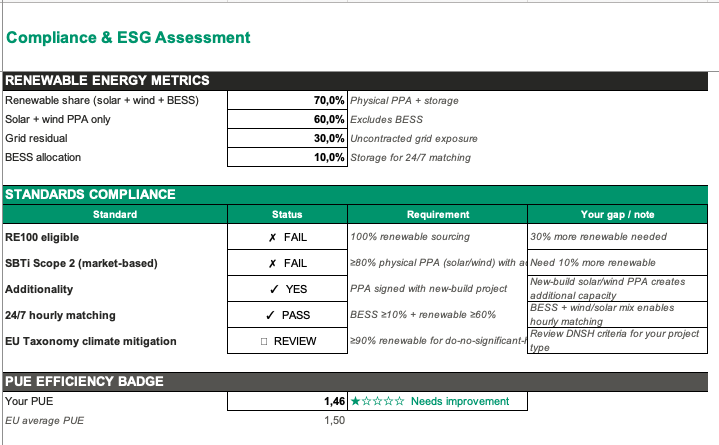
The compliance module checks four standards automatically against the energy mix configuration. RE100 requires 100% renewable sourcing — the model shows the gap in percentage points and what it would take to close it. SBTi Scope 2 requires at least 80% physical PPA from new-build capacity with additionality — the model checks both the percentage threshold and the additionality condition. 24/7 hourly matching requires BESS above 10% combined with a diversified renewable mix — the model evaluates the combination. EU Taxonomy climate mitigation compliance is flagged for review at below 90% renewable share. These are not manual checks — they update the moment you change the energy mix allocation.
The cooling system comparison sheet covers five configurations from legacy CRAC air cooling to direct liquid and immersion — with PUE delta, rack density range, best market and CAPEX premium — so the engineering and financial implications of a cooling upgrade can be evaluated side by side.


Who this is for
Data center developers and operators evaluating energy procurement strategies for new builds or existing facilities. CFOs and sustainability teams preparing RE100, SBTi or EU Taxonomy compliance documentation. Energy advisors structuring PPA portfolios for hyperscale or colocation clients. Infrastructure investors and lenders requiring a TCO and compliance view before committing to a data center financing.


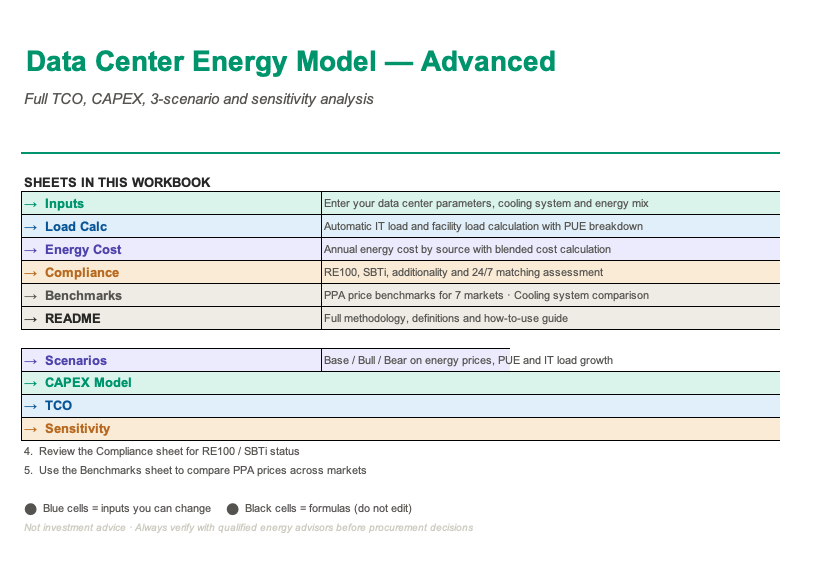
Workbook: Inputs · Load Calc · Energy Cost · Compliance · Benchmarks · Scenarios · CAPEX Model · TCO · Sensitivity · README.


For custom versions or specific requests, contact us at [email protected]

This Best Practice includes
1 Excel Model

Acquire business license for $161.00

Add to cart

Add to bookmarks

Discuss

Further information

This model enables data center developers, operators and advisors to calculate total facility load from physical components, design and price an optimal renewable energy mix across solar PPA, wind PPA, BESS and grid electricity, and verify compliance with RE100, SBTi Scope 2, additionality and 24/7 hourly matching standards — all within a single Excel workbook. It produces annual energy cost, a 10-year cost projection with differentiated PPA and grid escalation rates, CAPEX, TCO and sensitivity analysis, and benchmarks the resulting PUE against hyperscaler, new-build colo and legacy EU data center averages. PPA price benchmarks for seven markets are pre-loaded from H1 2026 sources, and five cooling system configurations are compared on PUE, rack density range and CAPEX premium.

This model is best suited to colocation, hyperscale or enterprise data centers in the 5–500 MW IT load range at planning, procurement or ESG reporting stage, where the energy mix — combination of solar PPA, wind PPA, BESS and grid — is a live decision. It works particularly well when RE100, SBTi or EU Taxonomy compliance is a requirement and the gap between current configuration and the relevant threshold needs to be quantified. It is also well suited to advisory contexts where multiple energy mix scenarios need to be compared quickly before entering PPA negotiations, and to financing contexts where a lender or investor requires a TCO and compliance view as part of due diligence.

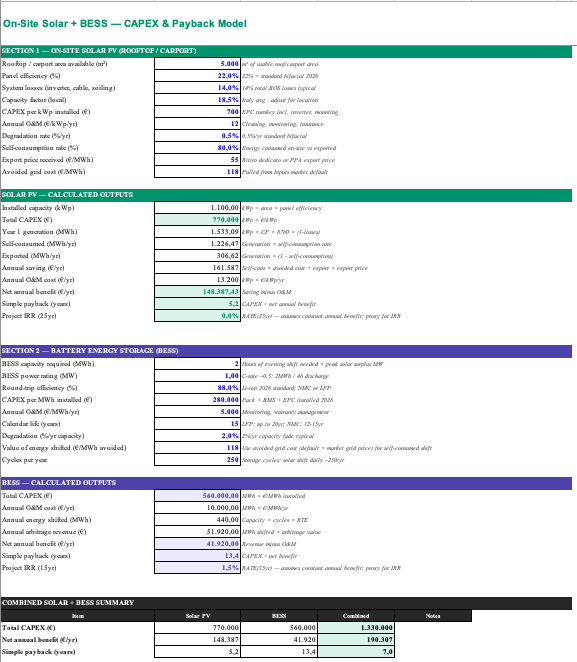
This model is a screening and planning tool, not a full energy management system or PPA pricing engine — actual PPA prices depend on project-specific factors including contract duration, buyer credit rating, offtake volume and grid connection point, and the pre-loaded benchmarks should be treated as indicative mid-points. It does not model behind-the-meter generation assets owned by the data center operator, virtual PPAs under IFRS 9 hedge accounting, or demand response and curtailment strategies. It should not be used as the sole basis for a PPA procurement decision — it must be supplemented with market diligence, legal advice on contract structure and a site-specific energy yield assessment for any co-located generation.


0.0 / 5 (0 votes)

please wait...