Originally published: 21/11/2022 19:58
Publication number: ELQ-22443-1
View all versions & Certificate
Publication number: ELQ-22443-1
View all versions & Certificate

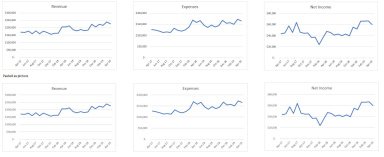
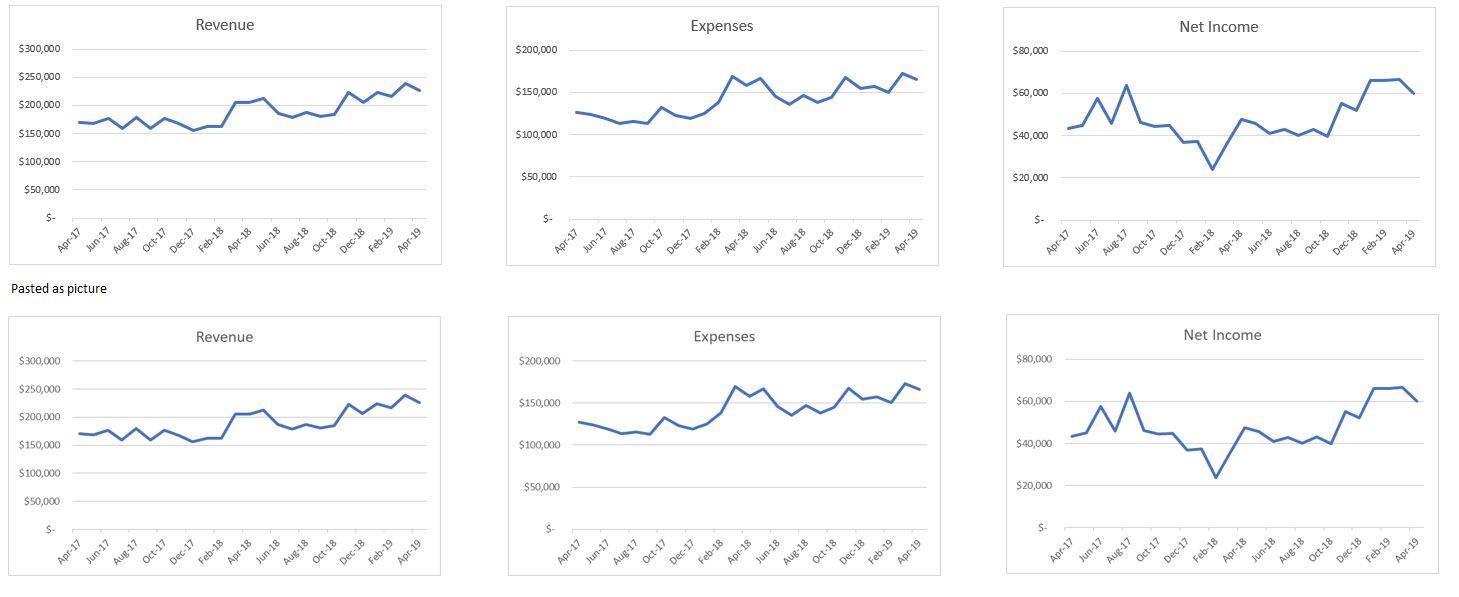
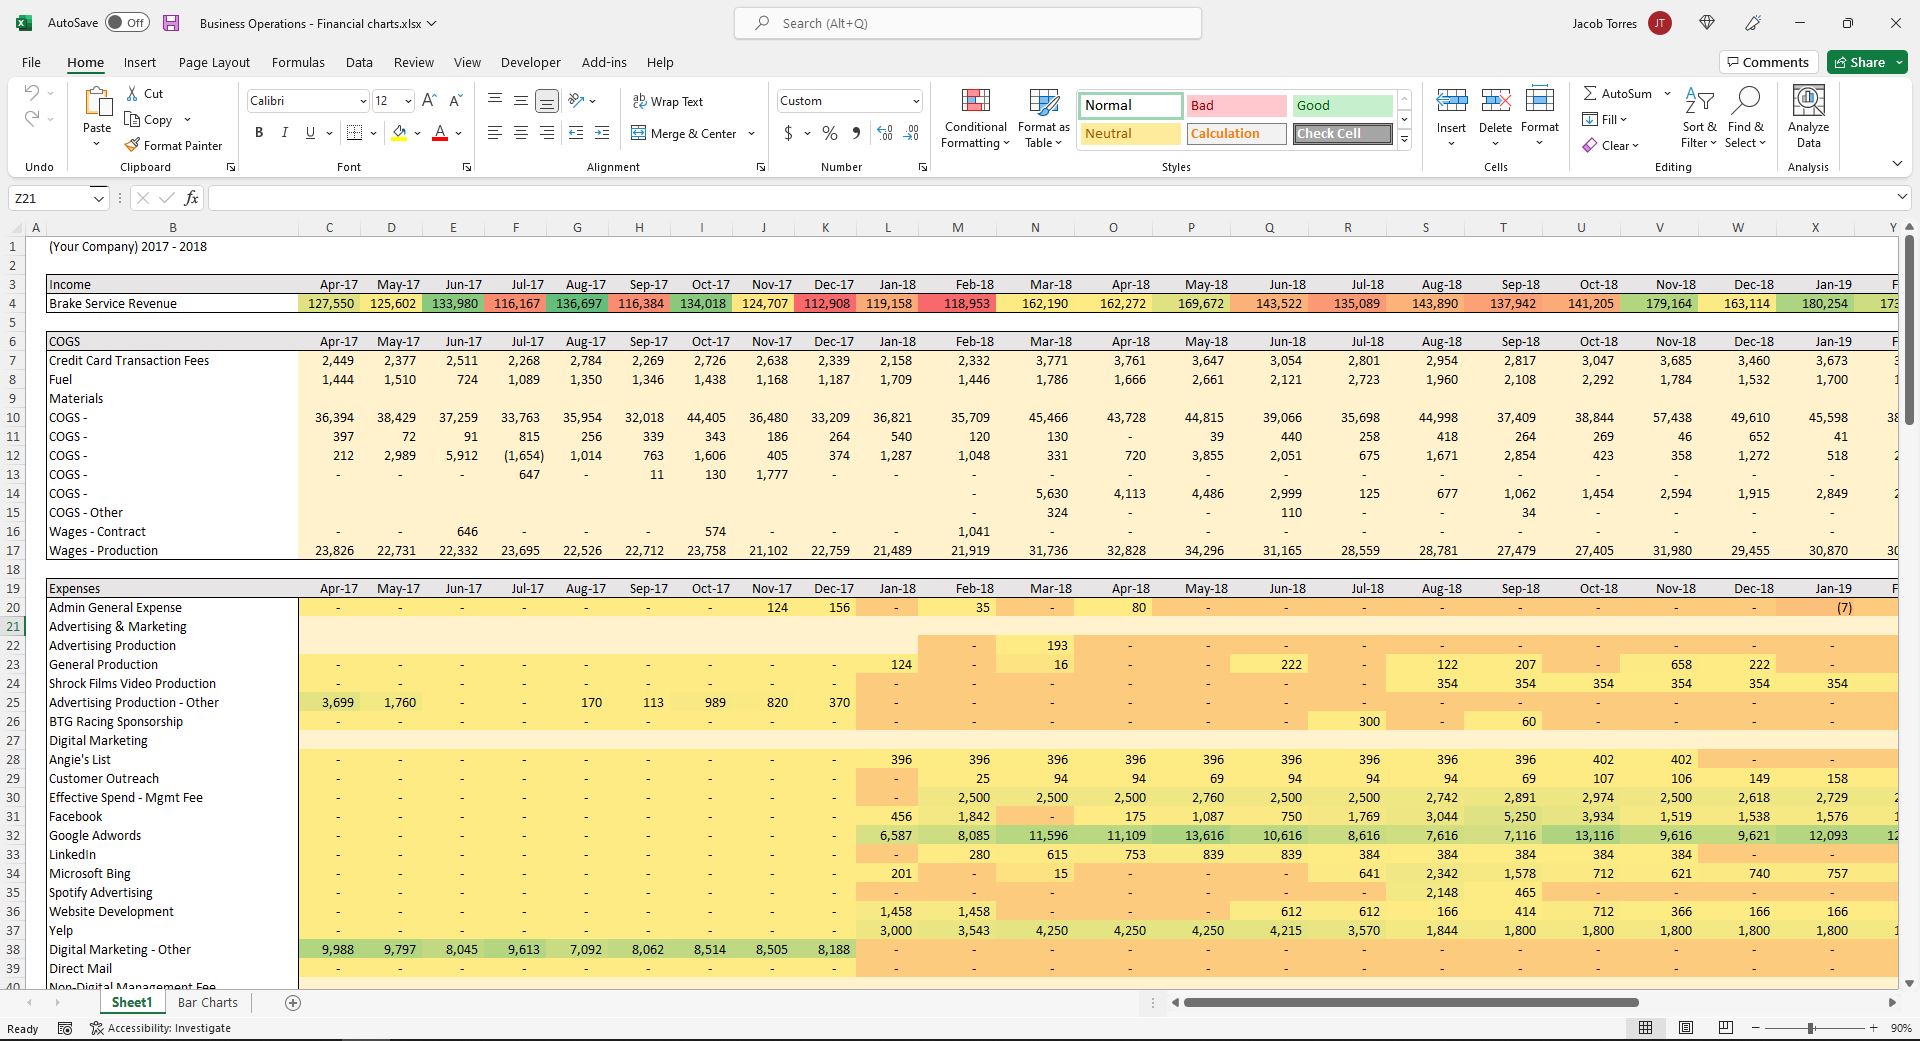
Business Operations Financial Charts
Create easy business operations charts to use in PowerPoint presentations or MS Word documents
