


Originally published: 27/06/2023 12:27
Publication number: ELQ-29699-1
View all versions & Certificate
Publication number: ELQ-29699-1
View all versions & Certificate

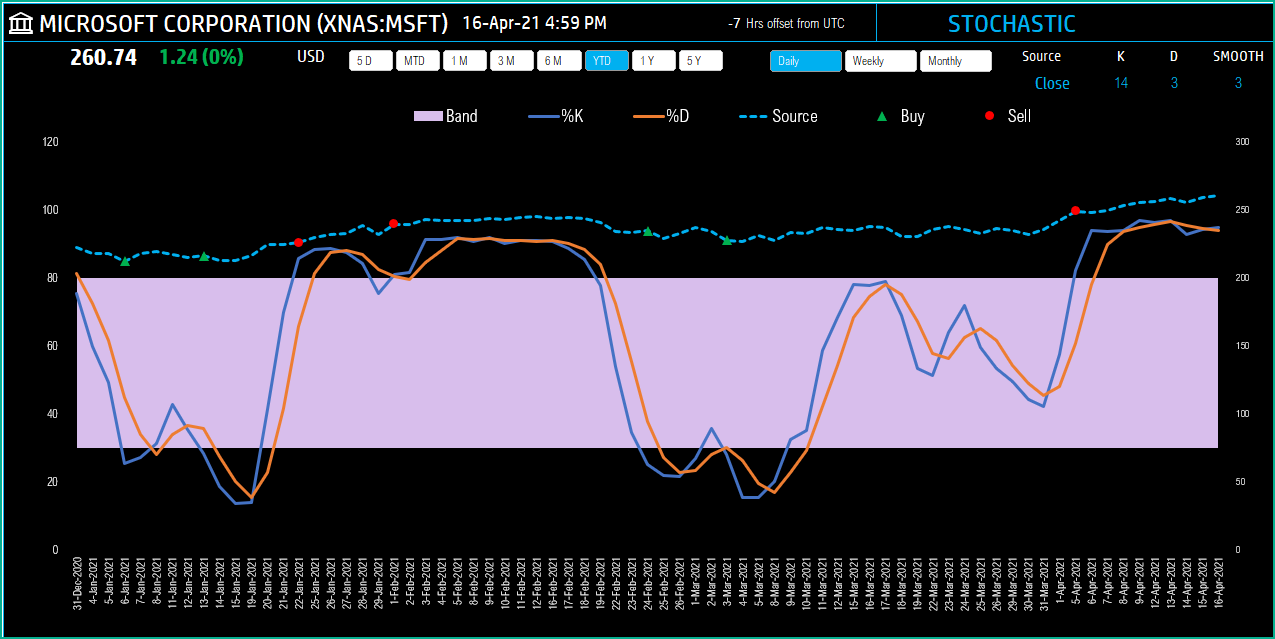
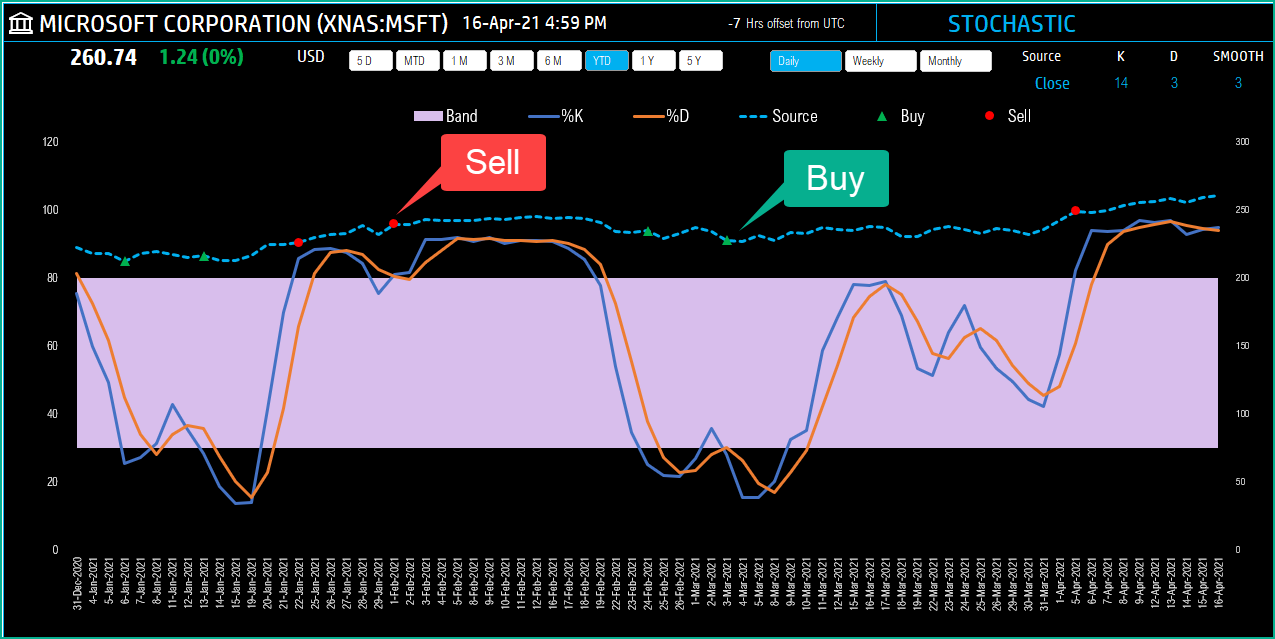
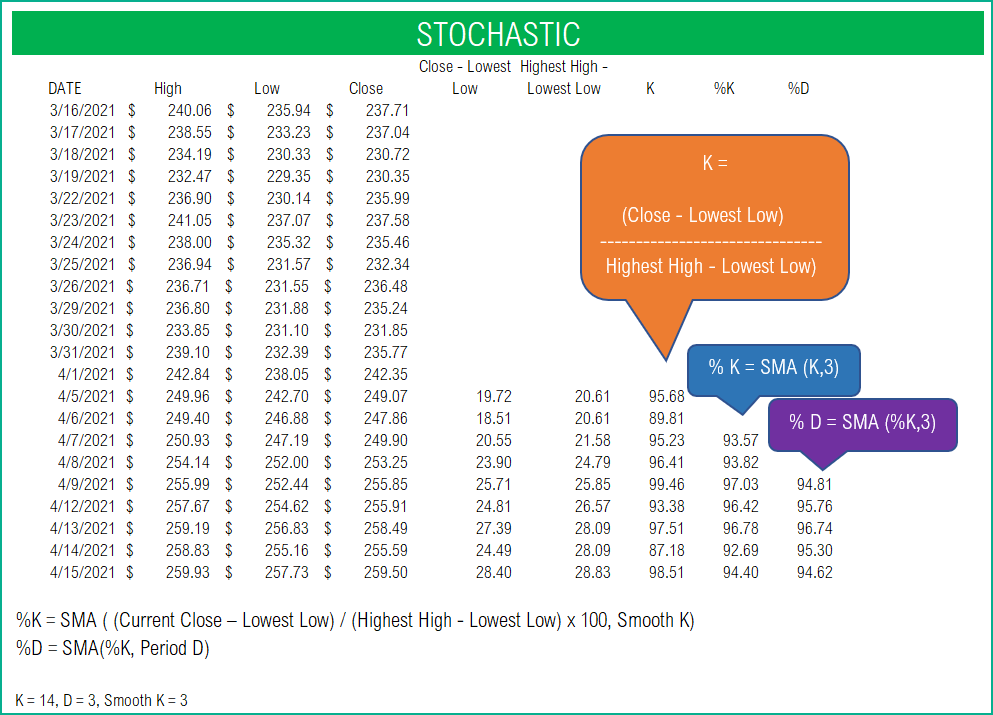
Stochastic Indicator – Technical Analysis – Stock Market Excel Template
This template helps in using the Stochastic technical indicator to analyze stock performance.
