
Originally published: 10/10/2024 20:56
Publication number: ELQ-15396-1
View all versions & Certificate
Publication number: ELQ-15396-1
View all versions & Certificate

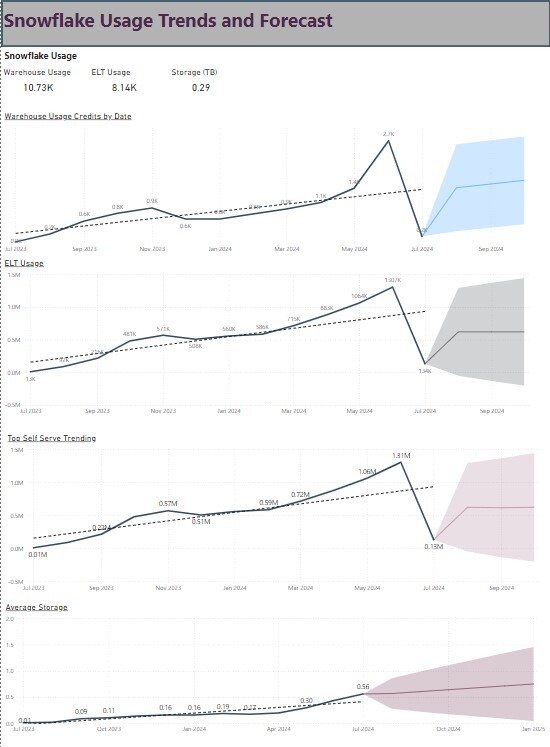
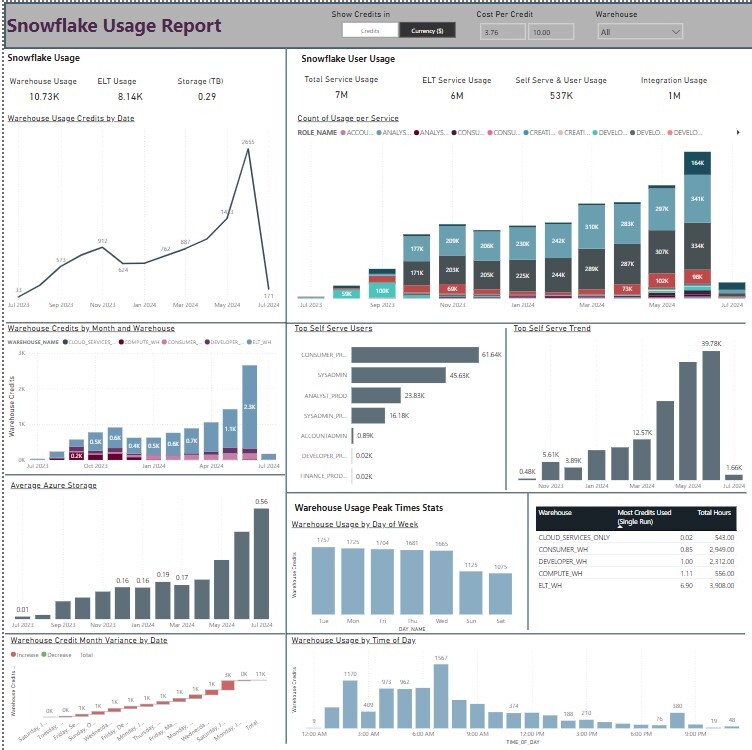
Snowflake CPU Usage Power BI Report Template
The Snowflake Usage Report Template was created to bring easy and quick visibility to monitor Snowflake CPUs
