

Originally published: 18/11/2021 10:14
Publication number: ELQ-31218-1
View all versions & Certificate
Publication number: ELQ-31218-1
View all versions & Certificate

Real Estate Simple Residential Property Valuation Excel Financial Model
This Finacial Model assists the owner and the investor, evaluate the project’s financial feasibility and helps grow the investor’s business.
Our mission is to be the industrial leader and pioneer in our business domainFollow 17
valuationreal estateproperty valuationfinancial modelingexcel real estate templateincome statementpro forma analysis real estatedashboardcash flow statementbreak even analysis
Description
# Real Estate Simple Residential Property Valuation Excel Financial Model
The Real Estate Simple Residential Property Valuation offers the financial analysis of existing and new residential investments. The Residential Real Estate Industry has seen a boom through the last decade. As a Residential Real Estate Industry player, you may add a new line of business by acquiring a close competitor or a newly built high rise and utilize this model for better business analysis and forecasting.
This model consists of three financial statements: Monthly Income Statement, Yearly Income Statement, Balance Sheet, and Cashflow Statement. Along with the decision-making tools such as; Break-Even Analysis, Project Valuation, Diagnostic Tools, Startup Summary, and various Charts & Graphs.
# Key Inputs of Real Estate Simple Residential Property Valuation Excel Financial Model.
1: Investment Sources
2: Property Acquisition Cost
3: Rental Analysis
4: Debt-Investment Ratio
5: Rental Income
6: Vacancy Ratio
7: Future Sale Price
8: Tax Rate
9: Renovation Cost Table
10: Operational Expense
# Key Features Real Estate Simple Residential Property Valuation Excel Financial Model.
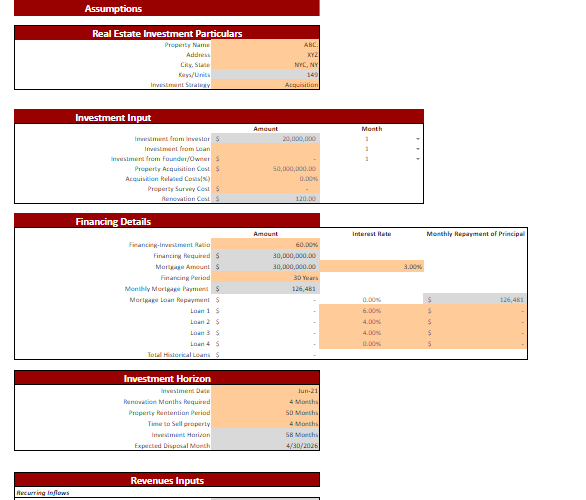
1: Input Sheet
The Input Sheet specifies all the required inputs necessary to compute three financial statements. First, whenever an investor buys an existing building, it has to be renovated as per one’s need and business ideology; Real Estate Apartment Acquisition Model Financial Model does cater to this by adding a fully loaded renovation cost structure plan in a separate sheet under the operational cost head, which will be covering below.
Second, to calculate the true cost of financing the project, the model asks for a loan-value ratio. Then, it automatically calculates the financing amount to be arranged by the owner. Third, monthly borrowing cost is also calculated spontaneously just by entering financing terms and mortgage rates.
Similarly, the investment holding period is ascertained if the user enters its time to renovate, retain and then market to sell. This three-phase holding period is dynamic enough to cater to the delay in investor experiences while selling the property in the future. Revenue generation for a structure is primarily based on rental income, and that too comes with vacant days in a year.
Apparently, an unoccupied unit is a cut on revenue. Therefore it is safe to assume as cost charged against business revenues. Just like the model facilitates determining true property acquisition cost if an investor wants to sell the property in the future, the model adjusts future sales price and all relevant costs needed to dispose of the asset.
Real Estate Apartment Acquisition Model Financial financial model template contains inputs that, when changed, impact the calculations and, therefore, it changes all relevant sheets. As a result, this financial model always has built-in flexibility to display different outcomes or final estimates based on this sheet’s changes.
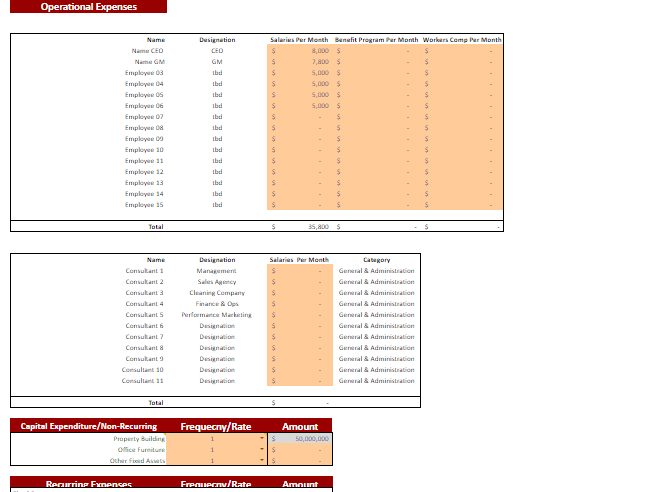
2: Operating Expense
The operational expense sheet is 2nd one in the row, which entails all expected recurring and non-recurring expenditures, which the owner must account for while starting the business. It starts with employees’ and consultant’s overhead costs. Apart from a fixed salary, employees benefit worker compensation provision is there so that users don’t have to look around for additional payroll expenses, which arise from time to time. The model also incorporates expected cash outflows caused by hiring advisors/ consultants to revamp business strategy.
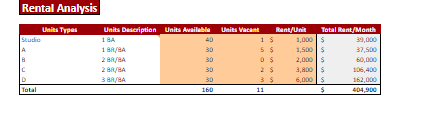
3: Rental Analysis
The rental analysis sheet serves as a pre-requite to the Revenue Analysis sheet. Here, all the property’s rooms/keys/units detail appears. Along with the unit type, it’s a brief description. Total units add to the input sheet. Per unit, rent shown here multiplies with the number of units available. Therefore, it will yield the total rent per category of units.
Similarly, all the unit’s rental income declines by the vacant rooms. This income connects to Revenues Statement. Rental Analysis also accommodates the number of rooms vacant per category.
Thus all vacant rooms are taken into consideration for rental calculation.
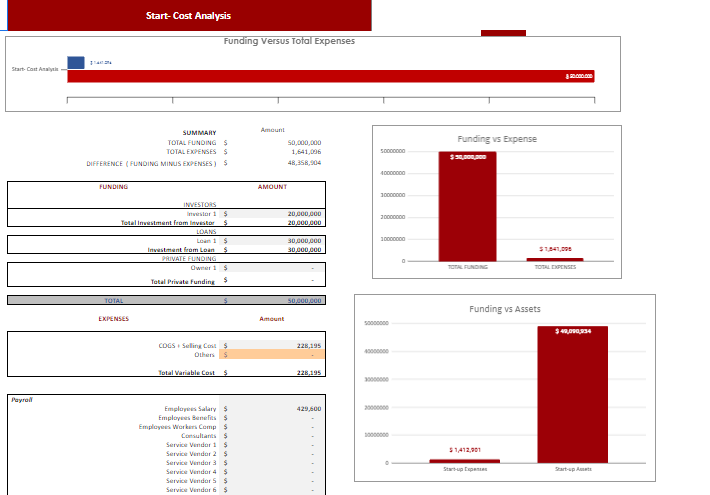
4: Startup Summary
A start-up summary tab includes the total cost incurred at the start of business and capital expenditure, how much cash injected by the company so far, and the number of months the Templateinvestment required.
A Startup Summary helps you take a realistic view of your idea and double-check whether the business has enough funds to support operations.
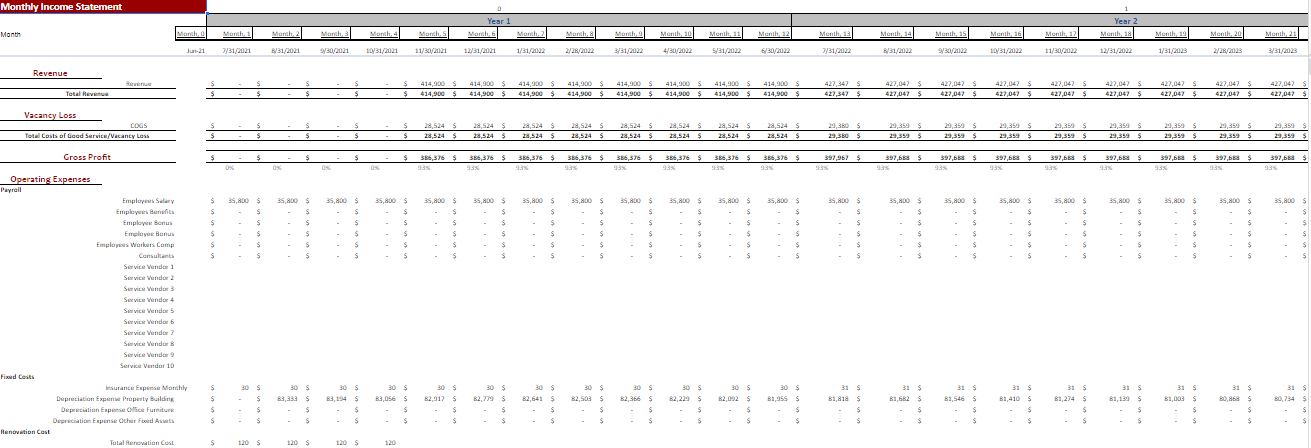
5: Monthly & Yearly Income Statement
The Real Estate Simple Residential Property Valuation Financial Model provides the monthly and yearly income statement structure and a framework for creating a full corporate forecasting model tailored to your particular business.
A vital feature of the real Estate Simple Residential Property Valuation Financial Model is that it is “integrated,” which means that the Income Statement accurately captures the connection and inter-linkages of the various line business items. An integrated financial model is powerful since it enables the Financial Model user to change any assumption in one part of the statement to see how it impacts investors template other parts accurately and consistently.
The monthly Income Statement sheet of the real Estate Simple Residential Property Valuation Financial Model Template is ideal for those who require regular reporting and details. Additionally, Income Statement contains all revenue streamlines with gross earnings, net earnings linked with a revenue analysis sheet to ensure accurate reporting.
Oak Business Consultants understands every business’s goal. Therefore, we have developed a mechanism that helps business owners determine whether they are making profits or otherwise.
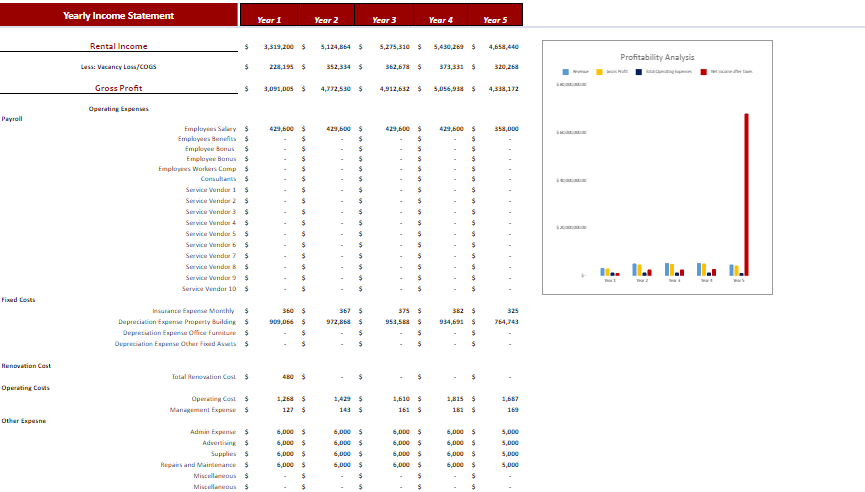
Furthermore, the Yearly Income Statement gives you complete insights into revenue and general & administrative expenses. The Yearly Income Statement also contains several graphs, assumptions, ratios, margins, net profit, earnings, cost of services, and profit after tax.
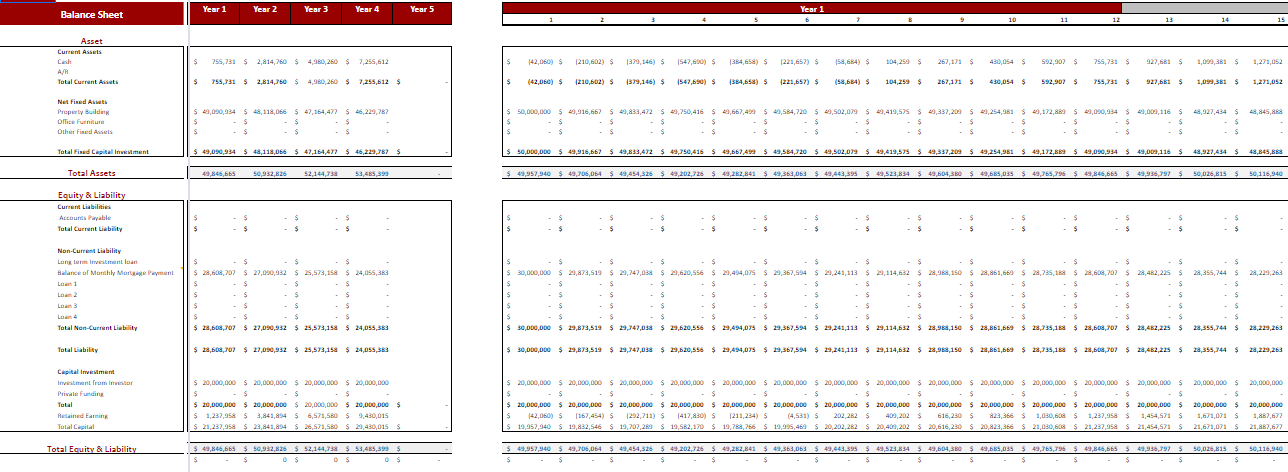
6: Balance Sheet
This balance sheet enables you to analyze your position of current assets, fixed assets, liabilities, and equity. It also allows you to monitor your accounts receivable, accounts payable, accrued expenses, etc. Therefore this specific, financial model gives you the perfect space to analyze your critical financial balance accounts.
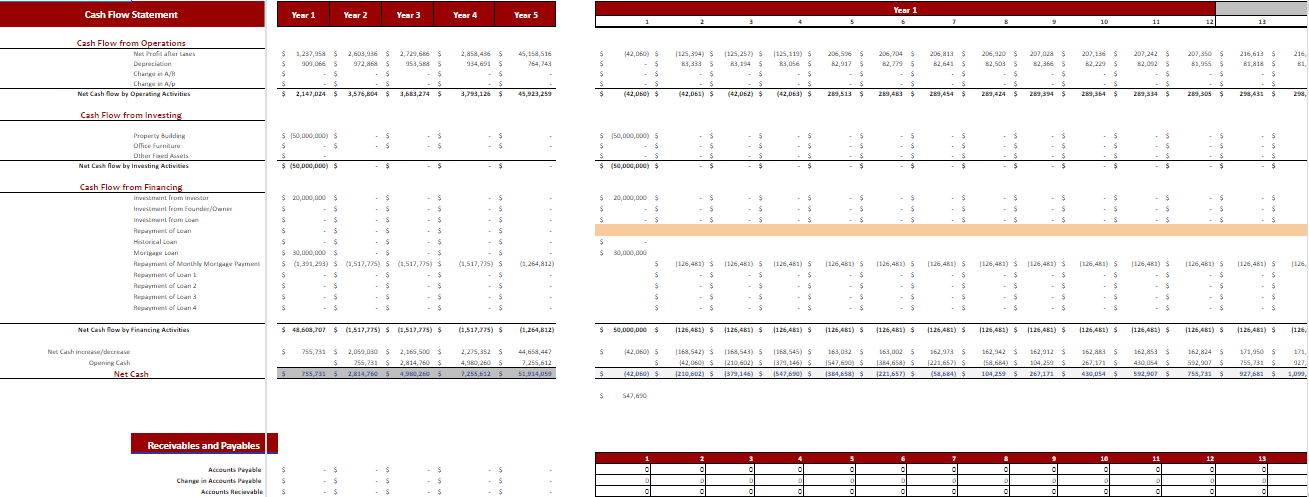
7: Cash Flow Statement
The Cash Flow Statement is the vital part of the three statements that report the cash spent and generated during a specific period. The Cash Flow Statements connect cash rotation between the income statement and balance sheet.
# Three main sections of Cash Flow Statement:
1: Operating Activities: We have included all cash in and out related to the operations of the business.
2: Investing Activities: Any cash from the disposal of an asset and acquisition and investments appear in this section linked to the inputs and fixed asset tab.
3: Financing Activities: We have separately made a loan-related tab where you can enter all loan-related information thee. The tab connects to Financing Activities of Cash Flow Statement.
The Cash Flow Statement in our Model contains a dedicated sheet to monitor and analyze your company cash-ins and out. This cash flow statement relies on several key inputs, such as Payable and Receivable Days, yearly income, working capital, long-term debt, net cash, etc.
This calculation then computes your net cash flow, beginning and end cash balances. It’s a perfect template for your company’s cash flow management.
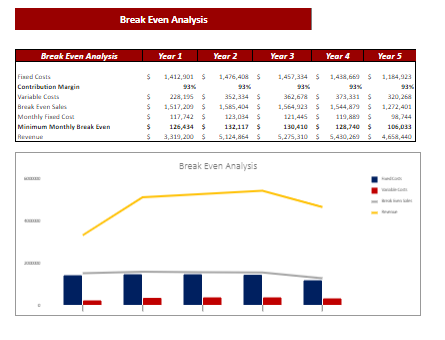
8: Break-Even Analysis
A break-even analysis can help you measure how different scenarios might play out financially. For example, if you increase the marketing budget or add another employee to the payroll, how many extra sales will recover that additional expense?
As a coup, we have included a Break-even analysis to our Financial Model, which will help the user determine sales. The break-even analysis will help you know at a glance the profits generated at the various sales levels.
The Break-Even Analysis refers to the point where your total sales contribution refers to fixed cost at zero profit and loss. This Technique consists of marginal costing, which behaves differently at various levels of output activity.
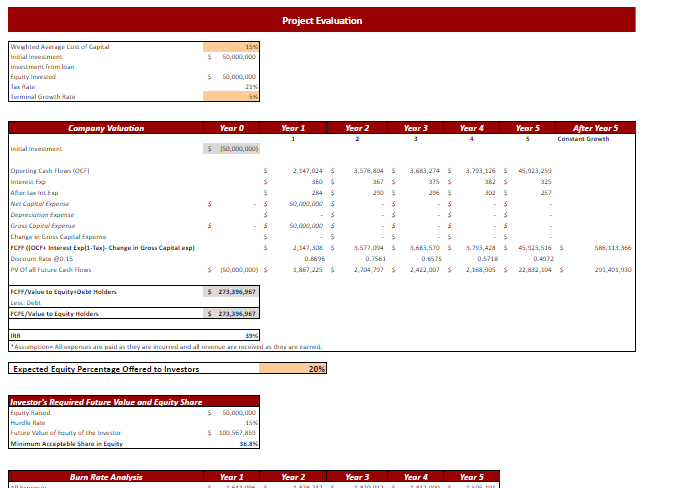
9: Project Evaluation
The project valuation sheet is critical because it gives the directional strategy to an investor either the project should be investing in or not? This sheet is fully linked to all financial statements projected earlier and asks for little input from the user. WACC, the weighted average cost of capital, is discretionary and needs to be put in by the investor itself, keeping in view all equity and debt holders’ costs.
The initial investment is the total project cost that the user has added to the input sheet. Equity and debt values in that project investment amount took from loan-value ratios, which the user defines in the input sheet.
The terminal growth rate is the rate that users foresee a business may earn after a five-year forecast. This rate is hardcoded by the user, keeping in view a specific industry, country, and region in mind. The sole purpose of the project valuation sheet is to use the DCF model to discount back all future expected cash flows of the firm at a discount rate or WACC (set by user).
Then determine the NPV/ free cash flows to the firm (both equity and debt holders) to see if the project has positive or negative net cash flows. Next, the debt/ loan amount is minus to arrive at free cash flows to equity holders. Finally, IRR equals IRR function to see if the project’s IRR is greater than or less than the discount rate.
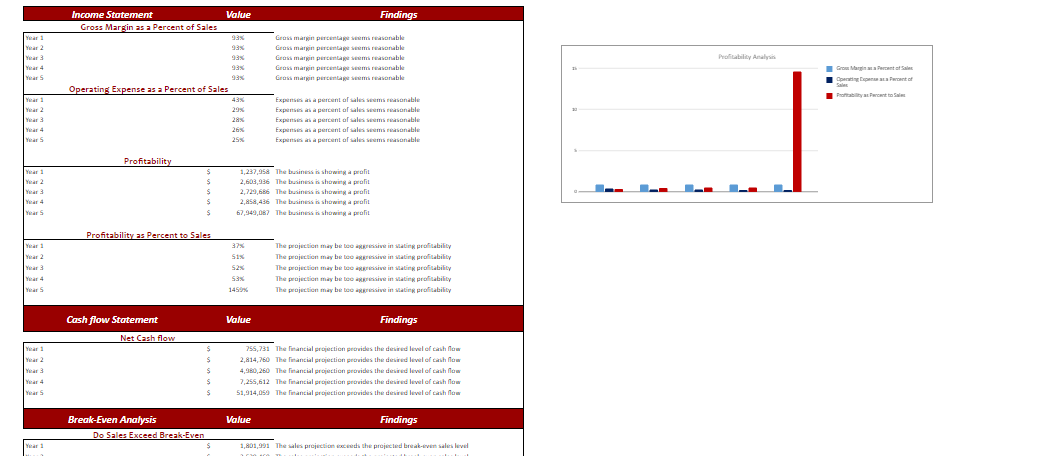
10: Diagnostic Sheet
The diagnostic tool sheet again is a compact pitch book for fund generation marketing strategy. Probable investors can quickly analyze and access profit margins, cash flows, and break-even metrics to decide. Suppose to invest in this business or not. All the outcomes of the dashboard and diagnostic tool sheets show with no user interference. Thus saving time and cost for the business owner. In addition, this Diagnostic sheet automatically calculates the data such as the Profitability ratio, Net operating expense ratio. That will provide financial commentary about the company’s financials.
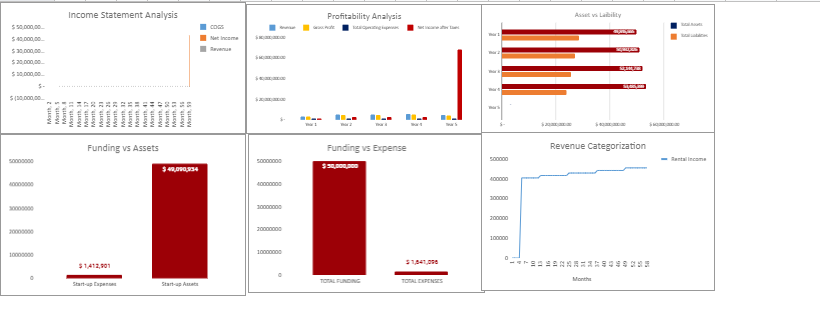
11: Dashboard
Users and readers respond and process visual graphs better than data. The dashboard provides you a graphical management tool that helps track all your relevant financial KPIs. It also Improves cash flow management sales and net revenue in detail to meet the financial objectives of your business.
# How To Use Real Estate Simple Residential Property Valuation Excel Financial Model.
For the purpose of making this model easy to use, Oak Business Consultant has designed this Excel Financial Model with maximum care. Each cell has a color code, and the input areas are all highlighted in peach color.
The User is only required to input data in color cells. All other cells are either helping calculations or results of the model. Therefore there is no need to change any other cell except colored cells.
# More About Financial Modelling:
Contact our expert if you are confused about buying our template. The experts can provide you a 15 min DEMO of the financial model.
# About Us
Oak Financial Model is a combination of financial and data analytics. For this, we have strong skills in math, financial analysis, accountancy, management performance indicators, and organize this data into the dashboard for clients.
# Our Mission
Our mission is to be the industry leader in our business domain, which comes after an in-depth analysis of the market situation and ever-changing business trends. We believe that financial and business consultancy requires a complete understanding of the continuous changes in the market and economy and its effects on business.
# Our Vision
Our Vision is to be reputed as the best Financial & Management Services Consultants by providing top-notch services and to create goodwill based on an excellent performance.
# Our Core Values
Our business motto is derived from the fact that High Quality surpasses Quantitative work and with that in mind we strive for a disciplined approach to analyze the business situations and identify the best solutions to achieve the financial plans. In the same time, we help in opening new doors by providing our state of the art financial services, and management tools.
# Real Estate Simple Residential Property Valuation Excel Financial Model
The Real Estate Simple Residential Property Valuation offers the financial analysis of existing and new residential investments. The Residential Real Estate Industry has seen a boom through the last decade. As a Residential Real Estate Industry player, you may add a new line of business by acquiring a close competitor or a newly built high rise and utilize this model for better business analysis and forecasting.
This model consists of three financial statements: Monthly Income Statement, Yearly Income Statement, Balance Sheet, and Cashflow Statement. Along with the decision-making tools such as; Break-Even Analysis, Project Valuation, Diagnostic Tools, Startup Summary, and various Charts & Graphs.
# Key Inputs of Real Estate Simple Residential Property Valuation Excel Financial Model.
1: Investment Sources
2: Property Acquisition Cost
3: Rental Analysis
4: Debt-Investment Ratio
5: Rental Income
6: Vacancy Ratio
7: Future Sale Price
8: Tax Rate
9: Renovation Cost Table
10: Operational Expense
# Key Features Real Estate Simple Residential Property Valuation Excel Financial Model.
1: Input Sheet
The Input Sheet specifies all the required inputs necessary to compute three financial statements. First, whenever an investor buys an existing building, it has to be renovated as per one’s need and business ideology; Real Estate Apartment Acquisition Model Financial Model does cater to this by adding a fully loaded renovation cost structure plan in a separate sheet under the operational cost head, which will be covering below.
Second, to calculate the true cost of financing the project, the model asks for a loan-value ratio. Then, it automatically calculates the financing amount to be arranged by the owner. Third, monthly borrowing cost is also calculated spontaneously just by entering financing terms and mortgage rates.
Similarly, the investment holding period is ascertained if the user enters its time to renovate, retain and then market to sell. This three-phase holding period is dynamic enough to cater to the delay in investor experiences while selling the property in the future. Revenue generation for a structure is primarily based on rental income, and that too comes with vacant days in a year.
Apparently, an unoccupied unit is a cut on revenue. Therefore it is safe to assume as cost charged against business revenues. Just like the model facilitates determining true property acquisition cost if an investor wants to sell the property in the future, the model adjusts future sales price and all relevant costs needed to dispose of the asset.
Real Estate Apartment Acquisition Model Financial financial model template contains inputs that, when changed, impact the calculations and, therefore, it changes all relevant sheets. As a result, this financial model always has built-in flexibility to display different outcomes or final estimates based on this sheet’s changes.
2: Operating Expense
The operational expense sheet is 2nd one in the row, which entails all expected recurring and non-recurring expenditures, which the owner must account for while starting the business. It starts with employees’ and consultant’s overhead costs. Apart from a fixed salary, employees benefit worker compensation provision is there so that users don’t have to look around for additional payroll expenses, which arise from time to time. The model also incorporates expected cash outflows caused by hiring advisors/ consultants to revamp business strategy.
3: Rental Analysis
The rental analysis sheet serves as a pre-requite to the Revenue Analysis sheet. Here, all the property’s rooms/keys/units detail appears. Along with the unit type, it’s a brief description. Total units add to the input sheet. Per unit, rent shown here multiplies with the number of units available. Therefore, it will yield the total rent per category of units.
Similarly, all the unit’s rental income declines by the vacant rooms. This income connects to Revenues Statement. Rental Analysis also accommodates the number of rooms vacant per category.
Thus all vacant rooms are taken into consideration for rental calculation.
4: Startup Summary
A start-up summary tab includes the total cost incurred at the start of business and capital expenditure, how much cash injected by the company so far, and the number of months the Templateinvestment required.
A Startup Summary helps you take a realistic view of your idea and double-check whether the business has enough funds to support operations.
5: Monthly & Yearly Income Statement
The Real Estate Simple Residential Property Valuation Financial Model provides the monthly and yearly income statement structure and a framework for creating a full corporate forecasting model tailored to your particular business.
A vital feature of the real Estate Simple Residential Property Valuation Financial Model is that it is “integrated,” which means that the Income Statement accurately captures the connection and inter-linkages of the various line business items. An integrated financial model is powerful since it enables the Financial Model user to change any assumption in one part of the statement to see how it impacts investors template other parts accurately and consistently.
The monthly Income Statement sheet of the real Estate Simple Residential Property Valuation Financial Model Template is ideal for those who require regular reporting and details. Additionally, Income Statement contains all revenue streamlines with gross earnings, net earnings linked with a revenue analysis sheet to ensure accurate reporting.
Oak Business Consultants understands every business’s goal. Therefore, we have developed a mechanism that helps business owners determine whether they are making profits or otherwise.
Furthermore, the Yearly Income Statement gives you complete insights into revenue and general & administrative expenses. The Yearly Income Statement also contains several graphs, assumptions, ratios, margins, net profit, earnings, cost of services, and profit after tax.
6: Balance Sheet
This balance sheet enables you to analyze your position of current assets, fixed assets, liabilities, and equity. It also allows you to monitor your accounts receivable, accounts payable, accrued expenses, etc. Therefore this specific, financial model gives you the perfect space to analyze your critical financial balance accounts.
7: Cash Flow Statement
The Cash Flow Statement is the vital part of the three statements that report the cash spent and generated during a specific period. The Cash Flow Statements connect cash rotation between the income statement and balance sheet.
# Three main sections of Cash Flow Statement:
1: Operating Activities: We have included all cash in and out related to the operations of the business.
2: Investing Activities: Any cash from the disposal of an asset and acquisition and investments appear in this section linked to the inputs and fixed asset tab.
3: Financing Activities: We have separately made a loan-related tab where you can enter all loan-related information thee. The tab connects to Financing Activities of Cash Flow Statement.
The Cash Flow Statement in our Model contains a dedicated sheet to monitor and analyze your company cash-ins and out. This cash flow statement relies on several key inputs, such as Payable and Receivable Days, yearly income, working capital, long-term debt, net cash, etc.
This calculation then computes your net cash flow, beginning and end cash balances. It’s a perfect template for your company’s cash flow management.
8: Break-Even Analysis
A break-even analysis can help you measure how different scenarios might play out financially. For example, if you increase the marketing budget or add another employee to the payroll, how many extra sales will recover that additional expense?
As a coup, we have included a Break-even analysis to our Financial Model, which will help the user determine sales. The break-even analysis will help you know at a glance the profits generated at the various sales levels.
The Break-Even Analysis refers to the point where your total sales contribution refers to fixed cost at zero profit and loss. This Technique consists of marginal costing, which behaves differently at various levels of output activity.
9: Project Evaluation
The project valuation sheet is critical because it gives the directional strategy to an investor either the project should be investing in or not? This sheet is fully linked to all financial statements projected earlier and asks for little input from the user. WACC, the weighted average cost of capital, is discretionary and needs to be put in by the investor itself, keeping in view all equity and debt holders’ costs.
The initial investment is the total project cost that the user has added to the input sheet. Equity and debt values in that project investment amount took from loan-value ratios, which the user defines in the input sheet.
The terminal growth rate is the rate that users foresee a business may earn after a five-year forecast. This rate is hardcoded by the user, keeping in view a specific industry, country, and region in mind. The sole purpose of the project valuation sheet is to use the DCF model to discount back all future expected cash flows of the firm at a discount rate or WACC (set by user).
Then determine the NPV/ free cash flows to the firm (both equity and debt holders) to see if the project has positive or negative net cash flows. Next, the debt/ loan amount is minus to arrive at free cash flows to equity holders. Finally, IRR equals IRR function to see if the project’s IRR is greater than or less than the discount rate.
10: Diagnostic Sheet
The diagnostic tool sheet again is a compact pitch book for fund generation marketing strategy. Probable investors can quickly analyze and access profit margins, cash flows, and break-even metrics to decide. Suppose to invest in this business or not. All the outcomes of the dashboard and diagnostic tool sheets show with no user interference. Thus saving time and cost for the business owner. In addition, this Diagnostic sheet automatically calculates the data such as the Profitability ratio, Net operating expense ratio. That will provide financial commentary about the company’s financials.
11: Dashboard
Users and readers respond and process visual graphs better than data. The dashboard provides you a graphical management tool that helps track all your relevant financial KPIs. It also Improves cash flow management sales and net revenue in detail to meet the financial objectives of your business.
# How To Use Real Estate Simple Residential Property Valuation Excel Financial Model.
For the purpose of making this model easy to use, Oak Business Consultant has designed this Excel Financial Model with maximum care. Each cell has a color code, and the input areas are all highlighted in peach color.
The User is only required to input data in color cells. All other cells are either helping calculations or results of the model. Therefore there is no need to change any other cell except colored cells.
# More About Financial Modelling:
Contact our expert if you are confused about buying our template. The experts can provide you a 15 min DEMO of the financial model.
# About Us
Oak Financial Model is a combination of financial and data analytics. For this, we have strong skills in math, financial analysis, accountancy, management performance indicators, and organize this data into the dashboard for clients.
# Our Mission
Our mission is to be the industry leader in our business domain, which comes after an in-depth analysis of the market situation and ever-changing business trends. We believe that financial and business consultancy requires a complete understanding of the continuous changes in the market and economy and its effects on business.
# Our Vision
Our Vision is to be reputed as the best Financial & Management Services Consultants by providing top-notch services and to create goodwill based on an excellent performance.
# Our Core Values
Our business motto is derived from the fact that High Quality surpasses Quantitative work and with that in mind we strive for a disciplined approach to analyze the business situations and identify the best solutions to achieve the financial plans. In the same time, we help in opening new doors by providing our state of the art financial services, and management tools.
This Best Practice includes
Excel File
