The use of Monte Carlo Simulation in DCF Analysis - A Simple Example
Originally published: 01/07/2022 15:21
Publication number: ELQ-13465-1
View all versions & Certificate
certified

The use of Monte Carlo Simulation in DCF Analysis - A Simple Example

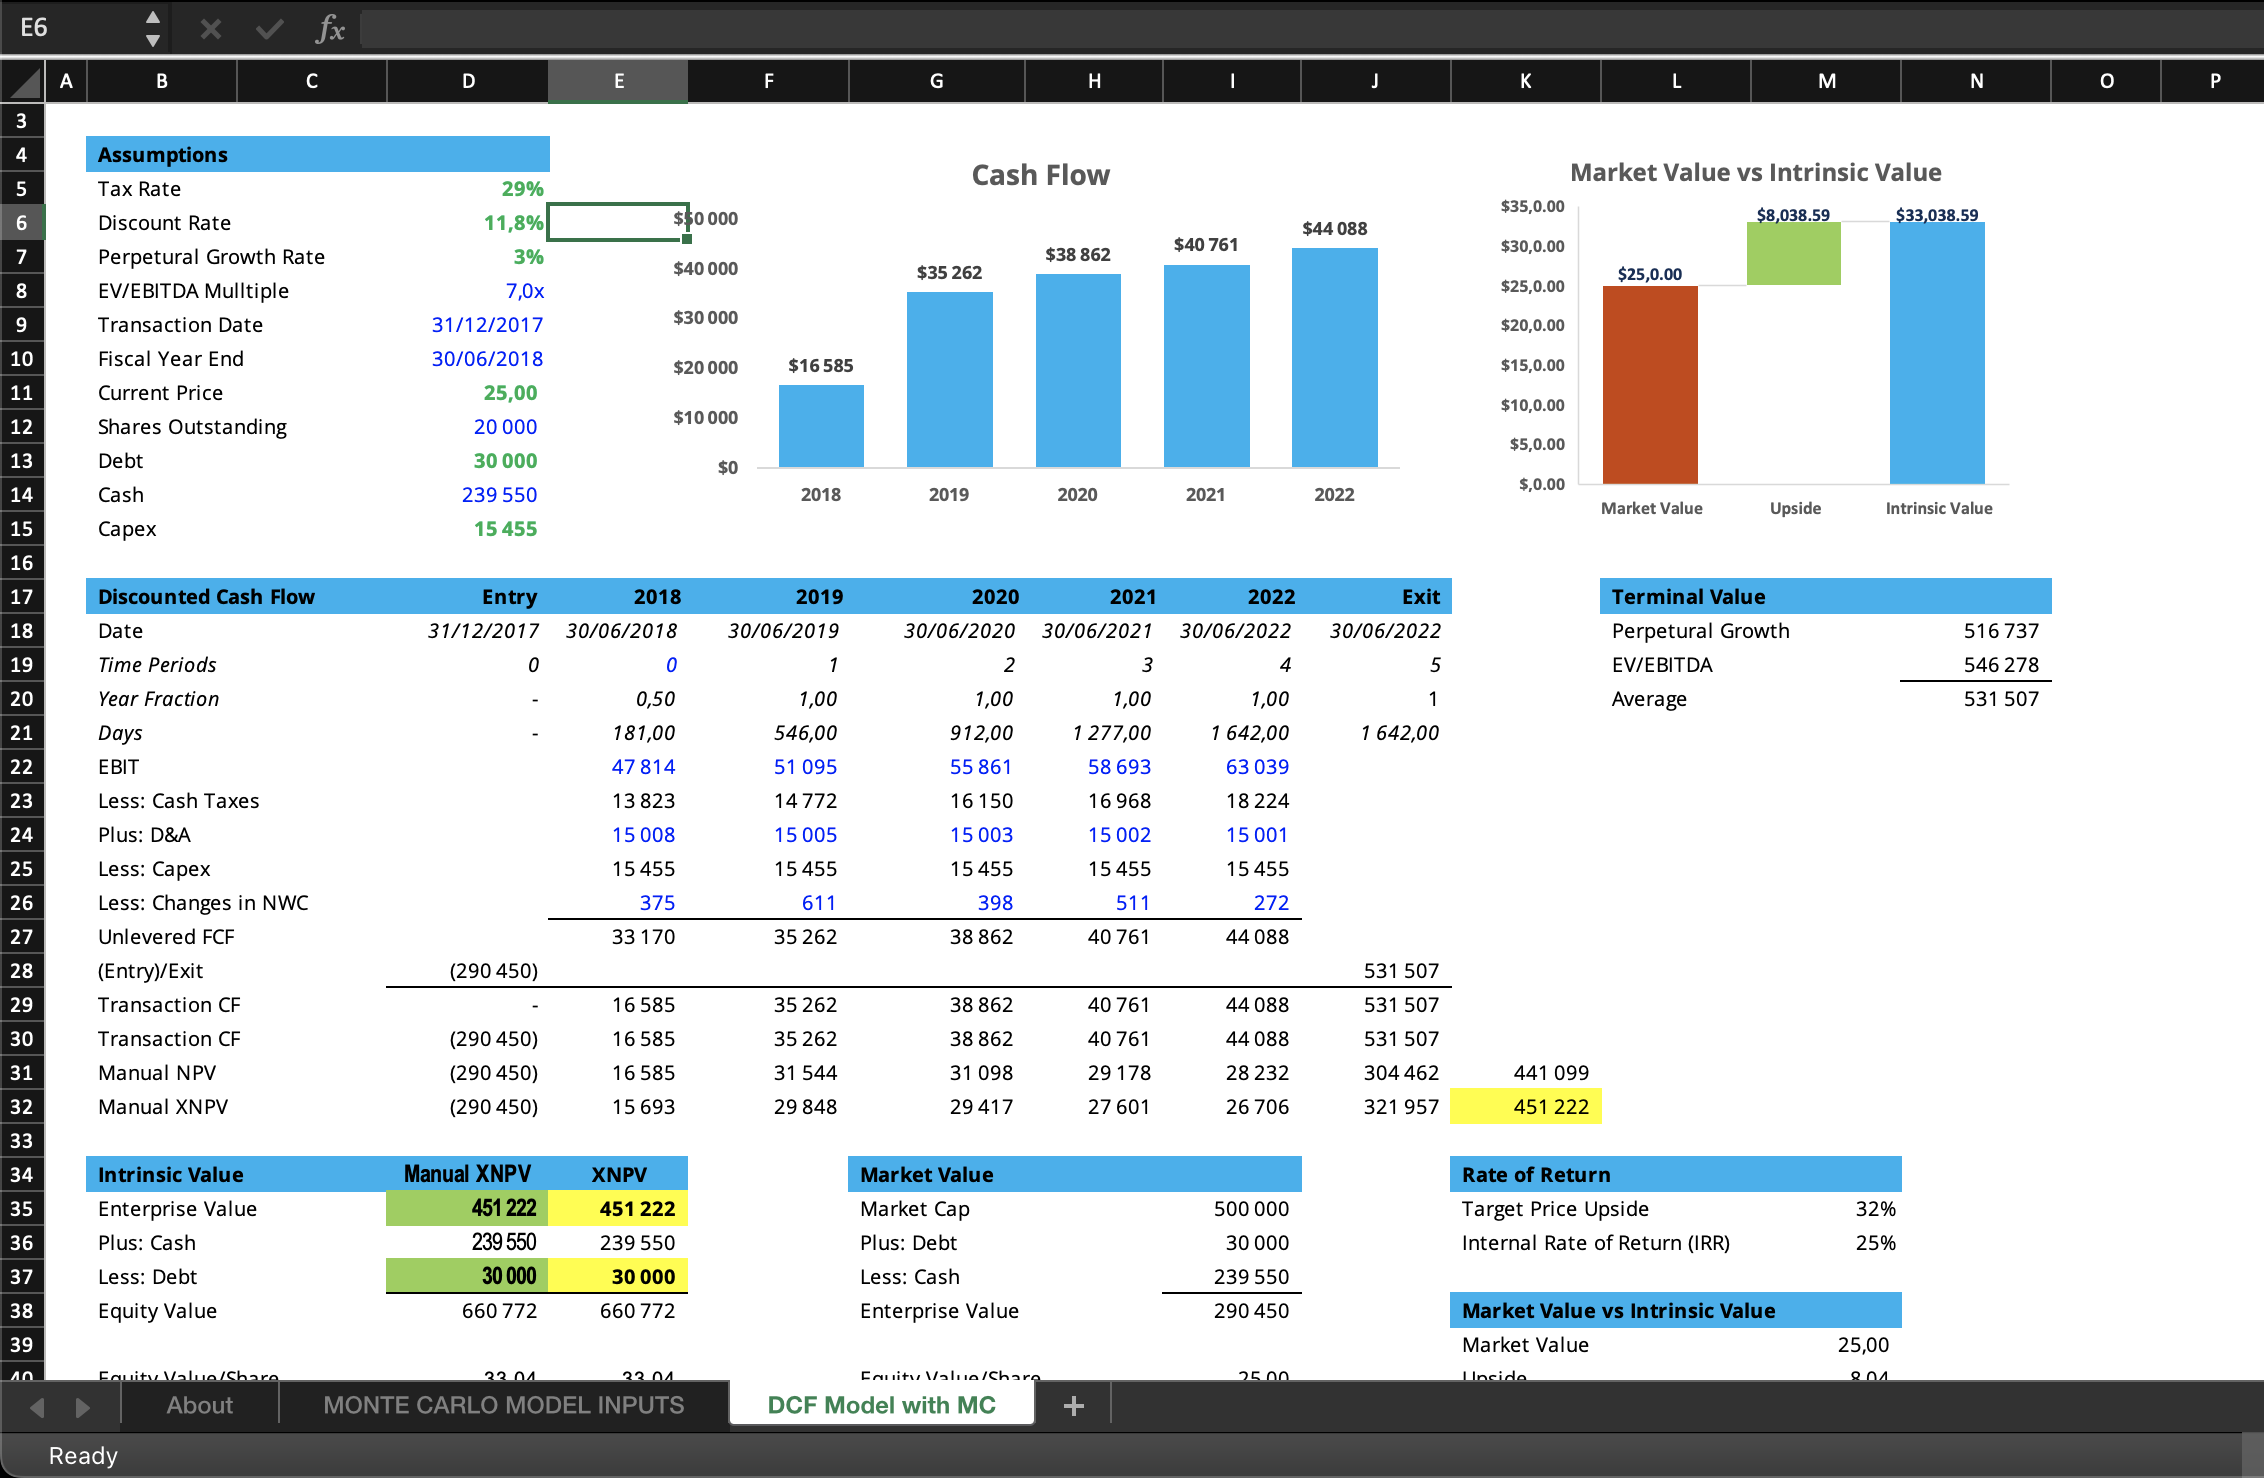
Simple user-generated Monte Carlo Simulation for Discounted Cash Flow

Description
When it comes to monte carlo simulations or MC simulations, it usually requires quite a large dataset to get a good representative average, standard deviation and an idea of the shape of the distribution to choose a suitable probability density function. Usually this type of data is not available. On the other hand, talking to people in the relevant industry, reading up and studying trends and using your own knowledge and gut feeling very often gives you an idea of the range of specific value that is being studied as well as the likelihood or probability associated with it.  This can be used to estimate a user-specified probability distribution. In the simple DCF model shown here, methods to calculate the manual NPV and the manual XNPV are shown. It is not always obvious how these functions in EXCEL are calculated, especially the XNPV function. Hence, in this example the XNPV is manually calculated.  The values generated by the two methods are then compared. Unlike the NPV, the XNPV does not rely on regular time intervals but can be used when fractions of years play a role in the cash flows.  This allows the user to get the true valuation of an asset.  

This Best Practice includes
1 Excel Spreadsheet file

Deon de Wet-Roos offers you this Best Practice for free!

download for free

Add to bookmarks

Discuss

Further information

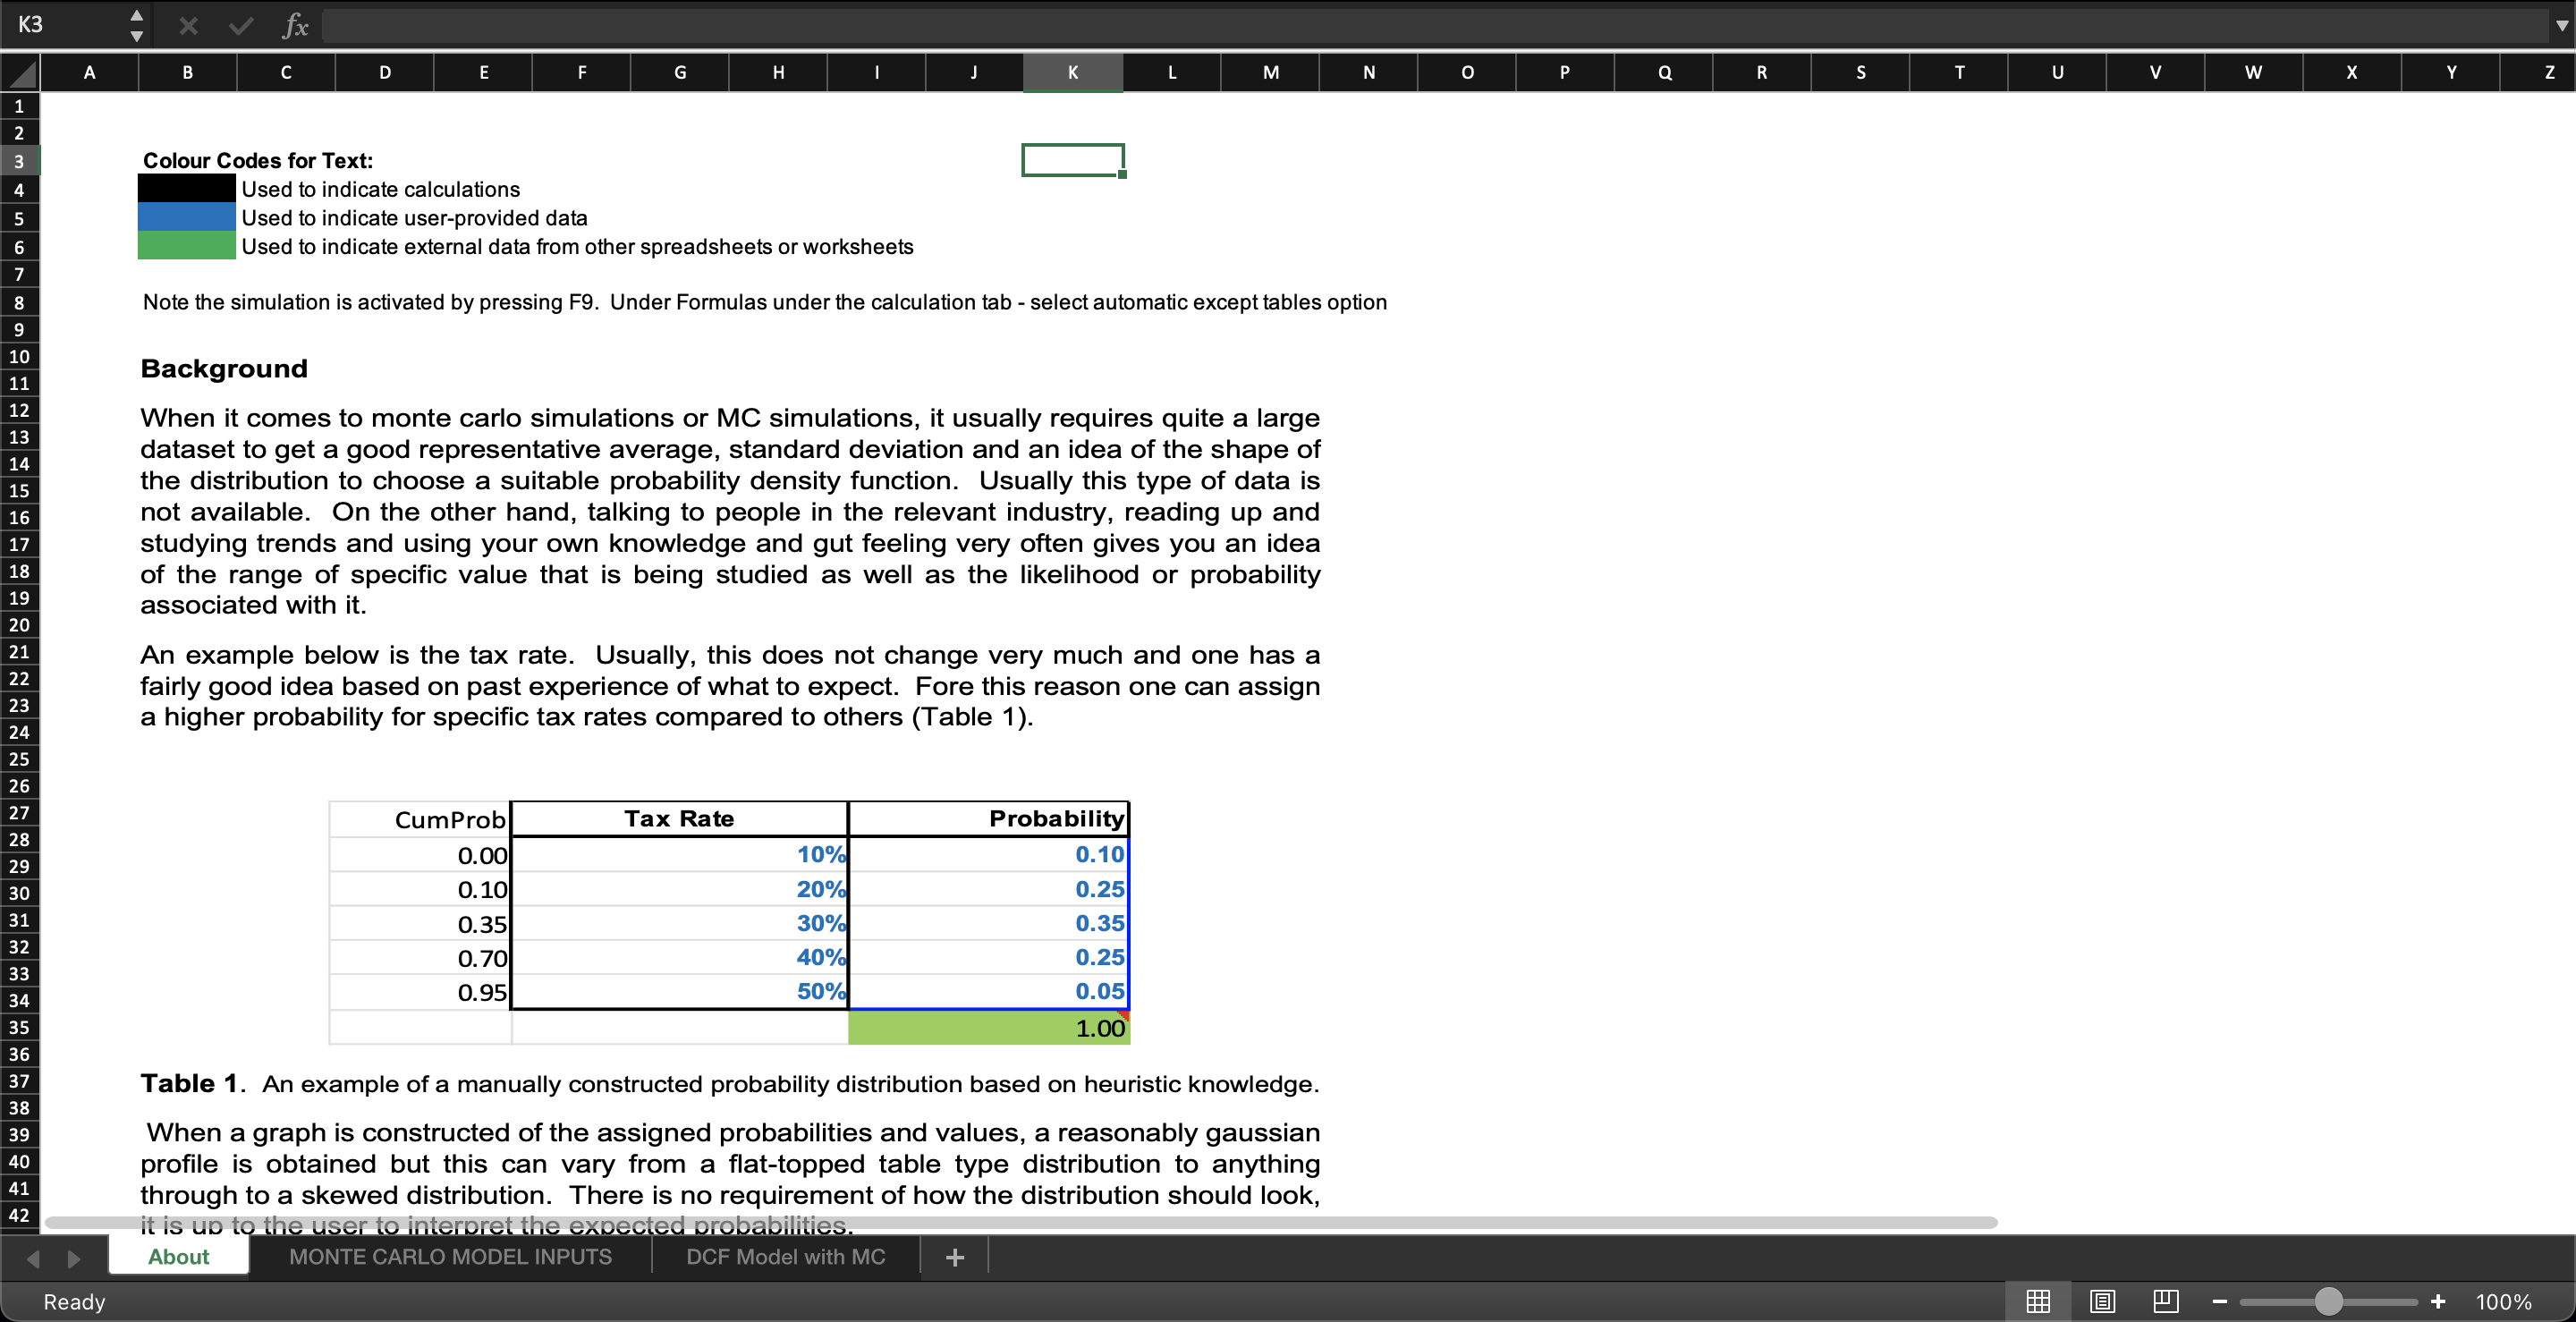
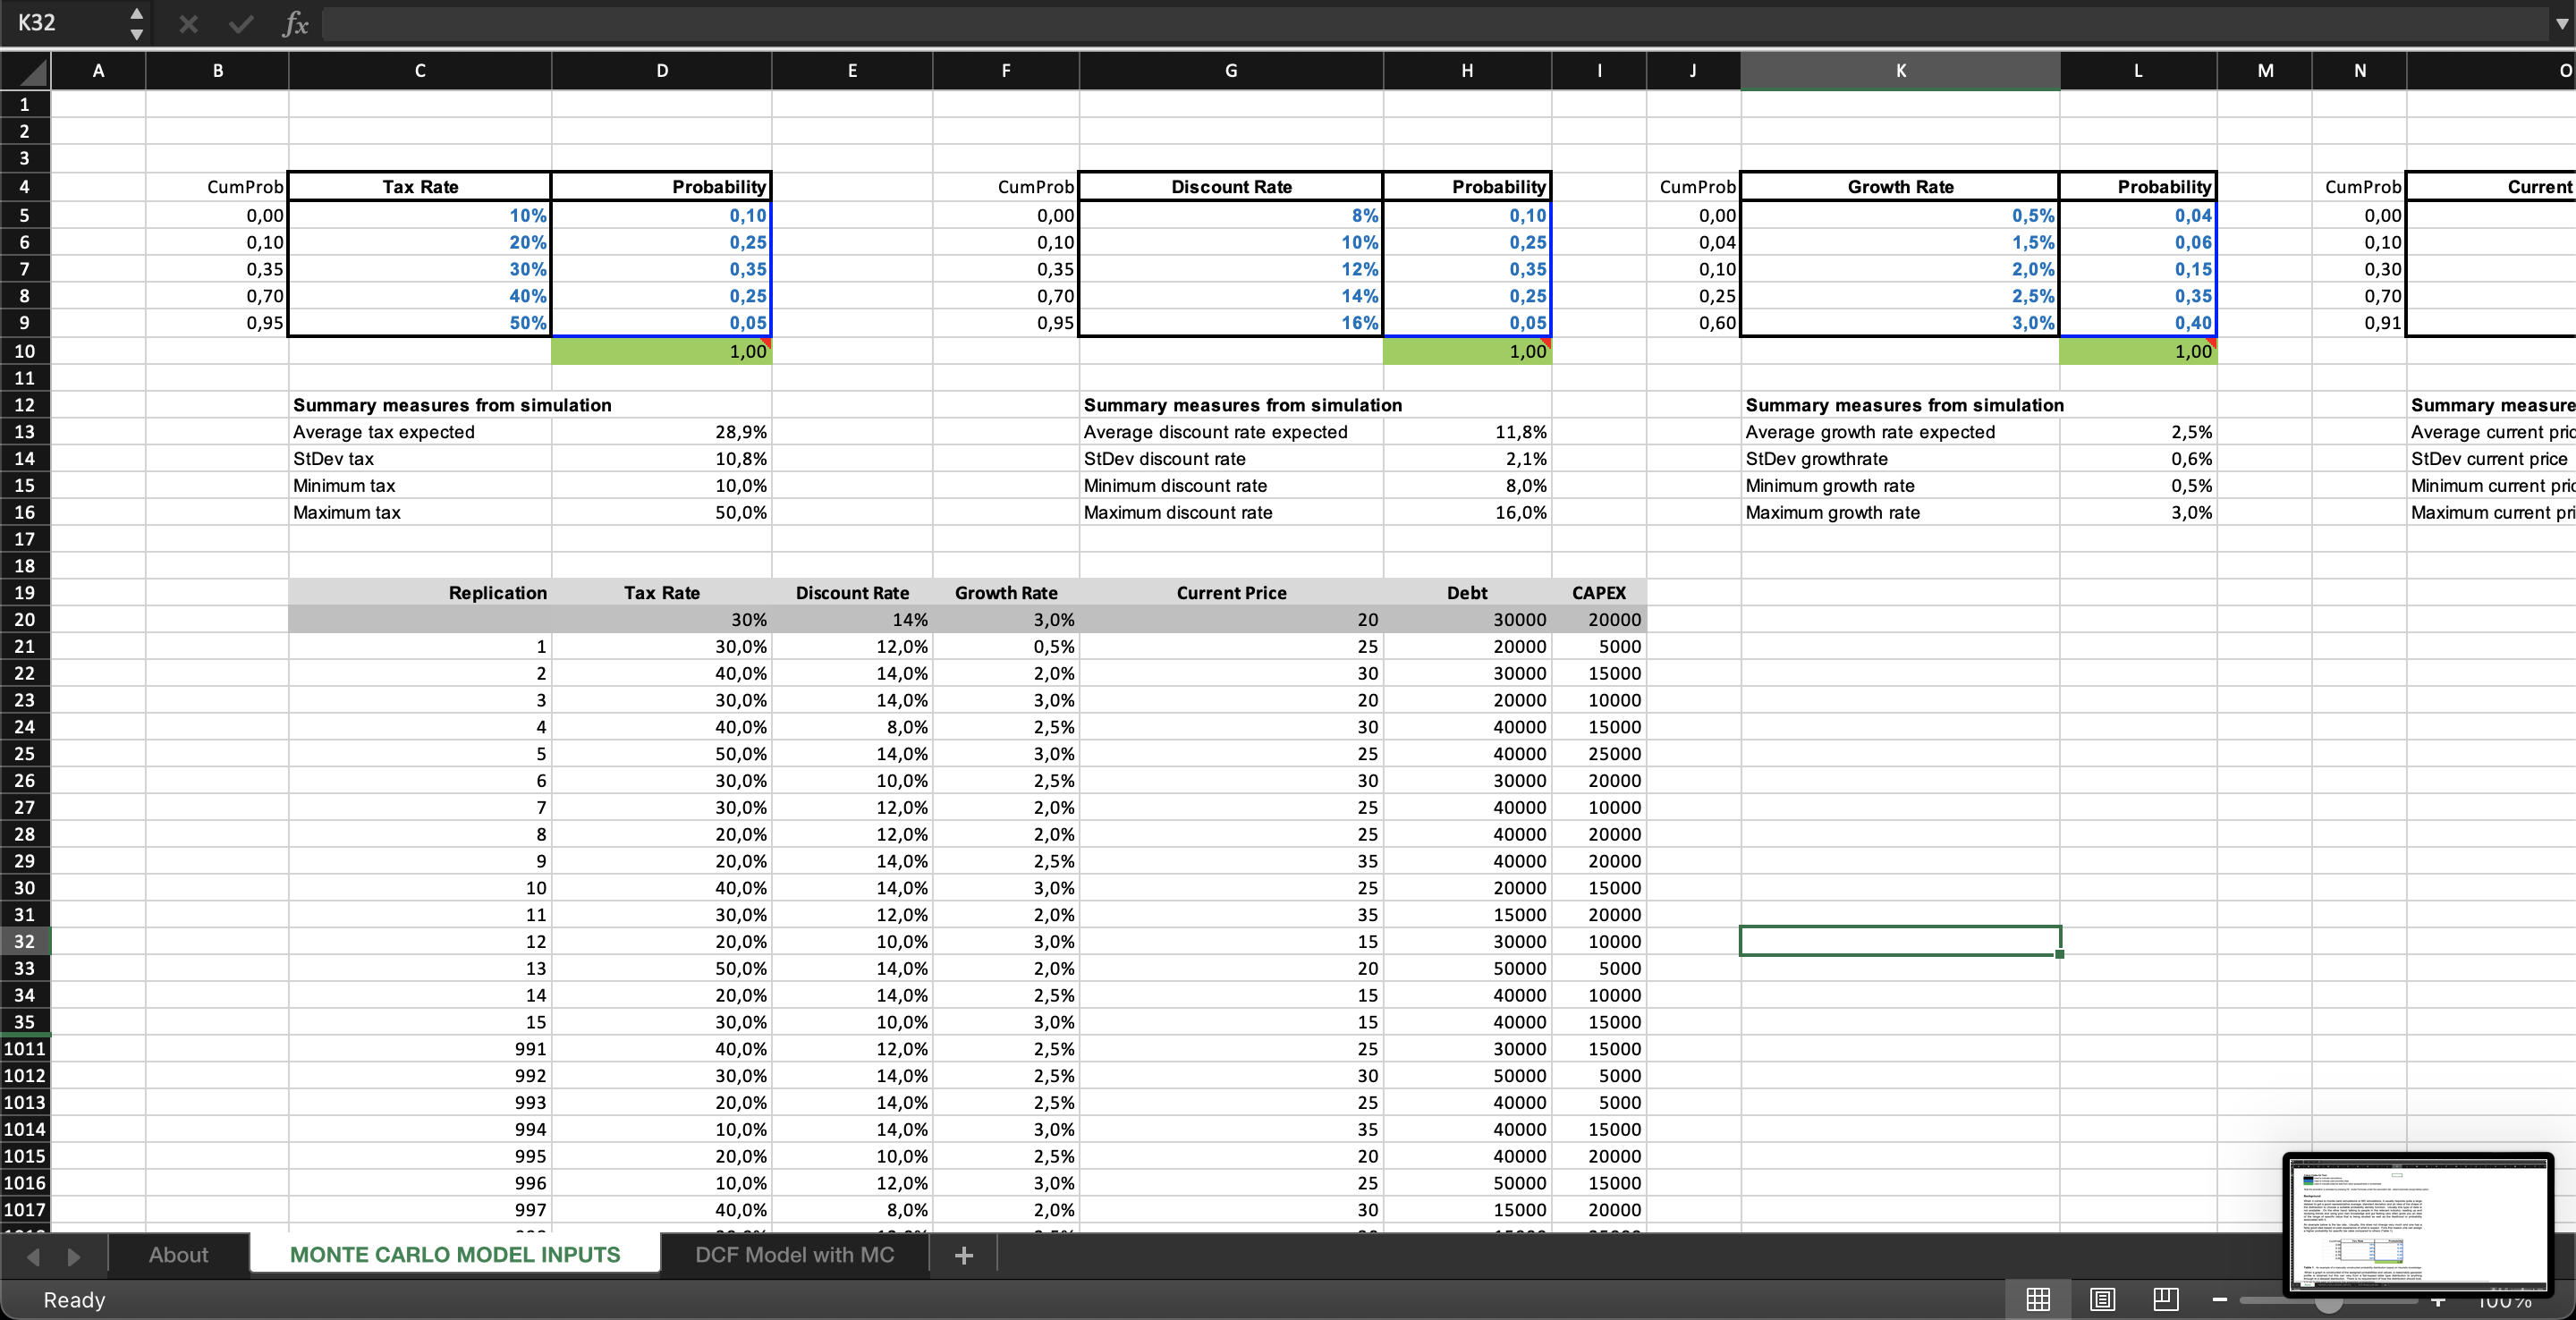
The simulation presented here is simply to demonstrate the use of a user-generated probability distribution in discounted cash flow analysis.

The simulation presented here is for demonstration purposes only and should not be used for any large scale simulations. The underlying principles may be used.


4.7 / 5 (3 votes)

please wait...