
Originally published: 24/08/2020 08:03
Publication number: ELQ-99693-1
View all versions & Certificate
Publication number: ELQ-99693-1
View all versions & Certificate

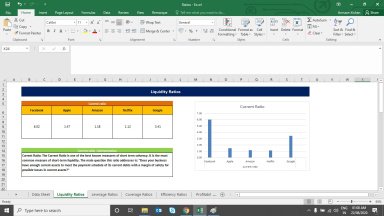
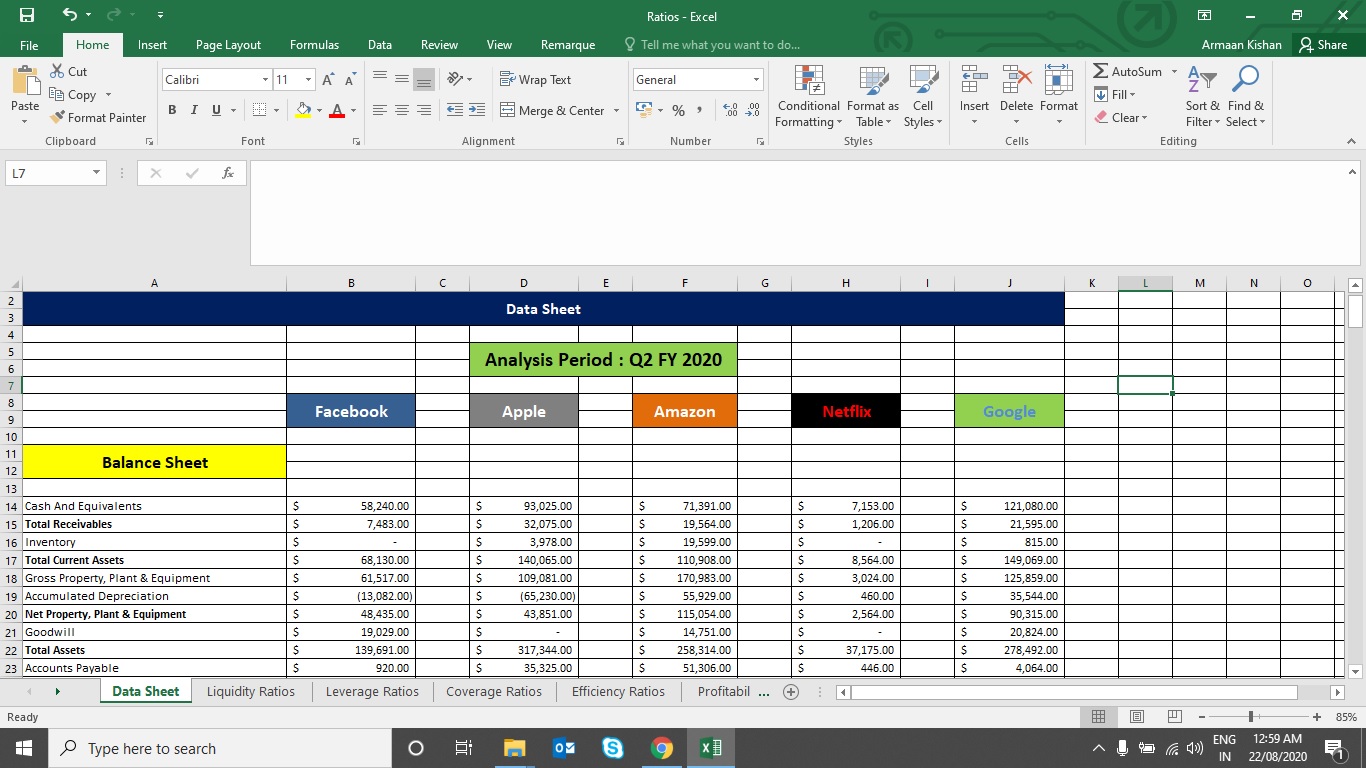
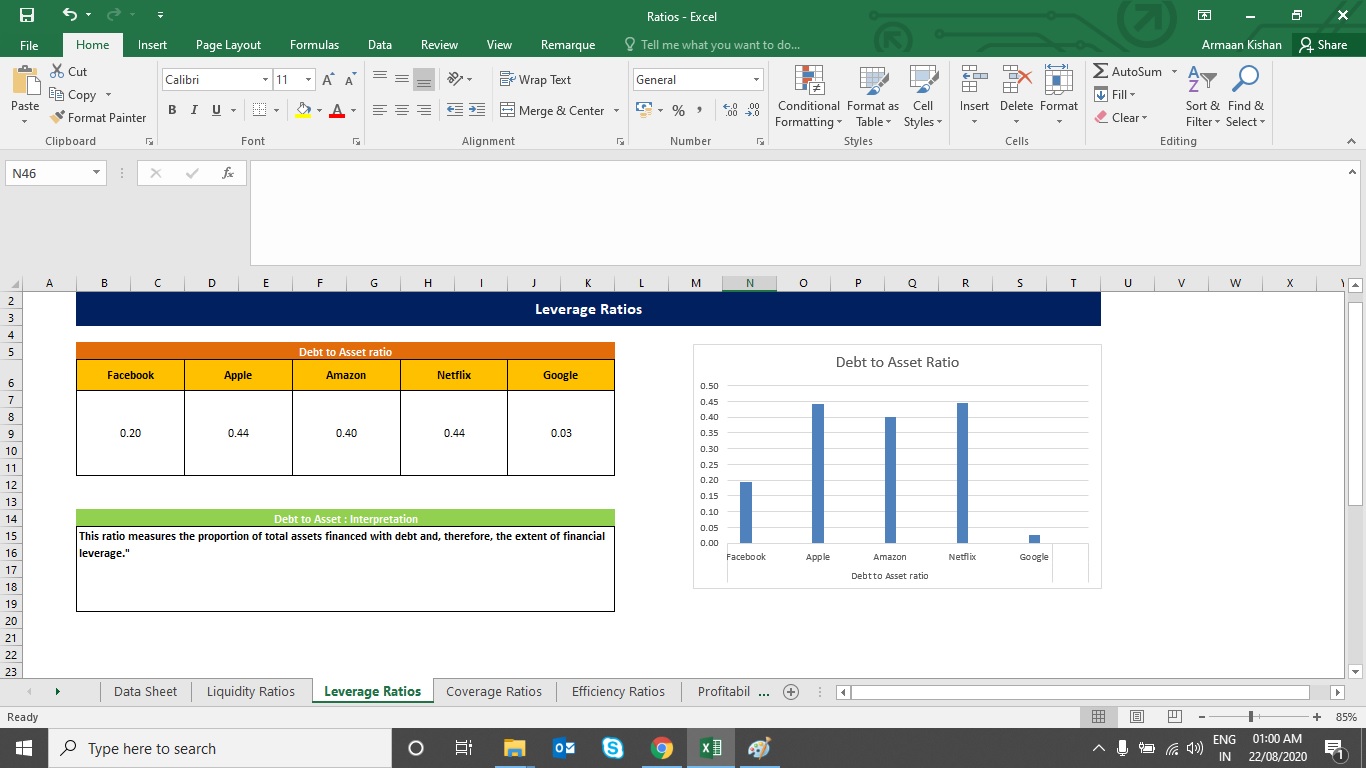
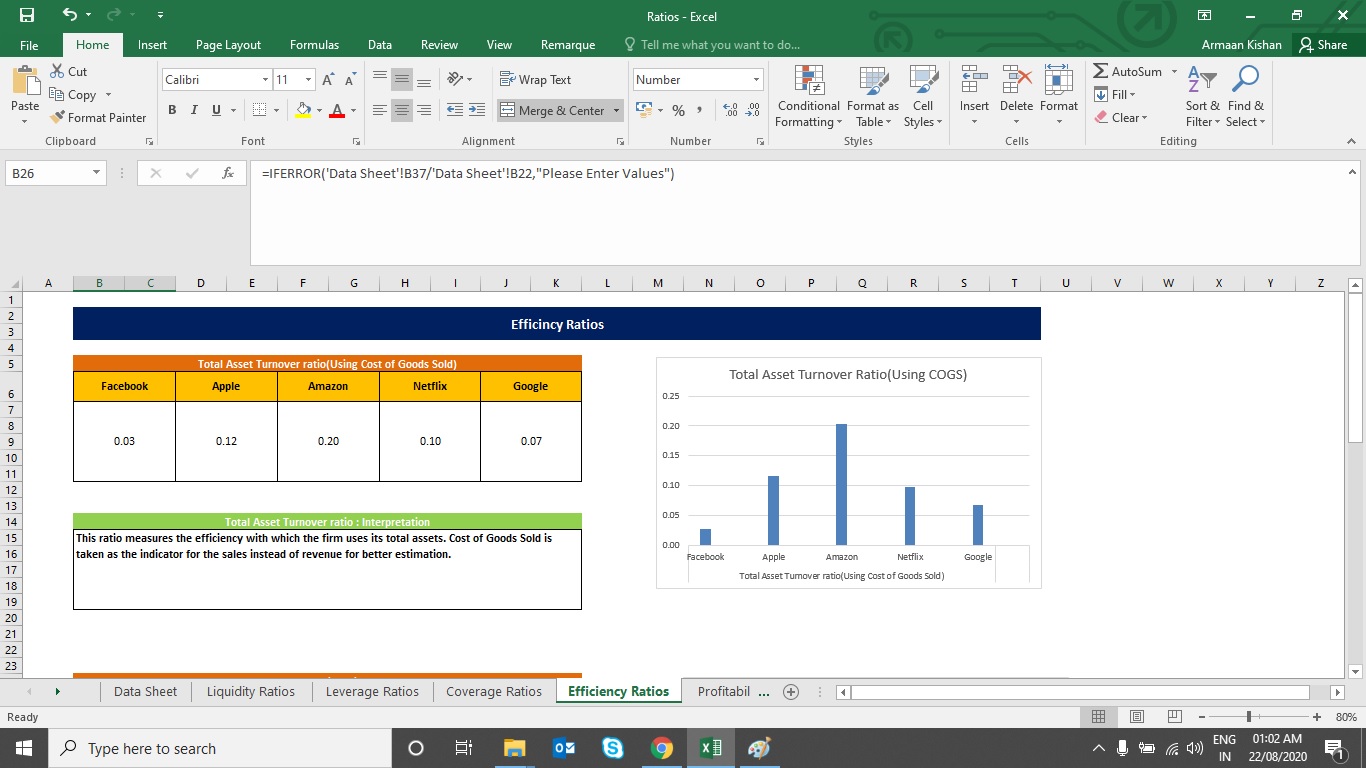
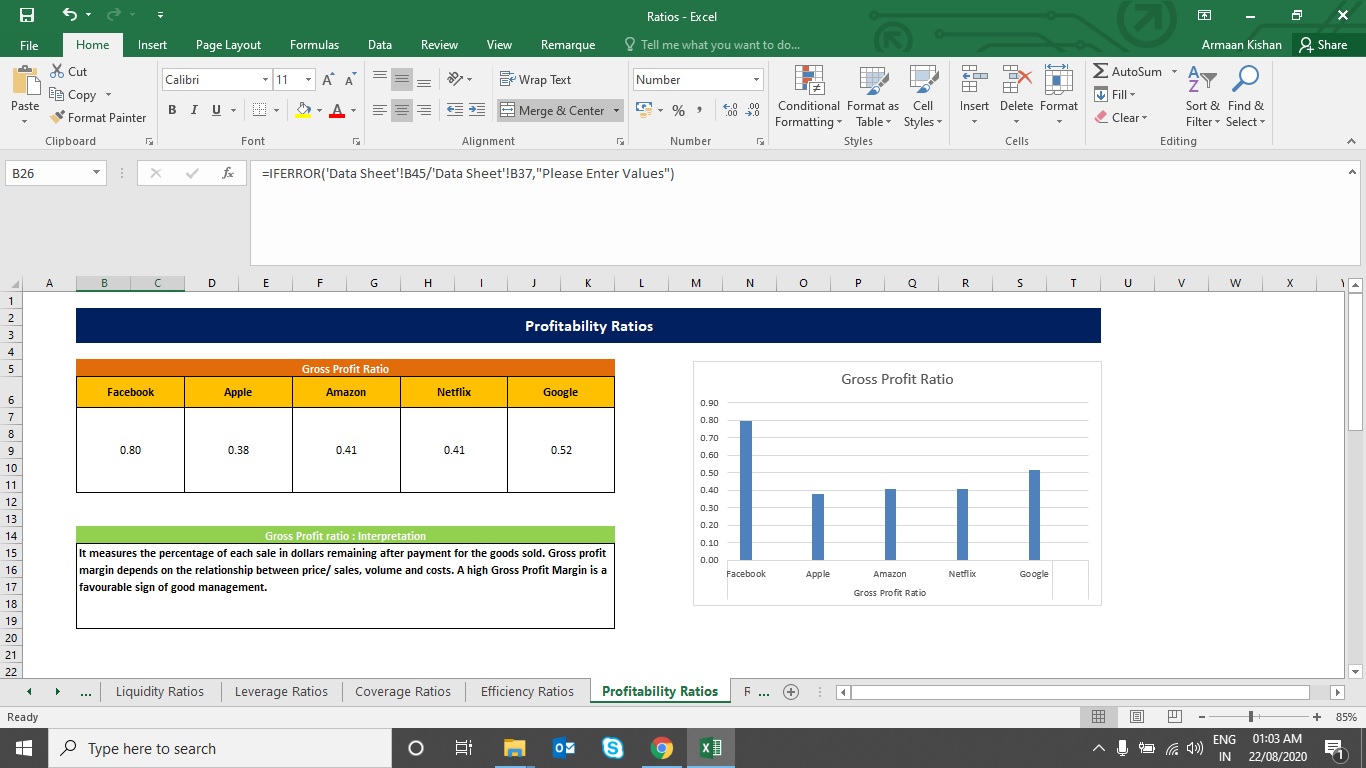
FAANG Ratio Analysis (Q2 2020)
FAANG stocks Ratio Analysis in Microsoft Excel.
Further information
Ratio Analysis of Stocks.
Trading of Stocks
