Originally published: 12/06/2026 12:43
Publication number: ELQ-55692-1
View all versions & Certificate
Publication number: ELQ-55692-1
View all versions & Certificate

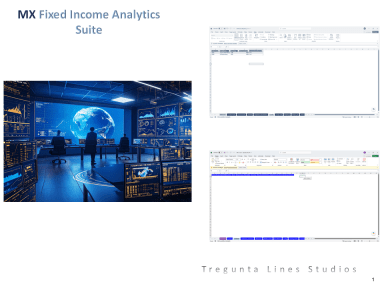
MX Fixed Income Analytics Suite. Automate Scenario Analysis, Attribution, and Risk Metrics With Professional Accuracy
Save 10 to 40 hours per month and produce fast, accurate, audit ready fixed income analytics with this powerful Excel based modelling tool.
portfolio managerfixed income traderrisk manageranalysttreasuryinvestmenteducationvar calculationssteepeners
Description
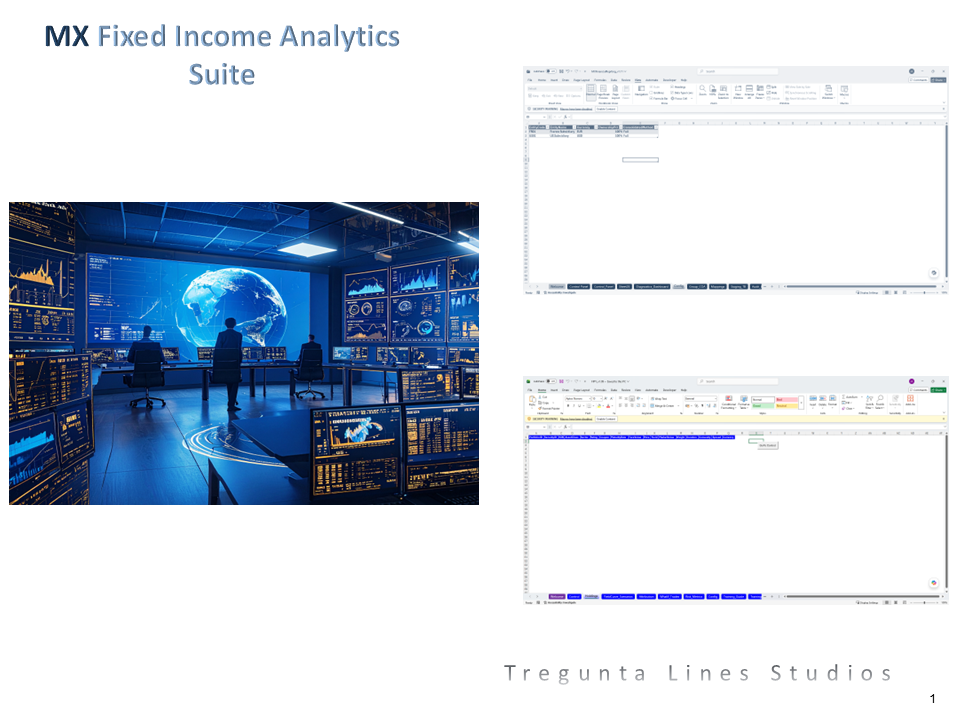
The MX Fixed Income Analytics Suite is a complete fixed income modelling engine that transforms raw bond holdings into accurate, transparent, and professional grade analytics.
It is designed to:
2. Who It’s For
This tool is ideal for professionals responsible for fixed income analytics, including:
Why It Is Better Than Manual Work
Manual fixed income modelling is slow, complex, and highly prone to formula errors. This system solves that problem.
With the MX Fixed Income Analytics Suite, you get:
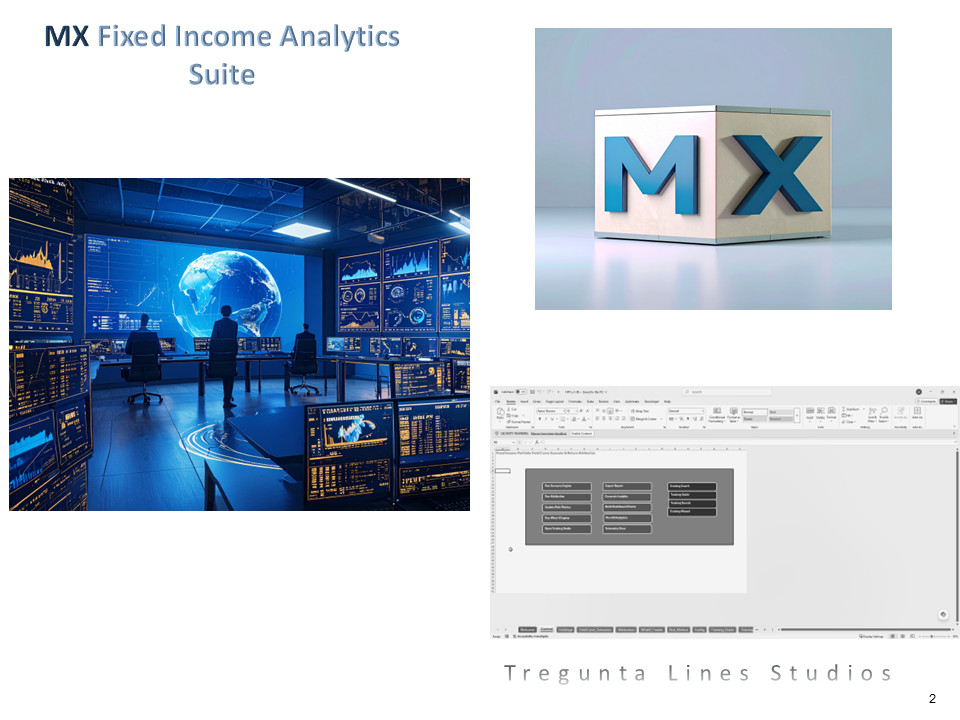
4. What’s Included
You receive a complete, ready to use fixed income analytics system:
5. Time & Cost Savings
This tool delivers real, measurable value for organisations that analyse fixed income portfolios.
Time Savings
The MX Fixed Income Analytics Suite is a complete fixed income modelling engine that transforms raw bond holdings into accurate, transparent, and professional grade analytics.
It is designed to:
- Centralise all holdings, curves, scenarios, and risk parameters in one structured system.
- Automate scenario analysis, return attribution, DV01, duration, convexity, and VaR calculations.
- Model parallel shifts, steepeners, flatteners, butterflies, and custom curve shocks instantly.
- Produce consistent, transparent, and audit ready analytics for every reporting period.
- Replace slow, error prone manual spreadsheets with fast, reliable, structured automation.
- Provide a clear, defensible methodology suitable for portfolio managers, traders, and risk teams.
2. Who It’s For
This tool is ideal for professionals responsible for fixed income analytics, including:
- Portfolio managers
- Fixed income traders
- Risk managers
- Analysts
- Consultants
- Treasury teams
- Investment committees
- Educators
- Anyone who needs accurate, repeatable fixed income analytics
Why It Is Better Than Manual Work
Manual fixed income modelling is slow, complex, and highly prone to formula errors. This system solves that problem.
With the MX Fixed Income Analytics Suite, you get:
- Zero repetitive admin
- Guaranteed accuracy through automated logic
- Consistent results across all scenarios
- No formula maintenance
- Instant outputs
- A transparent audit trail for every calculation
- Professional grade analytics normally found only in specialist systems
4. What’s Included
You receive a complete, ready to use fixed income analytics system:
- Fully automated Excel workbook
- VBA powered analytics engine
- Holdings input sheet
- Yield curve scenario engine
- Parallel, steepener, flattener, and butterfly shocks
- Custom scenario builder
- Return attribution engine
- Carry, rolldown, curve, and spread attribution
- DV01, duration, convexity, and VaR calculations
- What‑if trade simulator
- Dashboard and visual summaries
- Diagnostics and exception checks
- Audit trail and version tracking
- Step by step instructions (included in the download and inside the workbook)
5. Time & Cost Savings
This tool delivers real, measurable value for organisations that analyse fixed income portfolios.
Time Savings
- Reduce analytics time by 50 to 80 percent
- Save 10 to 40 hours per month
- Eliminate manual scenario and attribution calculations
- Produce dashboards and summaries in minutes
- Save 500 to 2,000 pounds per month by reducing manual modelling effort
- Prevent costly errors in risk and attribution reporting
- Reduce labour costs by 2,000 to 8,000 pounds per year
- Improve decision making with accurate scenario analysis
- Achieve a 5x to 20x return on investment within the first month
IMPORTANT - ONLY WORKS on WINDOWS (not on Macintosh iOS)
This Best Practice includes
1 Zipped File with Excel file and Word Document
