
Publication number: ELQ-62802-1
View all versions & Certificate

Product Business Case Financial Model — 5-Year Monthly P&L for Hardware & Physical Products
Excel + Google Sheets model to evaluate product launch ROI across up to six global revenue channels with a 5-year monthly P&L, cost/price modeling, and charts
 by Blueprint Catalyst
Real-world business strategy and models built by operators — not academics.Follow
Further information
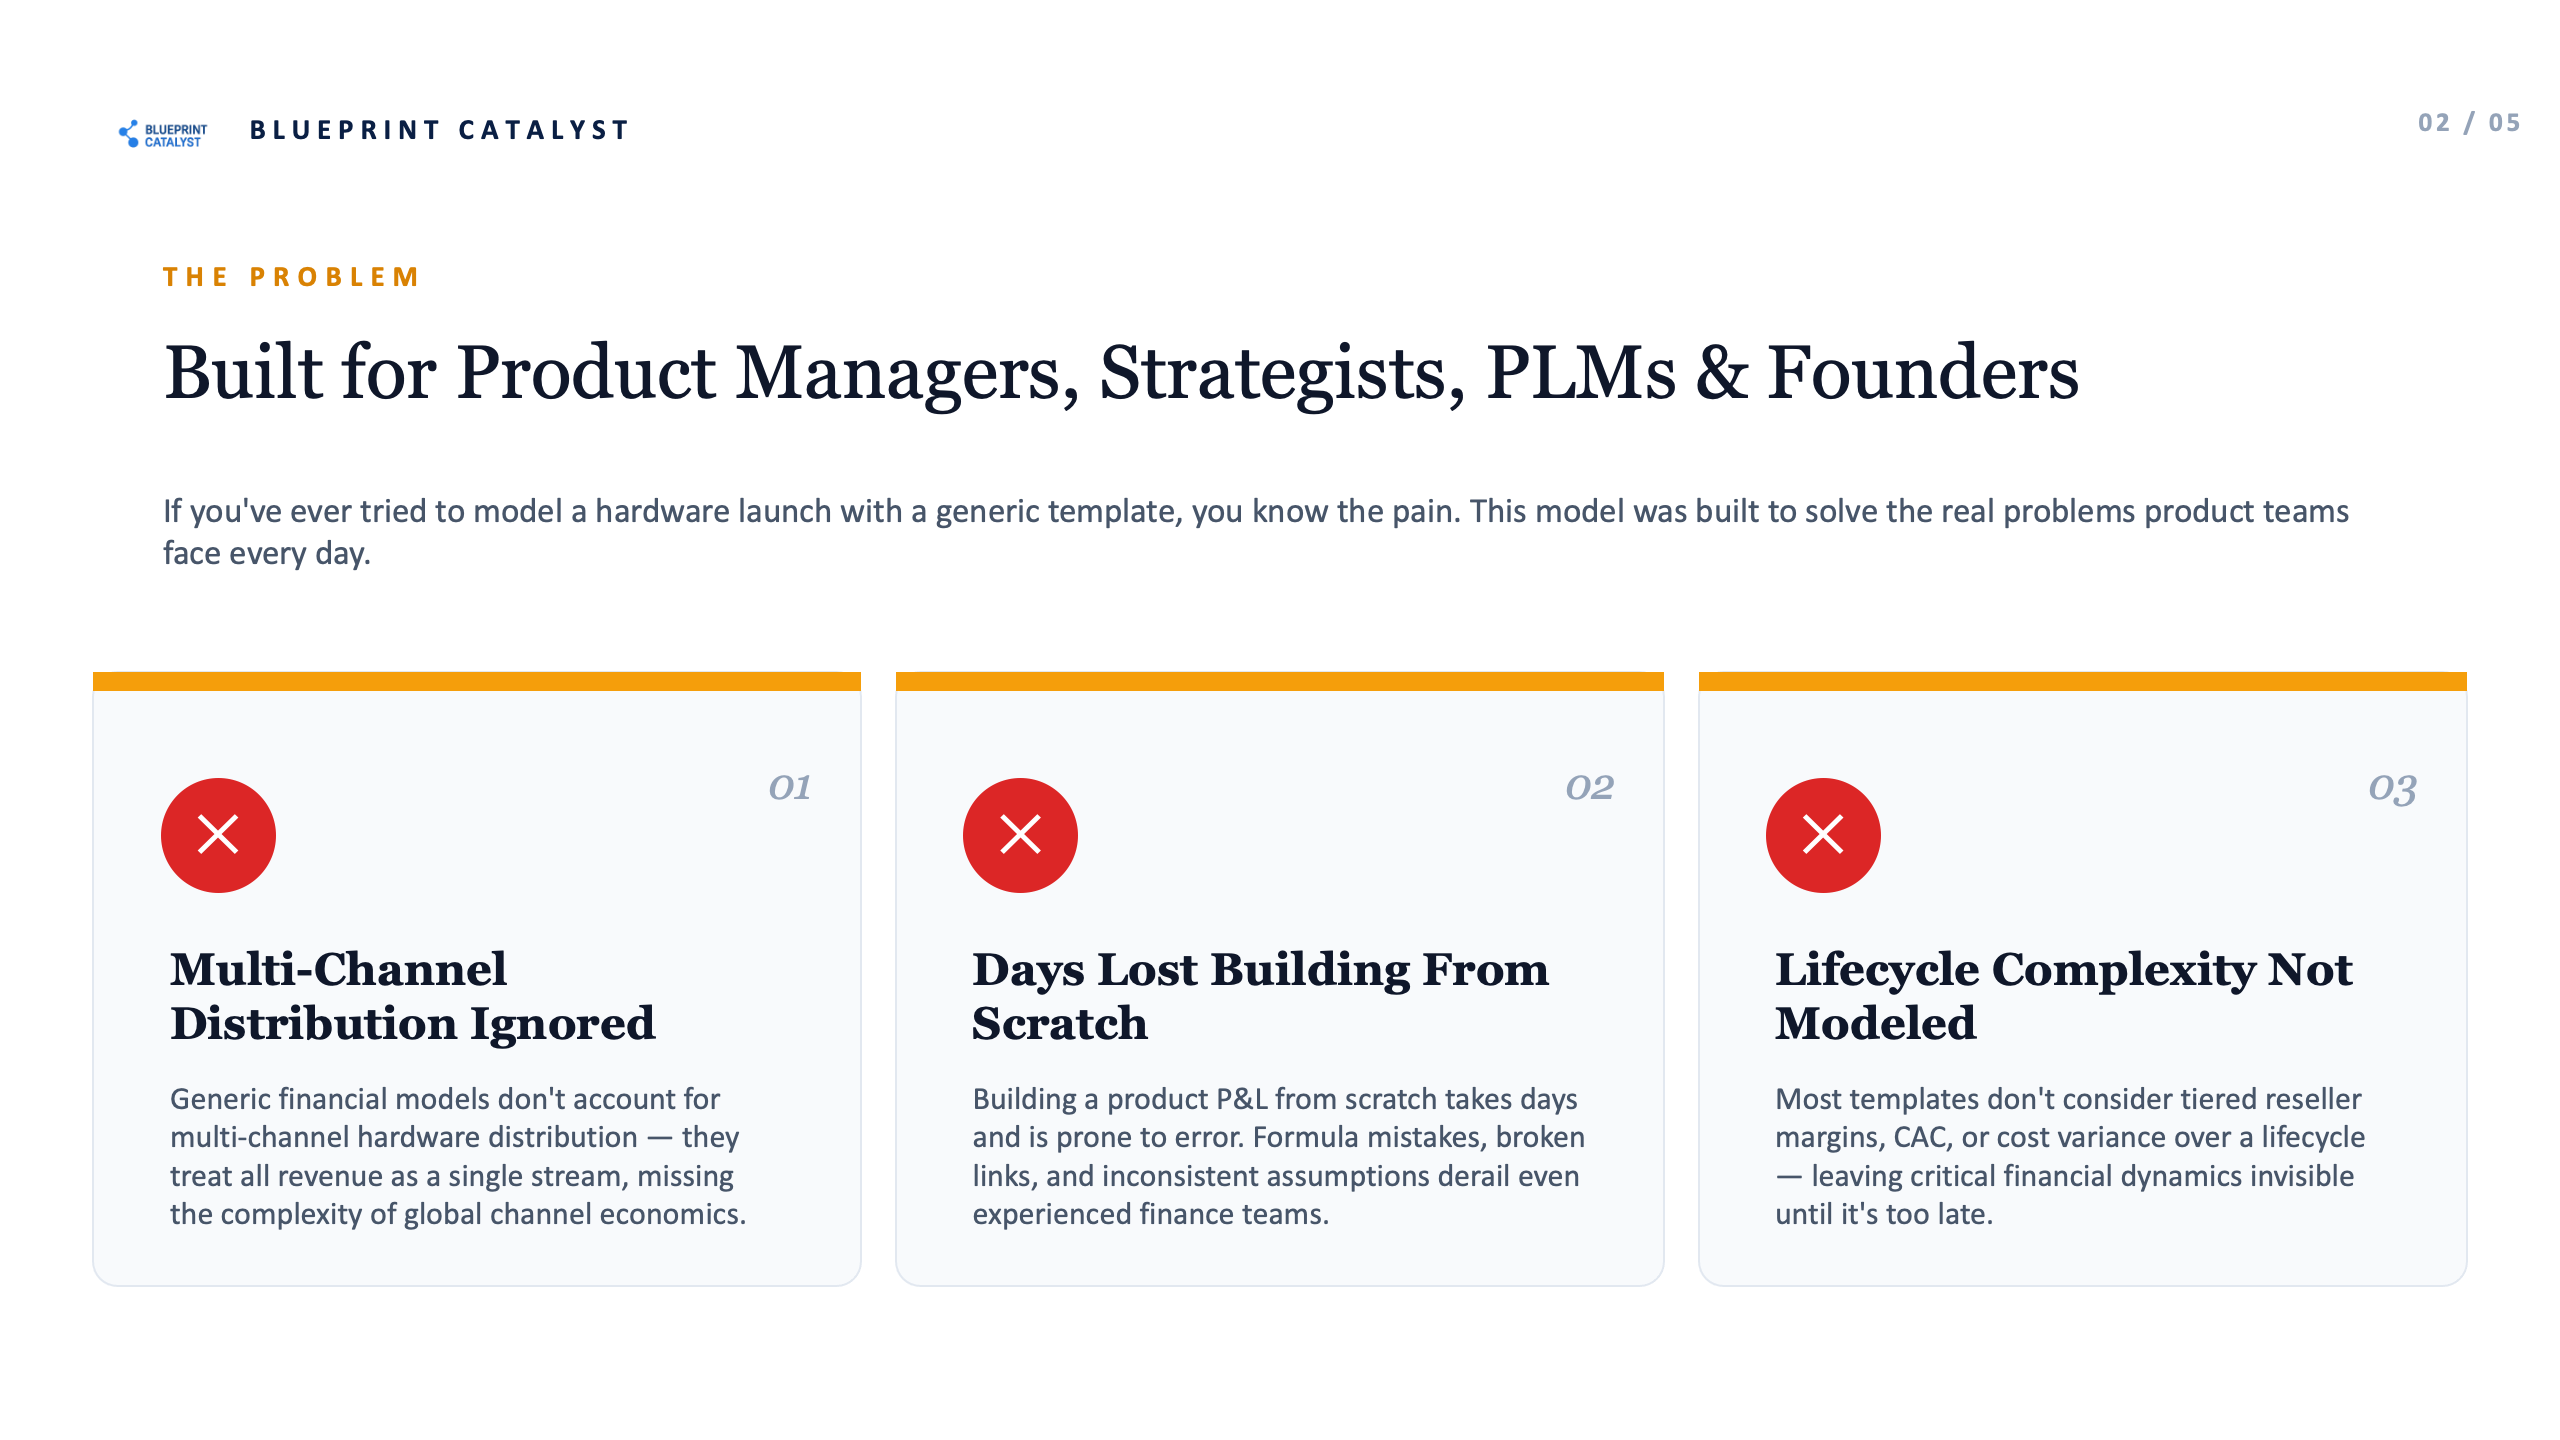
The Product Business Case Financial Model is designed to give product managers, PLMs, founders, and business strategists a rigorous, repeatable framework for evaluating the financial feasibility of a hardware or physical product launch before committing to development investment. Specifically, the model is built to:
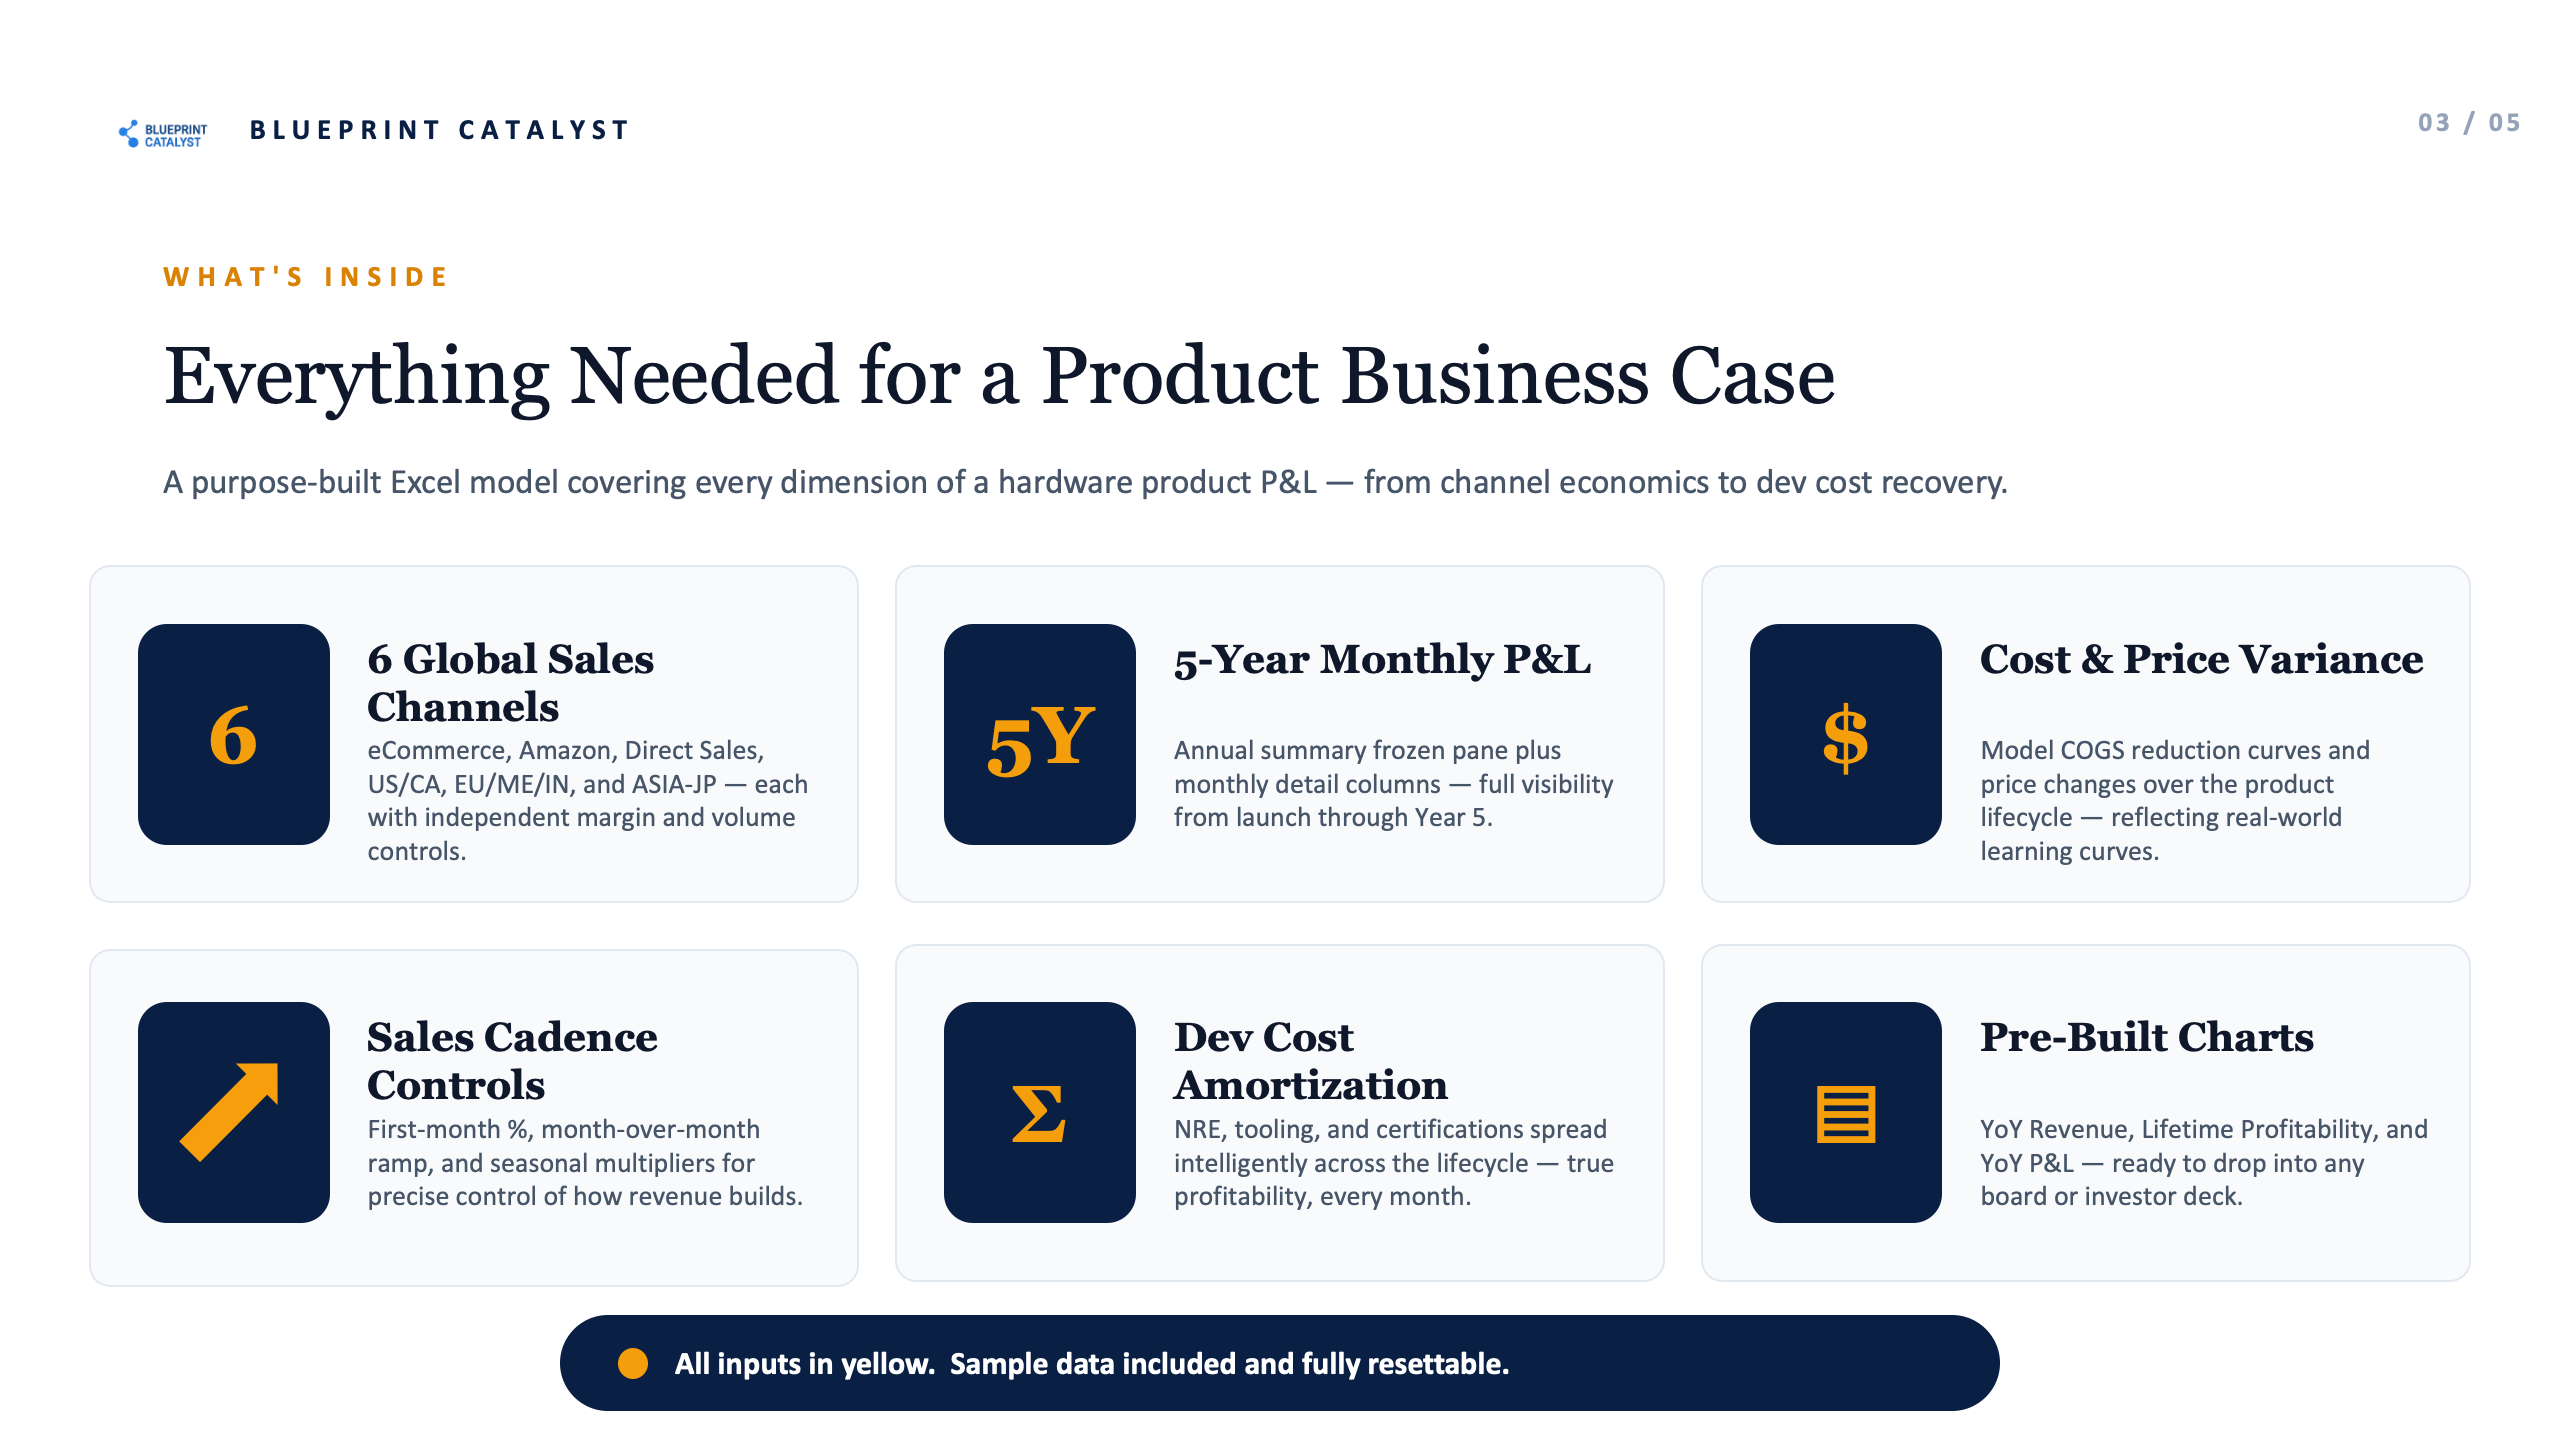
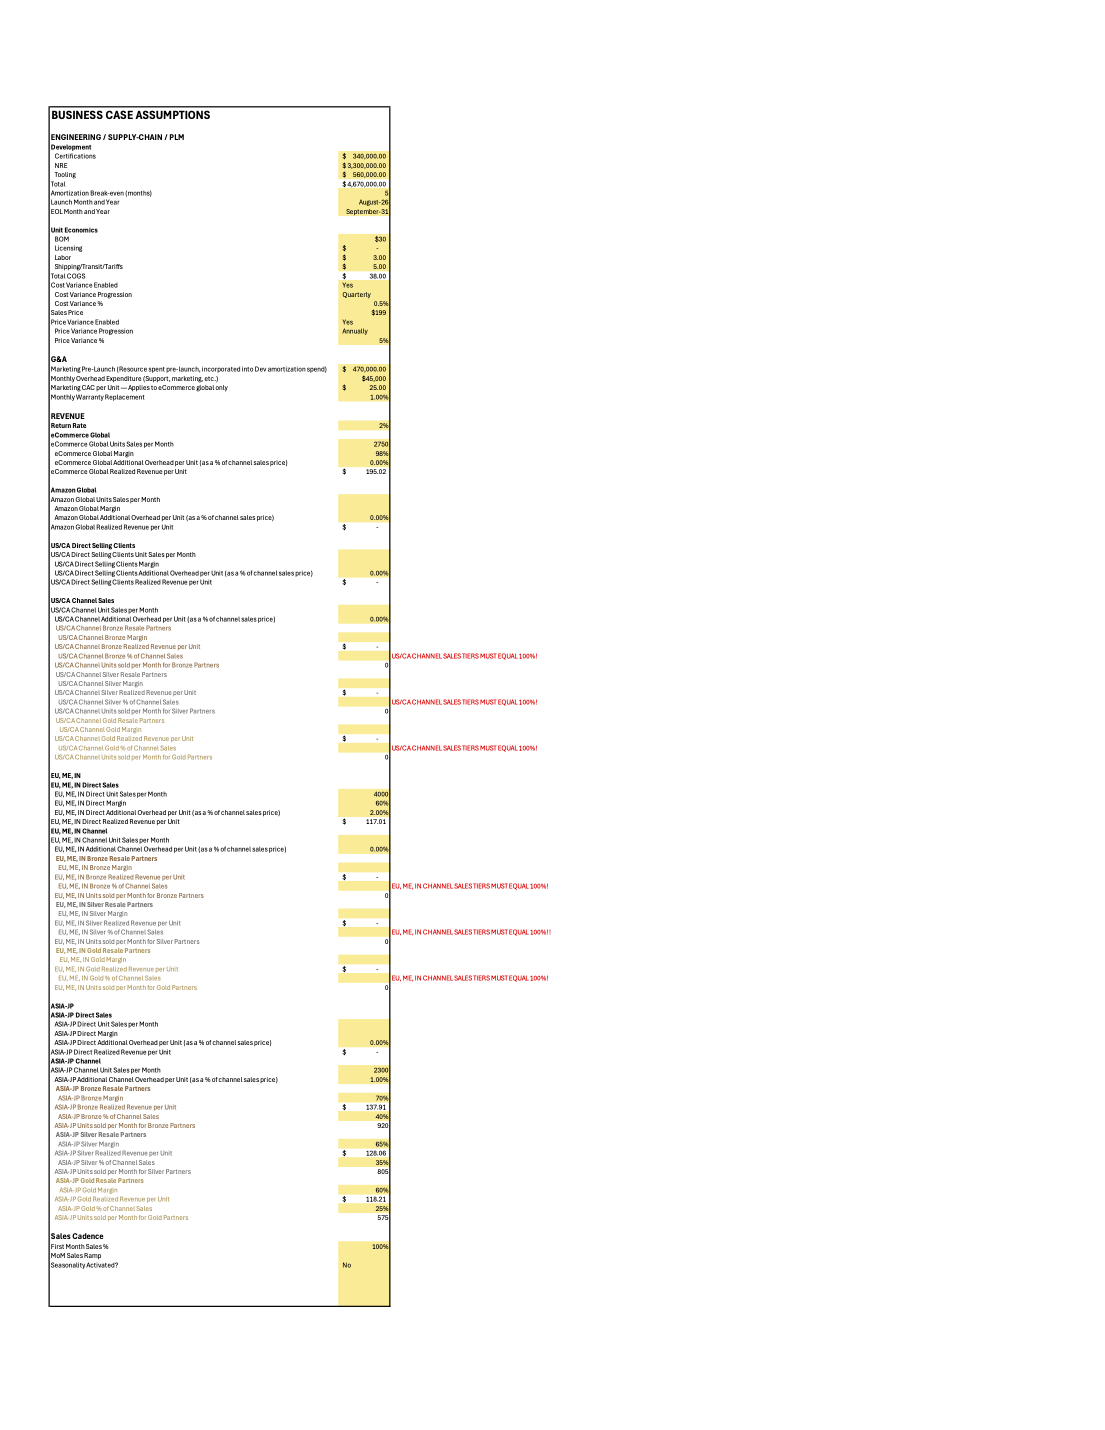
o Quantify the contribution margin of a new product across up to 6 independent global sales channels simultaneously, each with its own pricing, margin, and volume assumptions
o Model the full product lifecycle from pre-launch development spend through end-of-life, including NRE, tooling, certifications, and marketing pre-launch costs amortized across a user-defined period
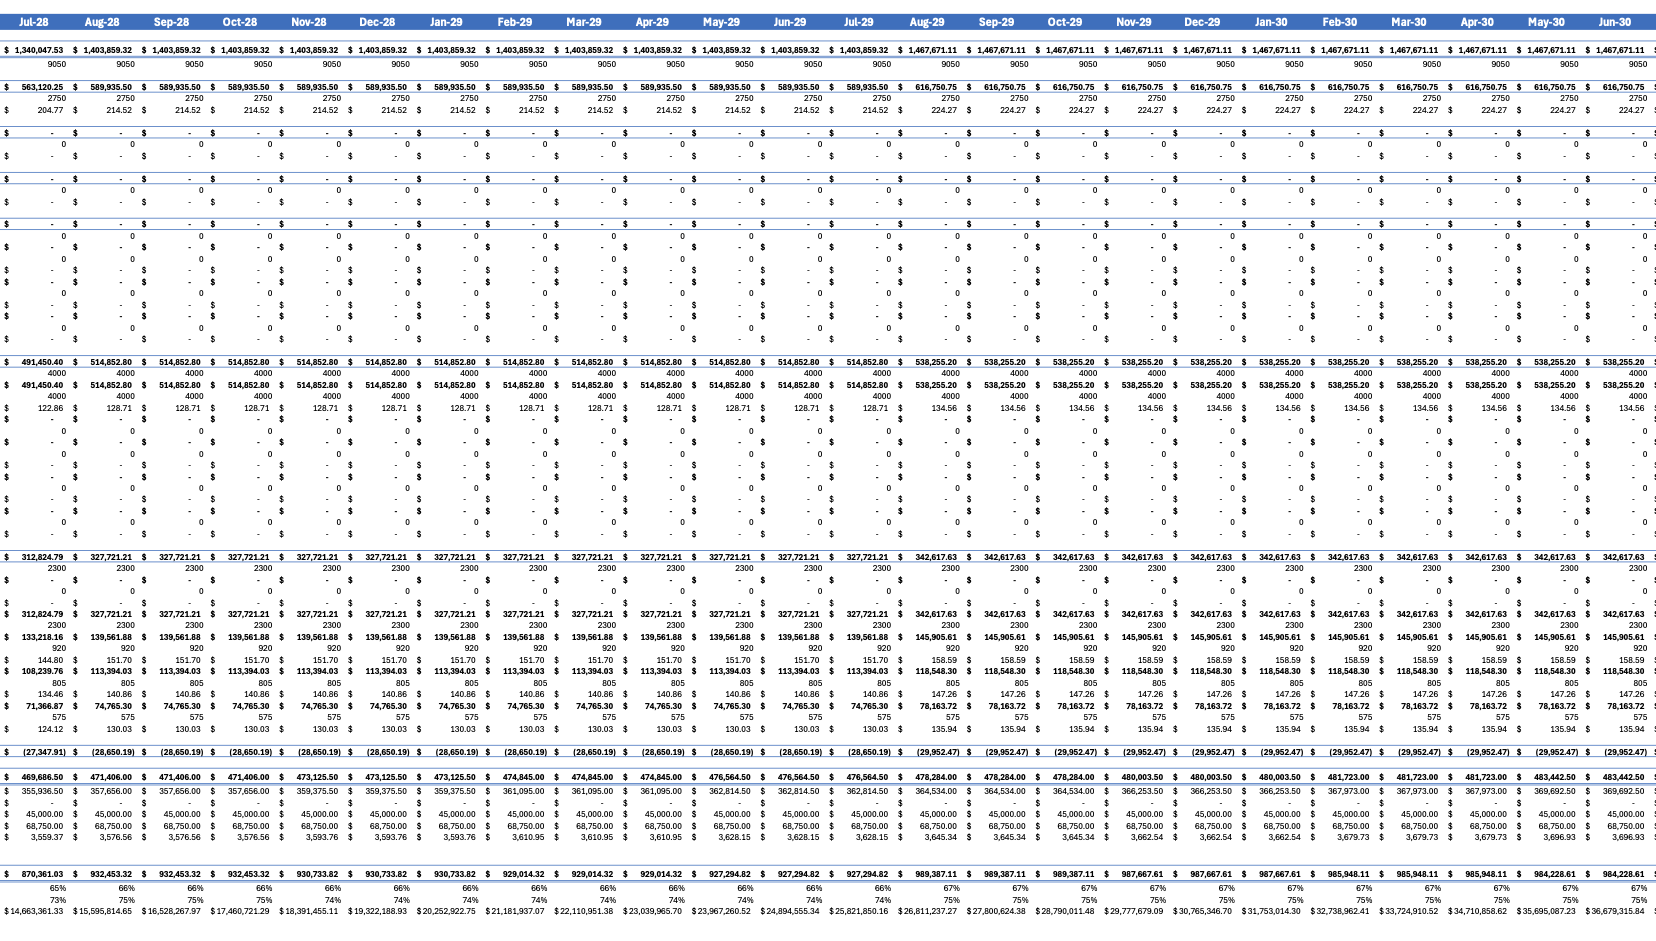
Surface the break-even month and running profitability curve so product teams can align go/no-go decisions with financial reality before NPI (new product introduction) investment is locked
o Enable rapid scenario sensitivity analysis — change a single assumption (COGS, sales price, channel volume, launch date) and immediately see the downstream impact on 60 months of P&L
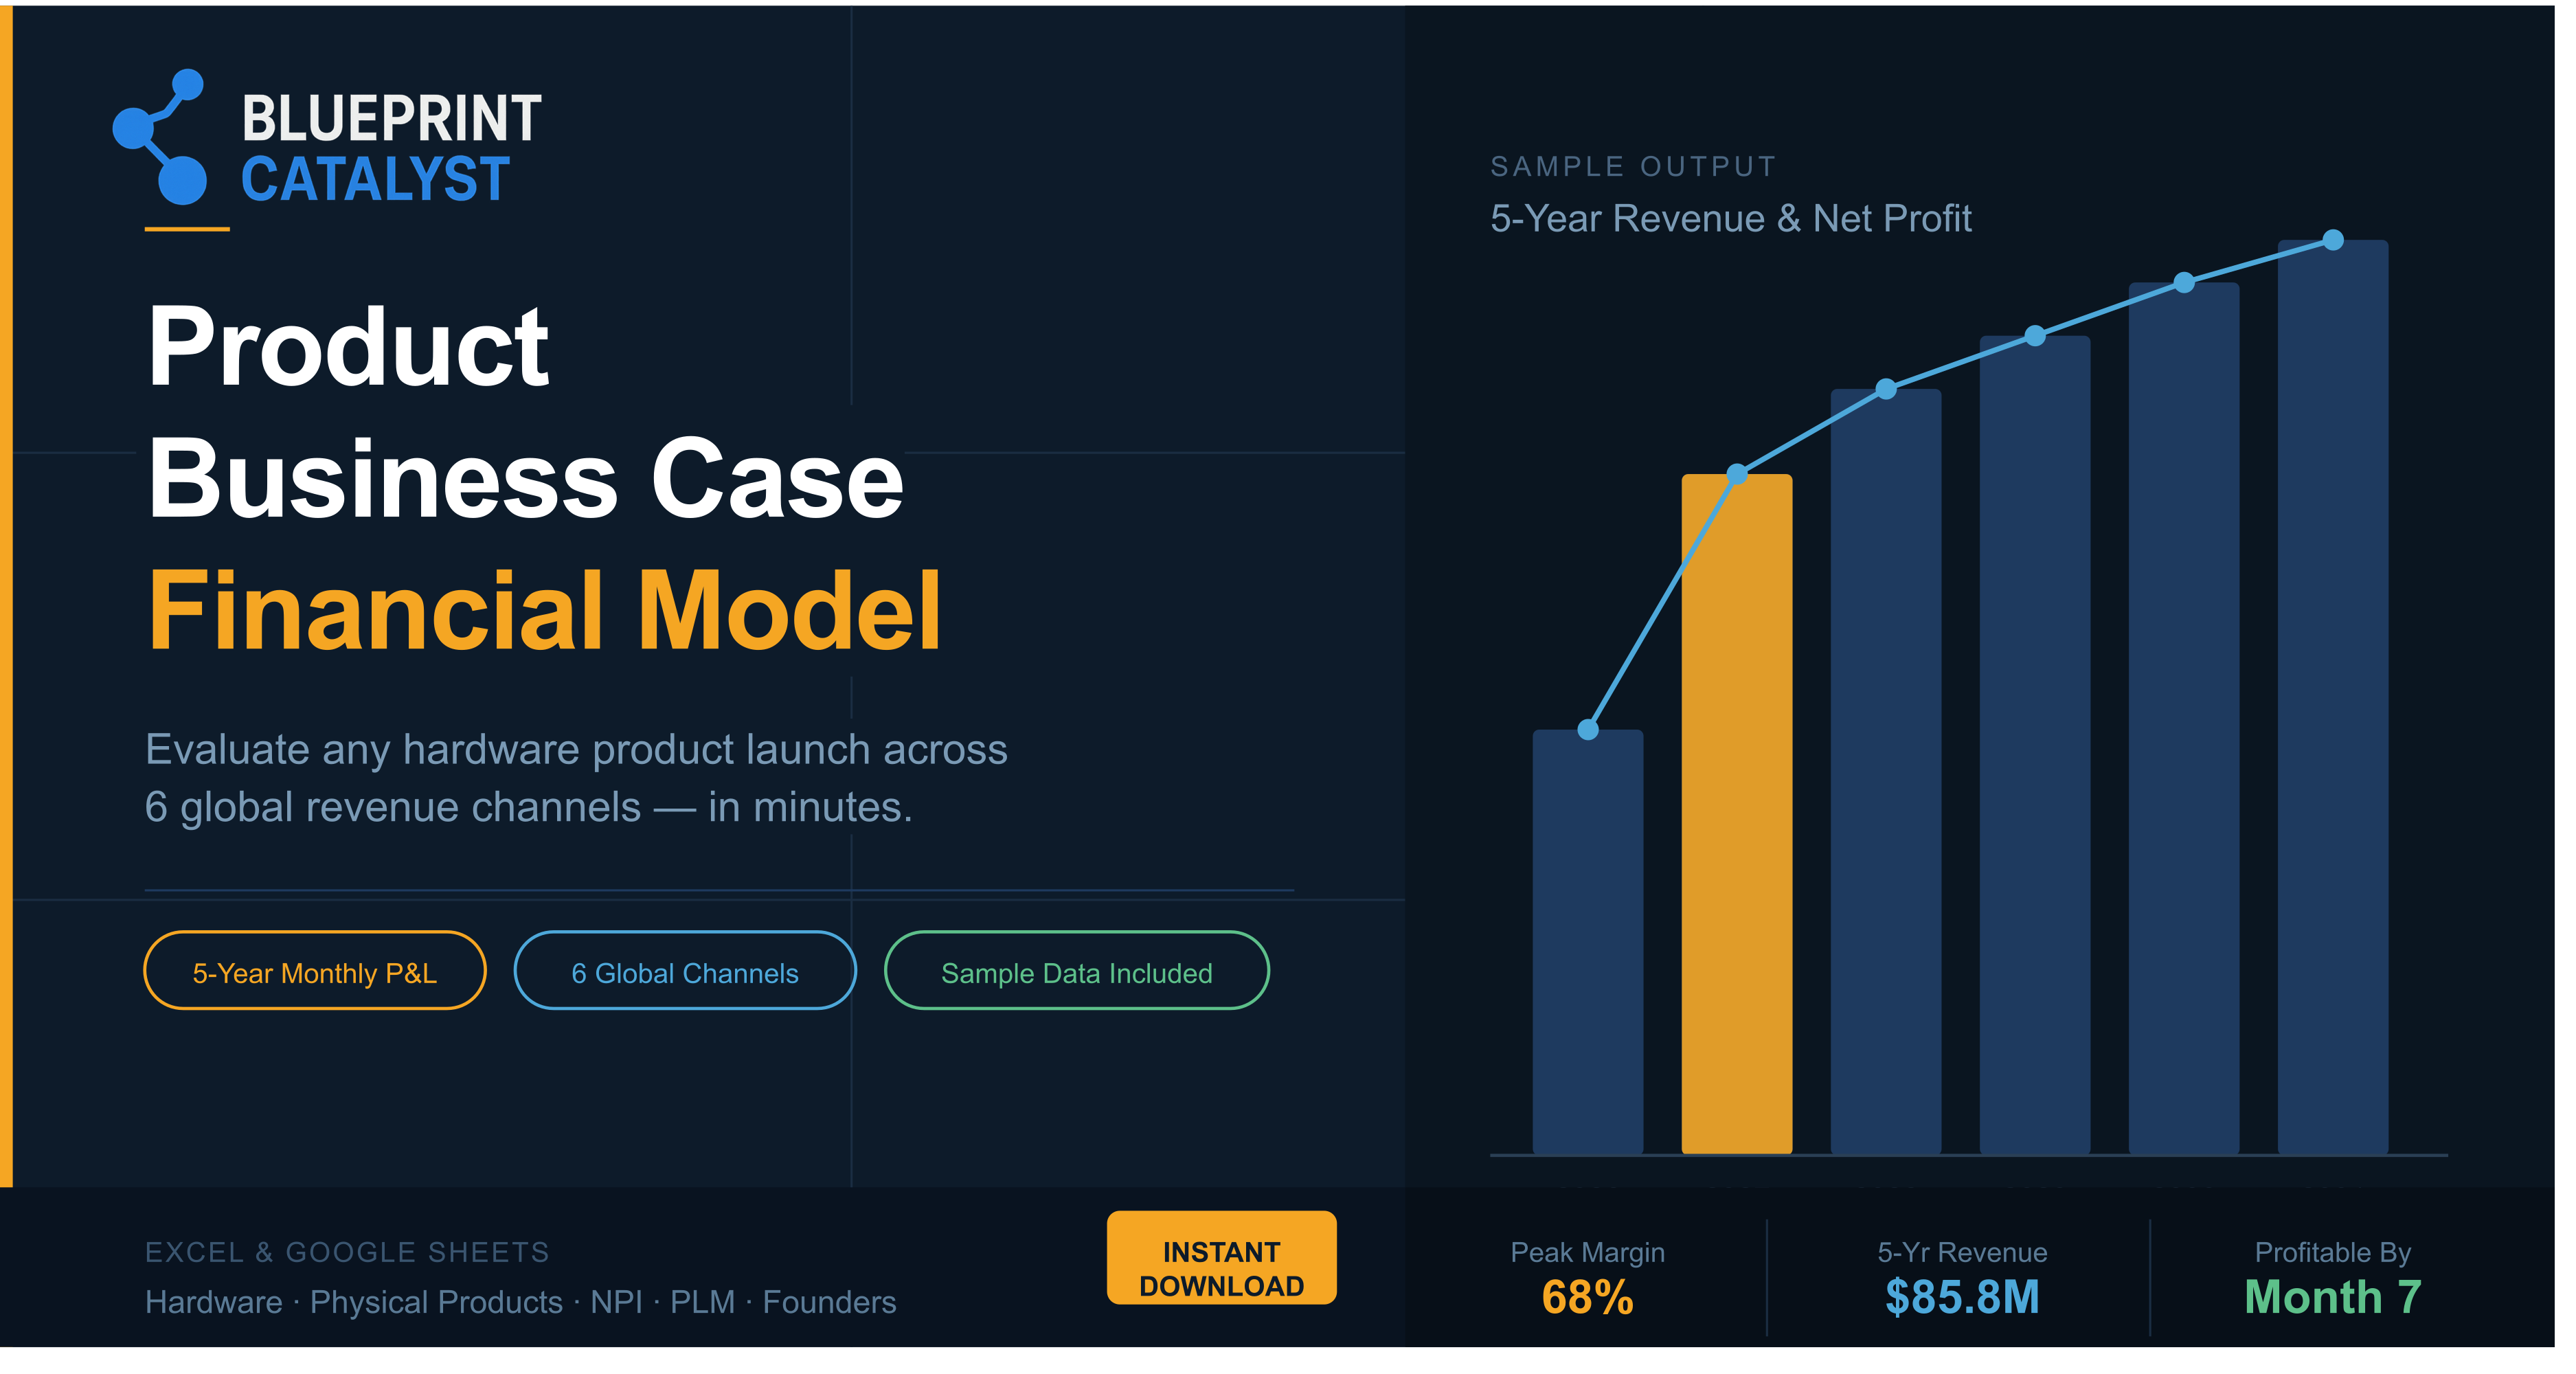
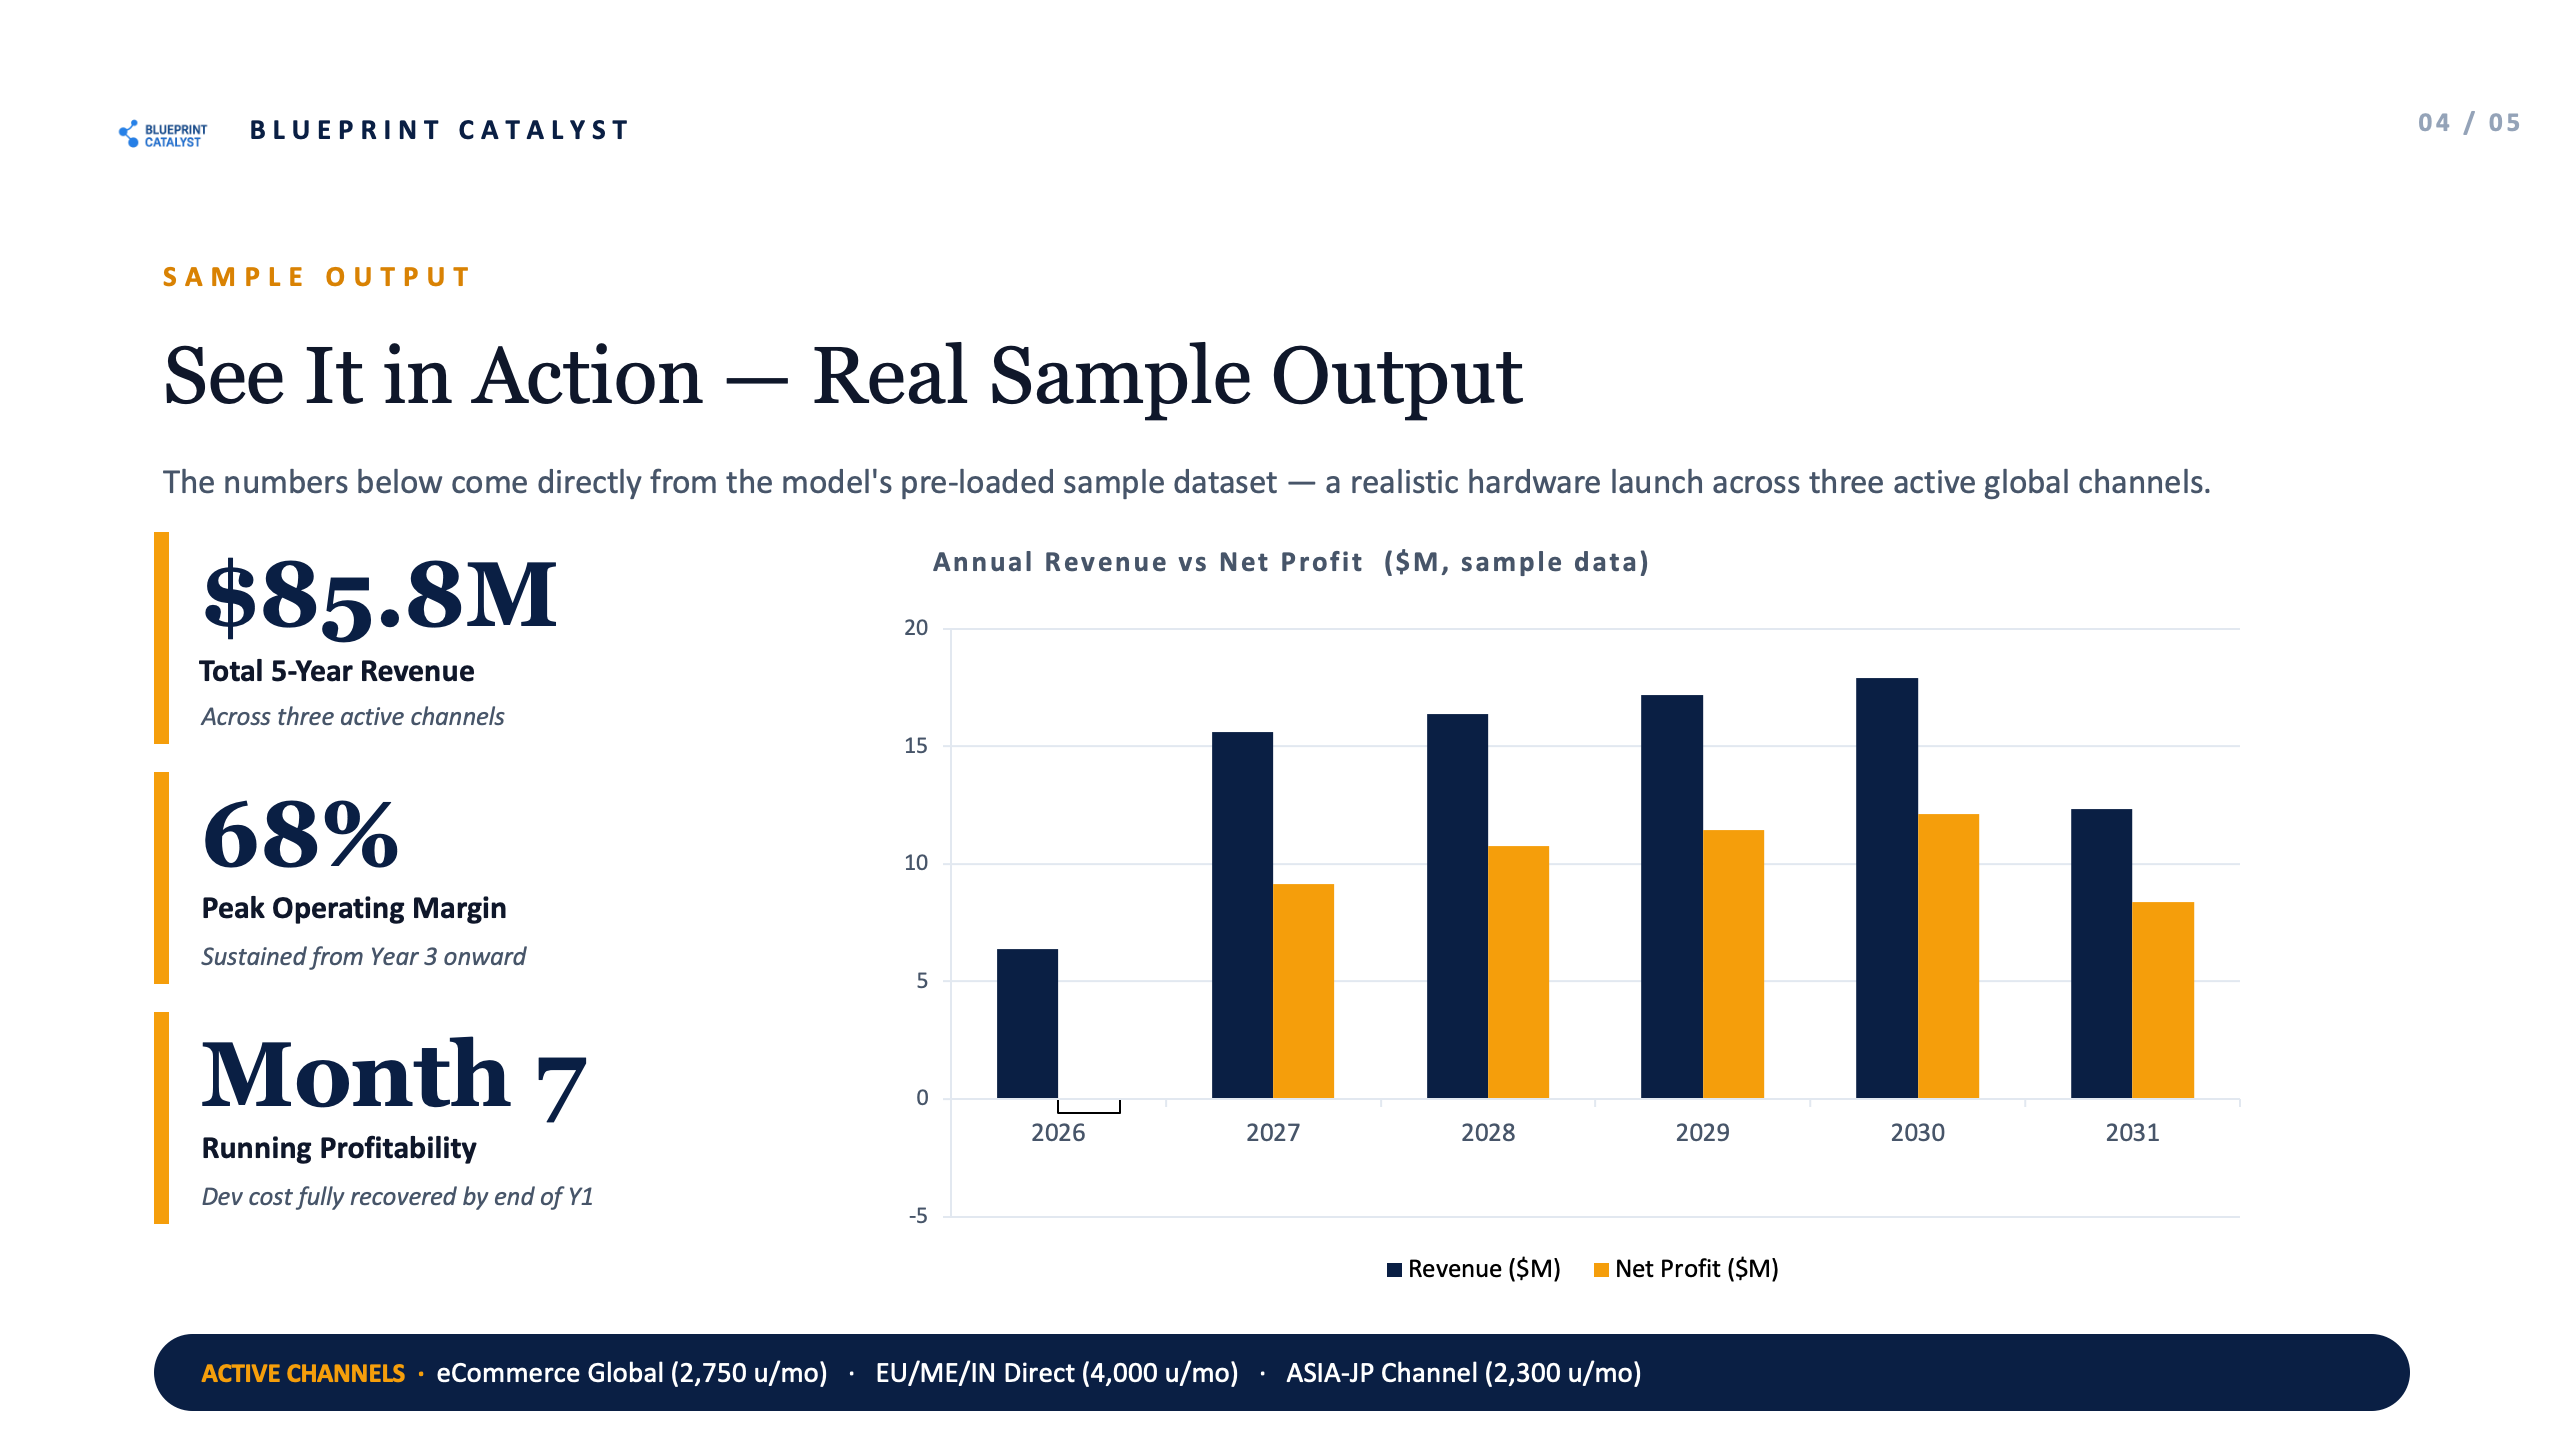
Produce board- and investor-ready outputs directly from the model, including three pre-built charts covering YoY revenue by channel, lifetime running profitability, and annual P&L performance with gross and net margin overlays.
o Standardize the business case process across product teams, so every new product evaluation uses the same financial architecture and assumption structure, enabling apples-to-apples comparison across the portfolio
This model is purpose-built for a specific set of use cases and performs best under the following conditions:
o Hardware, electronics, physical consumer products, or hardware-as-a-service with a defined bill of materials, upfront engineering development costs, and a multi-channel global distribution strategy
o New Product Introduction (NPI) or New Product Development (NPD) processes, where a go/no-go financial evaluation is required before committing to tooling, certification, or manufacturing investment
o Multi-channel distribution models involving any combination of direct eCommerce, Amazon, direct B2B sales, and tiered reseller programs (Bronze, Silver, Gold) across US/CA, EU/ME/IN, and ASIA-JP regions
o Products with defined lifecycles — a clear launch month, an expected end-of-life date, and a product lifespan of up to 5 years post-launch
o Scenarios where COGS or pricing is expected to change over time — learning curve cost reductions, annual price increases, or promotional price adjustments across the lifecycle
o Fundraising and investor preparation — founders who need to demonstrate product-level unit economics and channel P&L to seed or Series A investors alongside a broader company financial model
o Organizations evaluating multiple product candidates simultaneously, where a standardized template allows consistent financial comparison across the portfolio
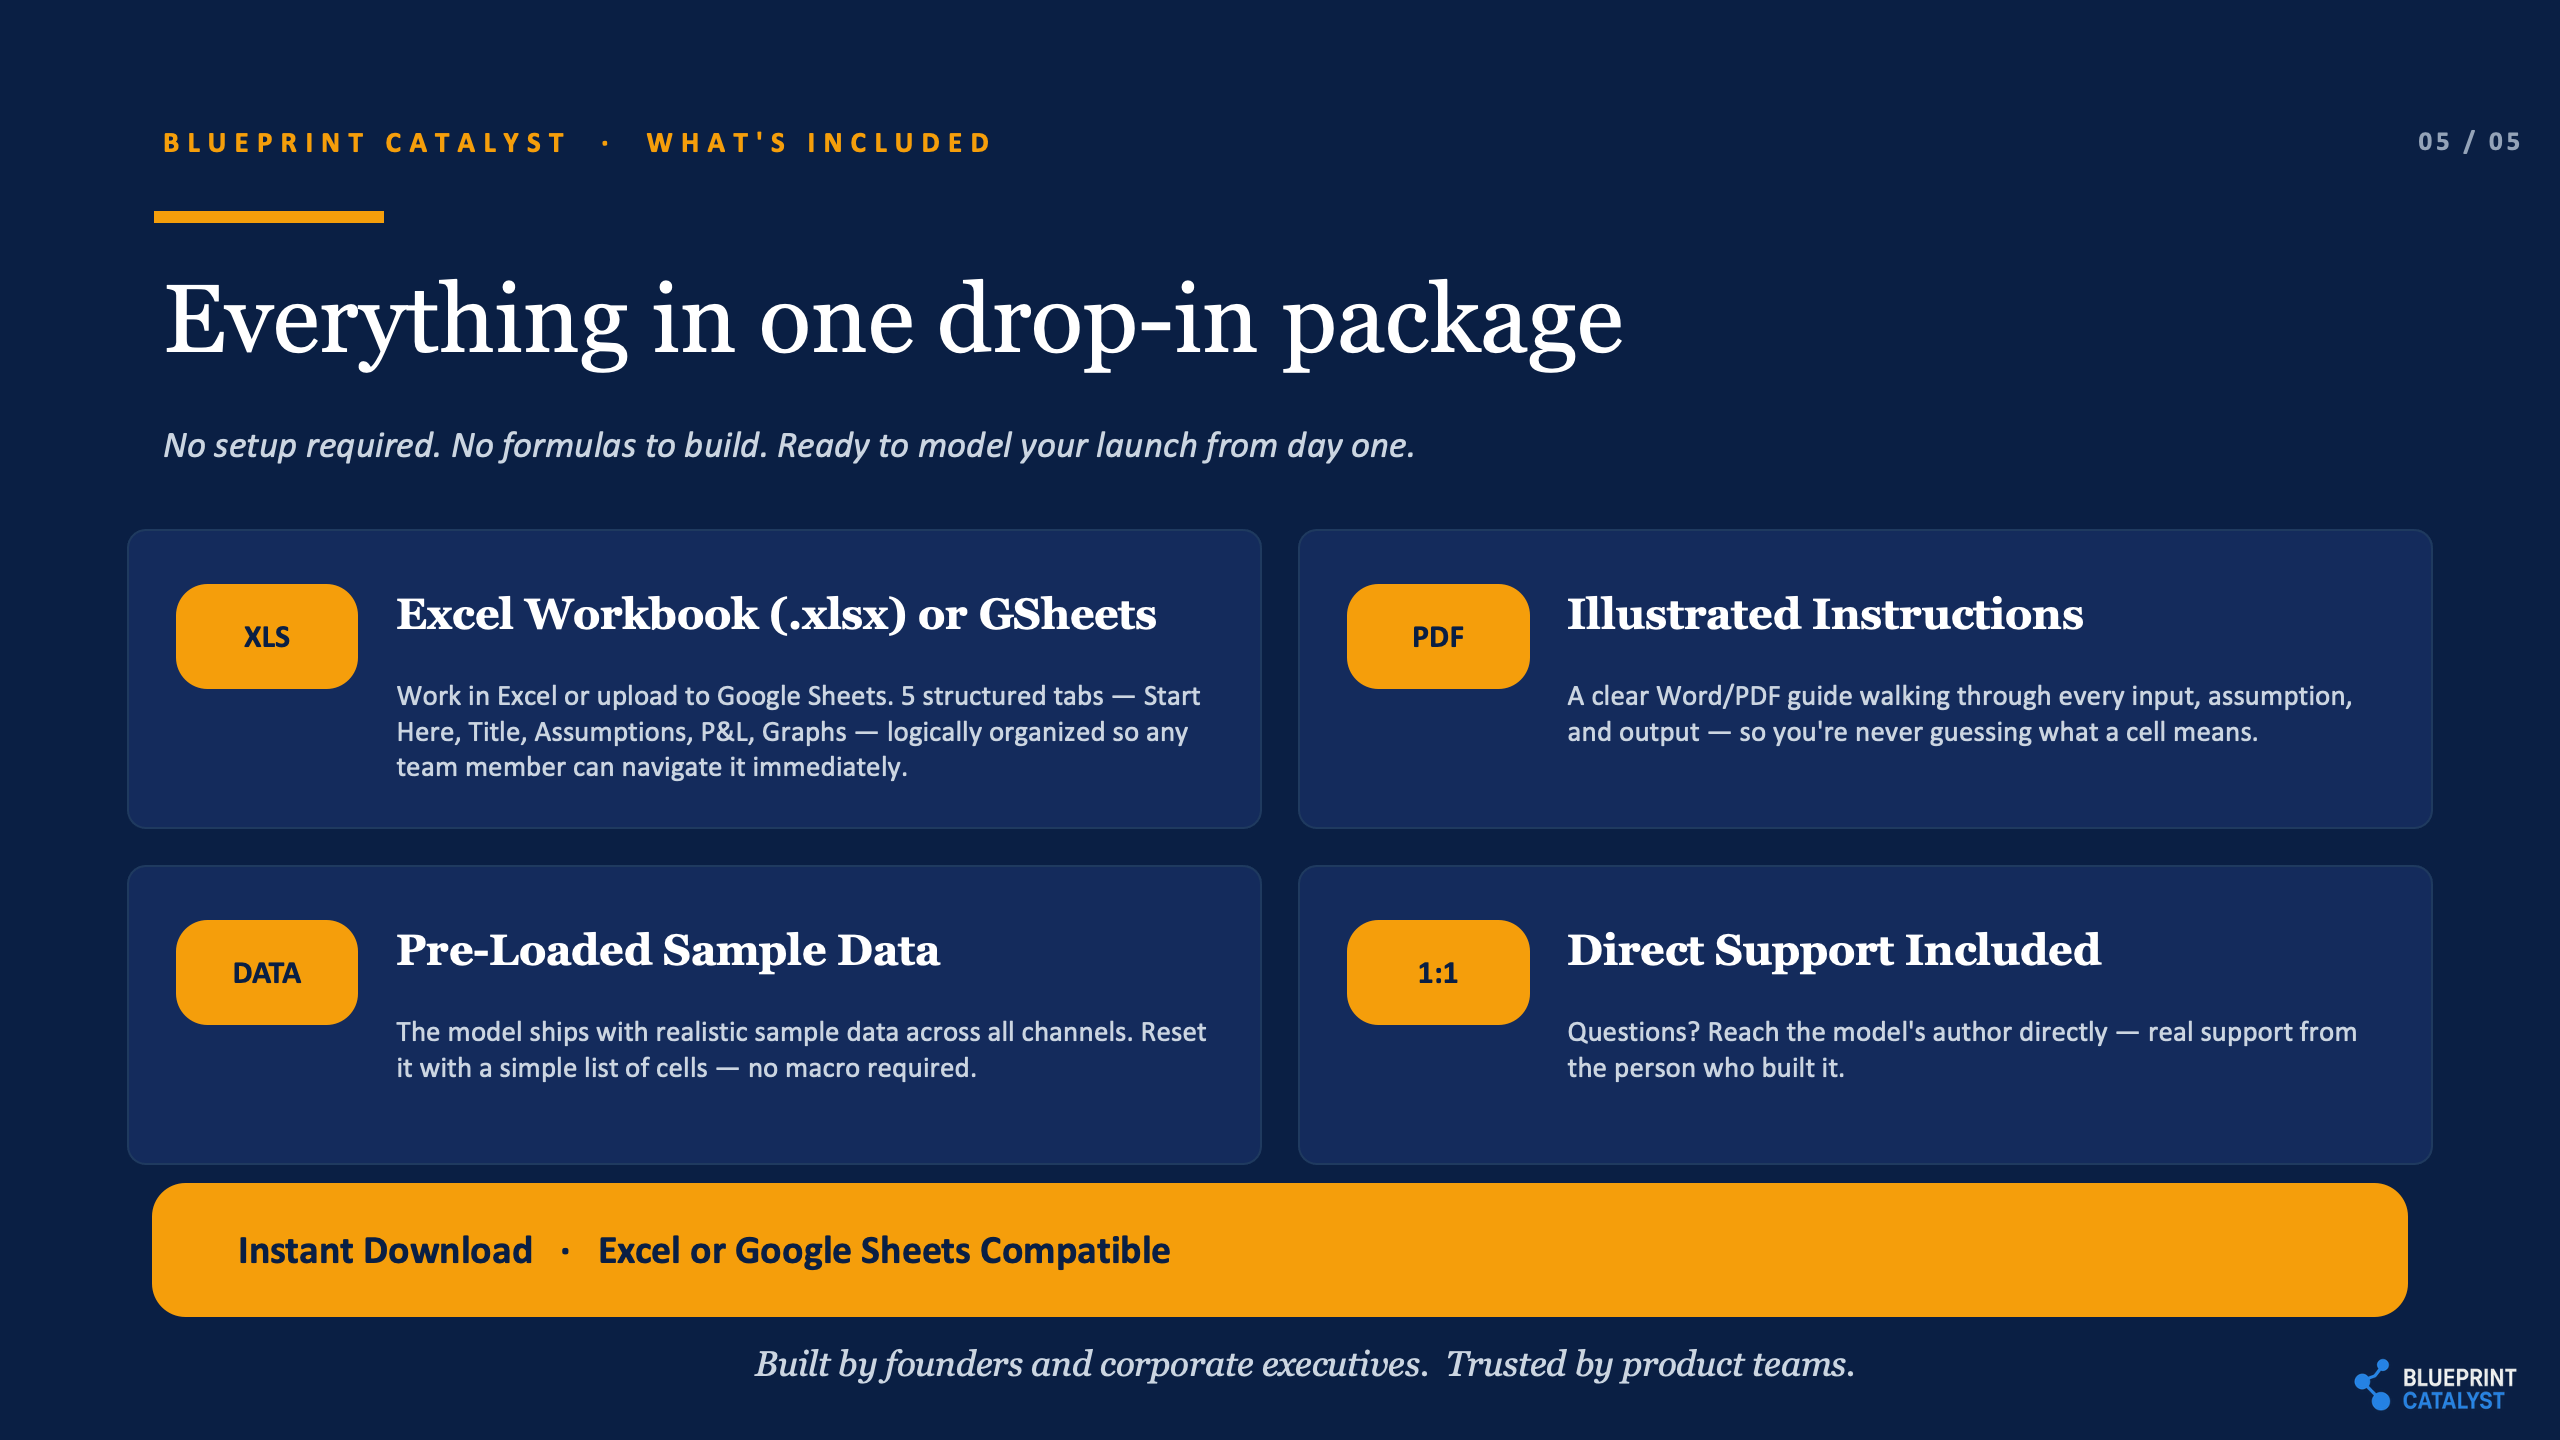
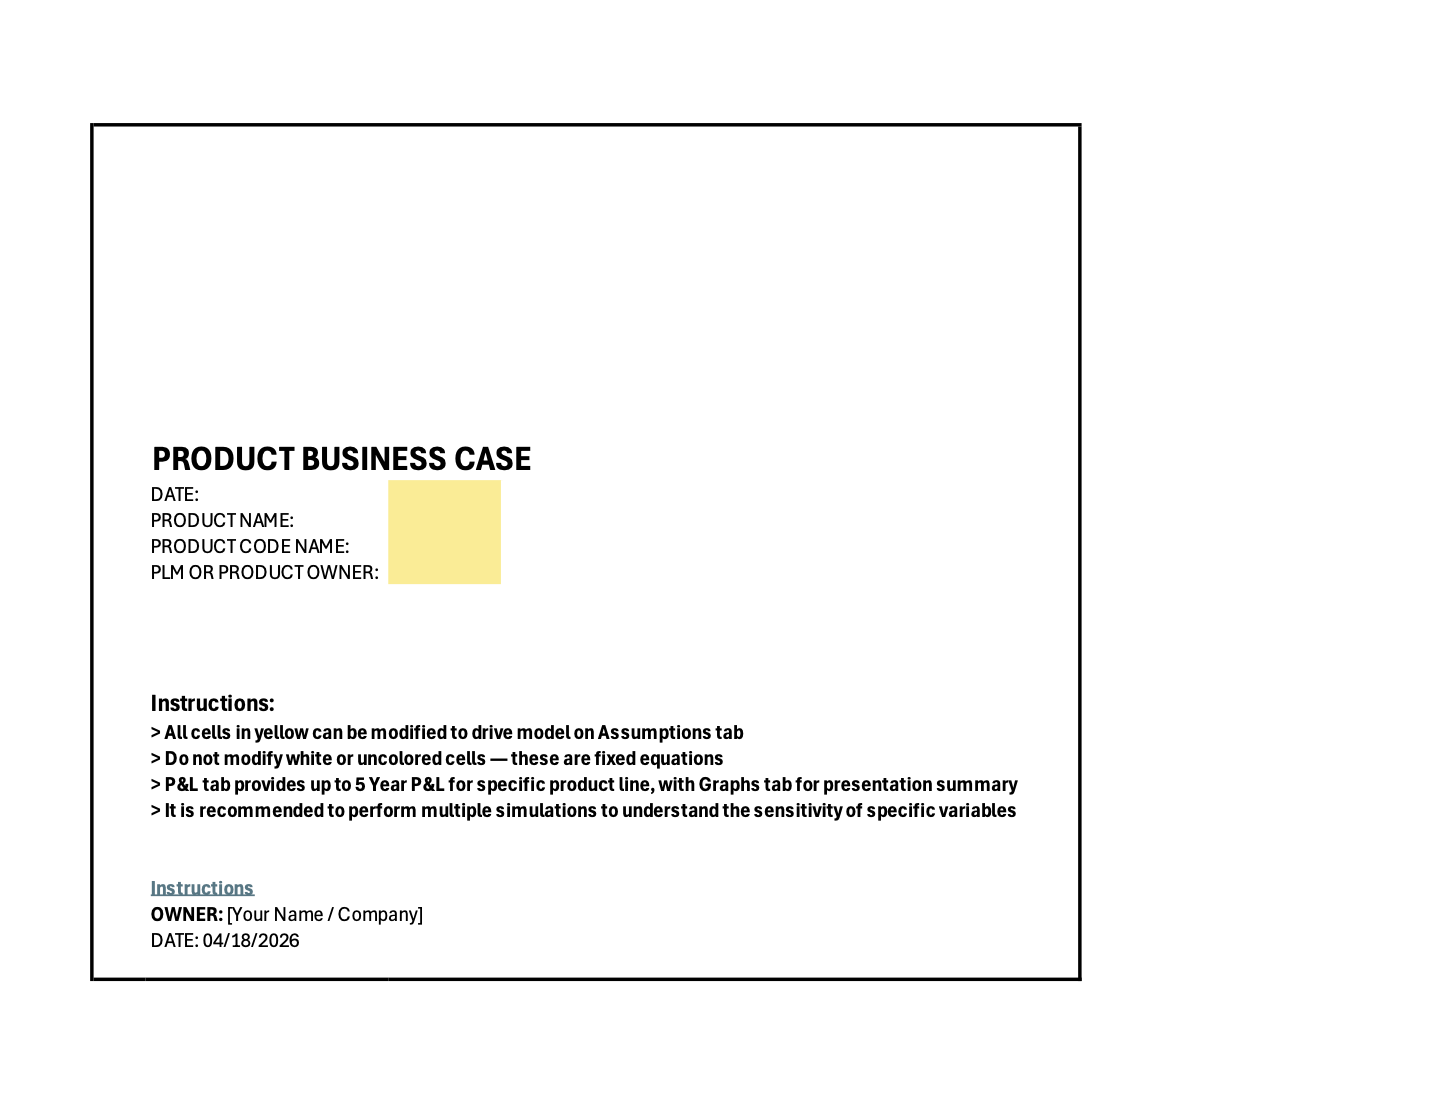
o Teams with basic-to-intermediate Excel proficiency — the model requires no macro knowledge, no financial modeling background, and no formula editing; all inputs are clearly marked in yellow
This model has deliberate scope boundaries. It is not the right tool under the following conditions:
o Pure SaaS or digital products with no physical bill of materials, manufacturing costs, or channel distribution complexity — the COGS structure, amortization logic, and channel tier architecture are built for physical products and will not map cleanly to software revenue models
o Holistic company-level financial modeling — this is a product-line contribution margin model, not a 3-statement company model. It does not produce a balance sheet, cash flow statement, or consolidated company P&L across multiple product lines
o Inventory and working capital planning — the model does not account for stock-outs, inventory replenishment timelines, or cash flow timing. Revenue and costs are realized within the same fiscal month, which simplifies the model but means it is not a substitute for operational cash flow planning
o Products with lifecycles longer than 5 years — the P&L tab supports a maximum of up to 60 months post-launch. Products with longer commercial windows will need a modified architecture
o Service businesses, consulting practices, or project-based revenue models where revenue is driven by time, contracts, or milestones rather than unit volume and channel economics
o Highly seasonal businesses where quarterly seasonality multipliers are insufficient — the model includes a seasonality toggle with quarterly adjustments, but businesses with complex weekly or event-driven demand patterns will find this too blunt an instrument
o Scenarios requiring supply chain volatility modeling — tariff changes, supplier disruptions, or lead time variability are not dynamically modeled; these must be accounted for through manual assumption adjustments
o Users who need a fully locked, auditor-ready financial model — while input cells are protected, the model is designed to be transparent and accessible, not locked down for formal audit or compliance purposes
