
Originally published: 26/10/2024 21:57
Last version published: 31/10/2024 23:19
Publication number: ELQ-54954-2
View all versions & Certificate
Last version published: 31/10/2024 23:19
Publication number: ELQ-54954-2
View all versions & Certificate

Sales Analysis Power Bi Dashboard
Sales Performance Power BI Dashboard
Description
Unlock insights and drive growth with the ultimate Sales Analysis Dashboard, designed to visualize complex data simply and effectively. Perfect for sales teams, managers, and data analysts, this template empowers users to make data-driven decisions quickly and confidently.
Key Features:
This dashboard template is ideal for Sales Managers, Marketing Teams, Business Analysts, and Executives who want a clean, powerful tool to monitor, analyze, and act on sales data. With intuitive visuals and in-depth insights, this dashboard template is designed to be user-friendly yet powerful enough to handle complex sales data.
Unlock insights and drive growth with the ultimate Sales Analysis Dashboard, designed to visualize complex data simply and effectively. Perfect for sales teams, managers, and data analysts, this template empowers users to make data-driven decisions quickly and confidently.
Key Features:
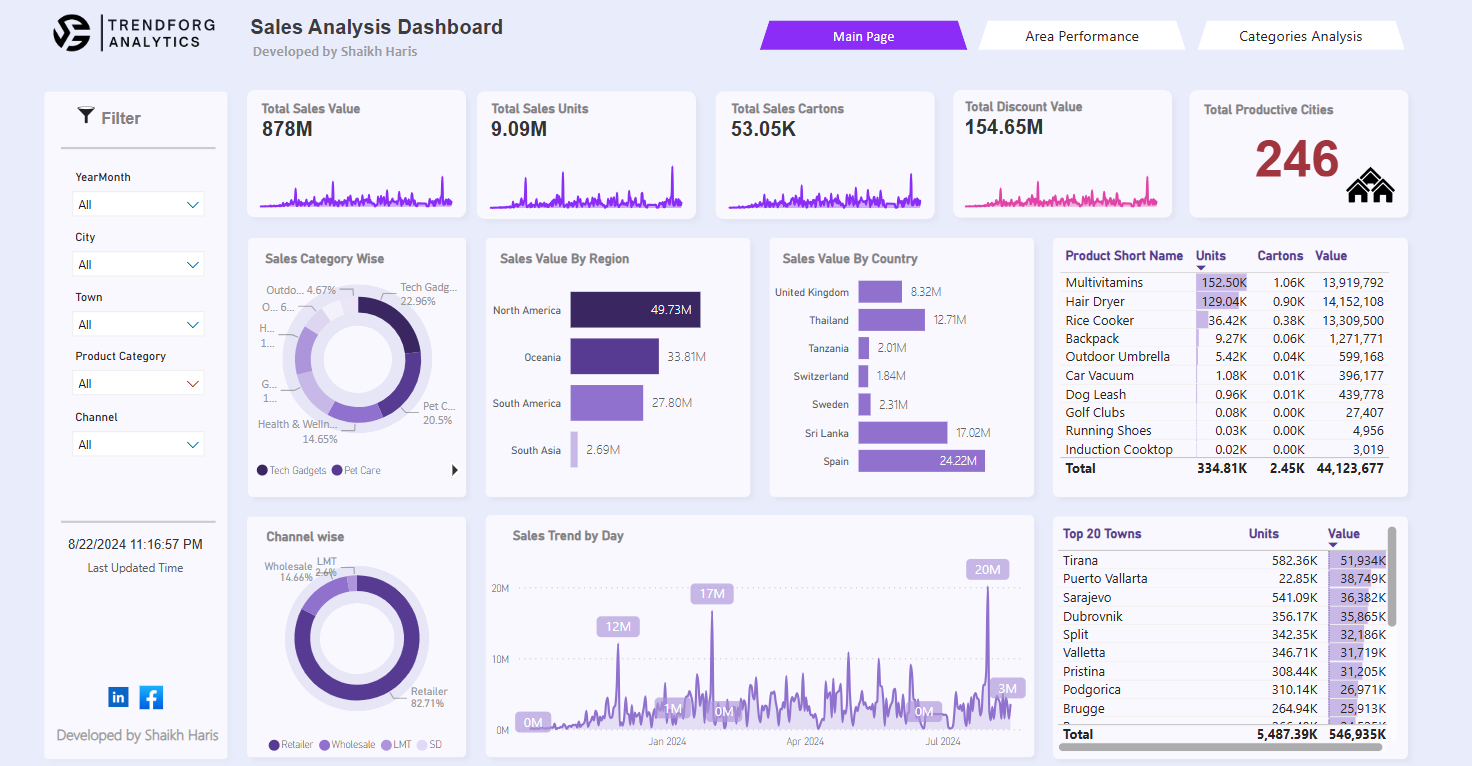
- Overview of Essential Metrics: Get an instant snapshot of total sales value, units sold, carton counts, discounts, and the number of productive cities. This top-level overview lets you stay on top of critical KPIs at a glance.
- Customizable Filters: Refine your analysis by filtering data by YearMonth, City, Town, Product Category, and Channel. Drill down to find specific insights relevant to your target locations, products, or distribution channels, making it easy to tailor reports to different business needs.
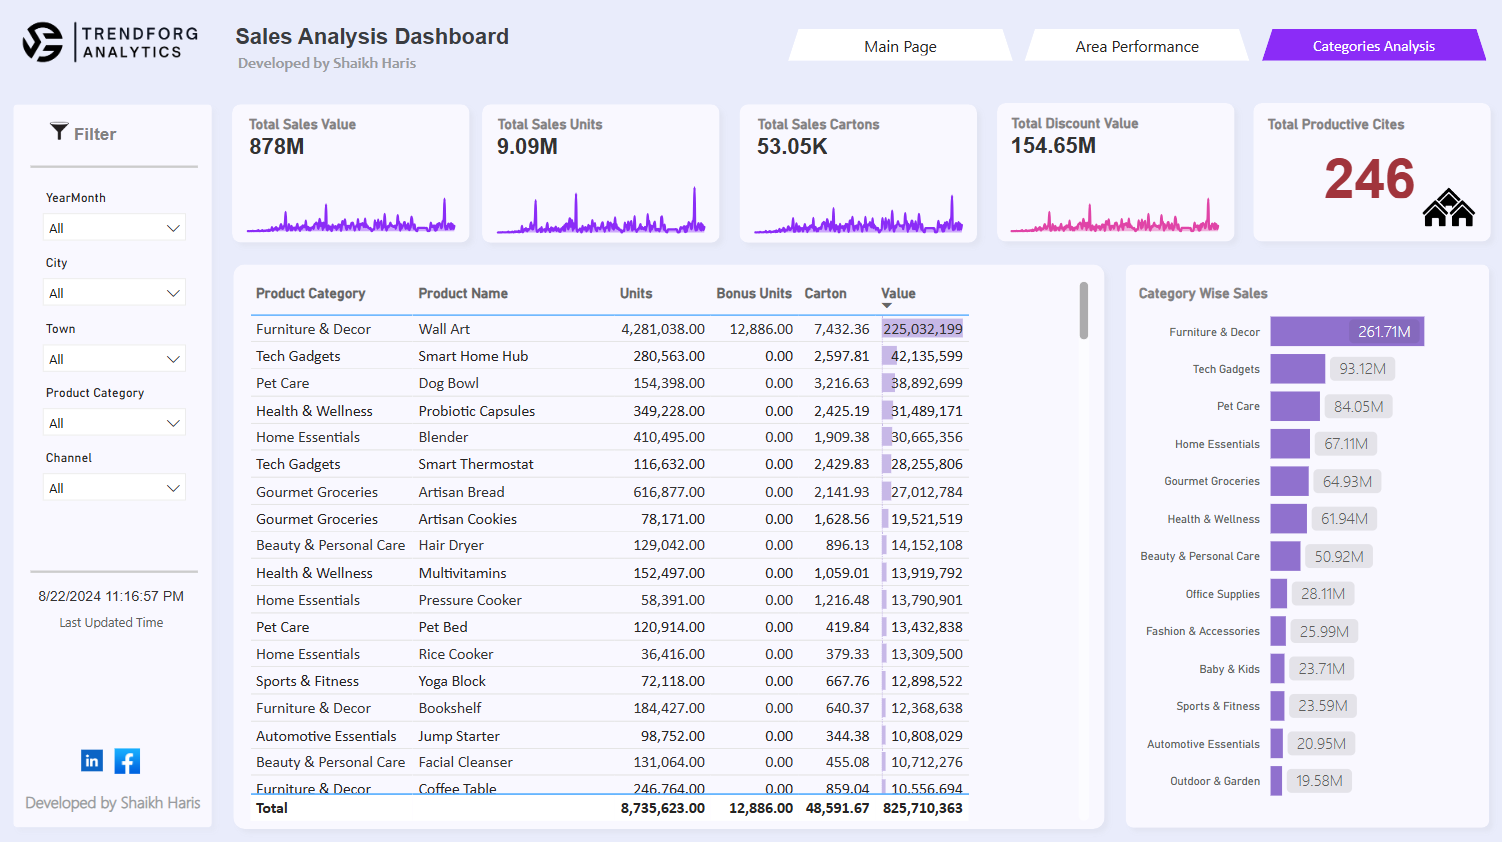
- Sales Category Breakdown: A sleek donut chart segments sales by category (e.g., Technology, Health, Outdoor), allowing you to see which categories are driving revenue. Ideal for businesses wanting to understand category performance and optimize their product mix.
- Regional and Country Sales Analysis: Visualize sales performance across global regions and countries with interactive bar charts. Understand your strongest regions and identify growth opportunities in emerging markets, making this dashboard an excellent tool for international strategy planning.
- Top Products Performance: A detailed list highlights your top-selling products, helping you monitor popular items and adjust inventory or marketing strategies accordingly. Stay informed about your highest-demand products without wading through overwhelming data.
- Channel-wise Sales Insights: Analyze sales by channel (Retail, Wholesale, LMT) to gauge performance across distribution networks. This helps businesses allocate resources effectively and enhance channel-specific strategies.
- Daily Sales Trends: A trend line chart shows fluctuations in daily sales, with peaks and troughs that can reveal seasonal or promotional impacts. Perfect for identifying patterns over time and planning for peak periods.
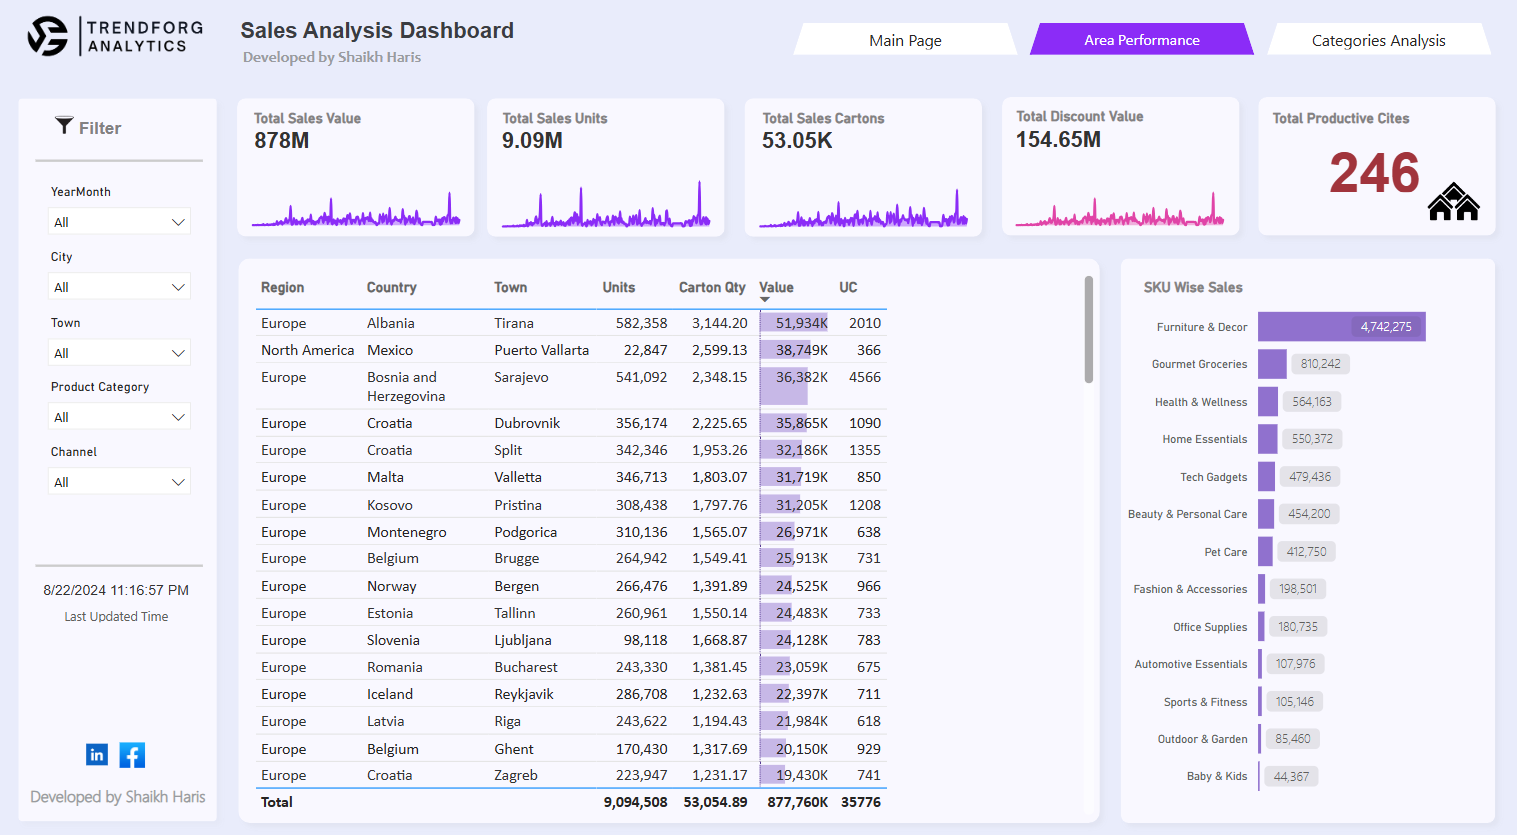
- Area Performance Drilldown: A comprehensive table breaks down sales by Region, Country, and Town, with columns for Units, Carton Quantity, Value, and other metrics, giving granular insights for strategic area-based targeting.
- SKU-wise Sales Ranking: This ranking visualization shows SKU performance, spotlighting the most valuable product categories. A must-have for businesses looking to fine-tune inventory and boost top-selling categories.
This dashboard template is ideal for Sales Managers, Marketing Teams, Business Analysts, and Executives who want a clean, powerful tool to monitor, analyze, and act on sales data. With intuitive visuals and in-depth insights, this dashboard template is designed to be user-friendly yet powerful enough to handle complex sales data.
This Best Practice includes
Power BI file PBIX
