







Property Management Company 5-Year Financial Model Excel | Units, Fee Revenue, Cash Flow, Break-Even, Scenarios & Invest

5-year property management company financial model with unit growth, fee revenue, three statements, break-even, scenarios, funding analysis and investor deck.

Description
🏒 PROPERTY MANAGEMENT COMPANY – 5-YEAR THREE-STATEMENT FINANCIAL MODEL


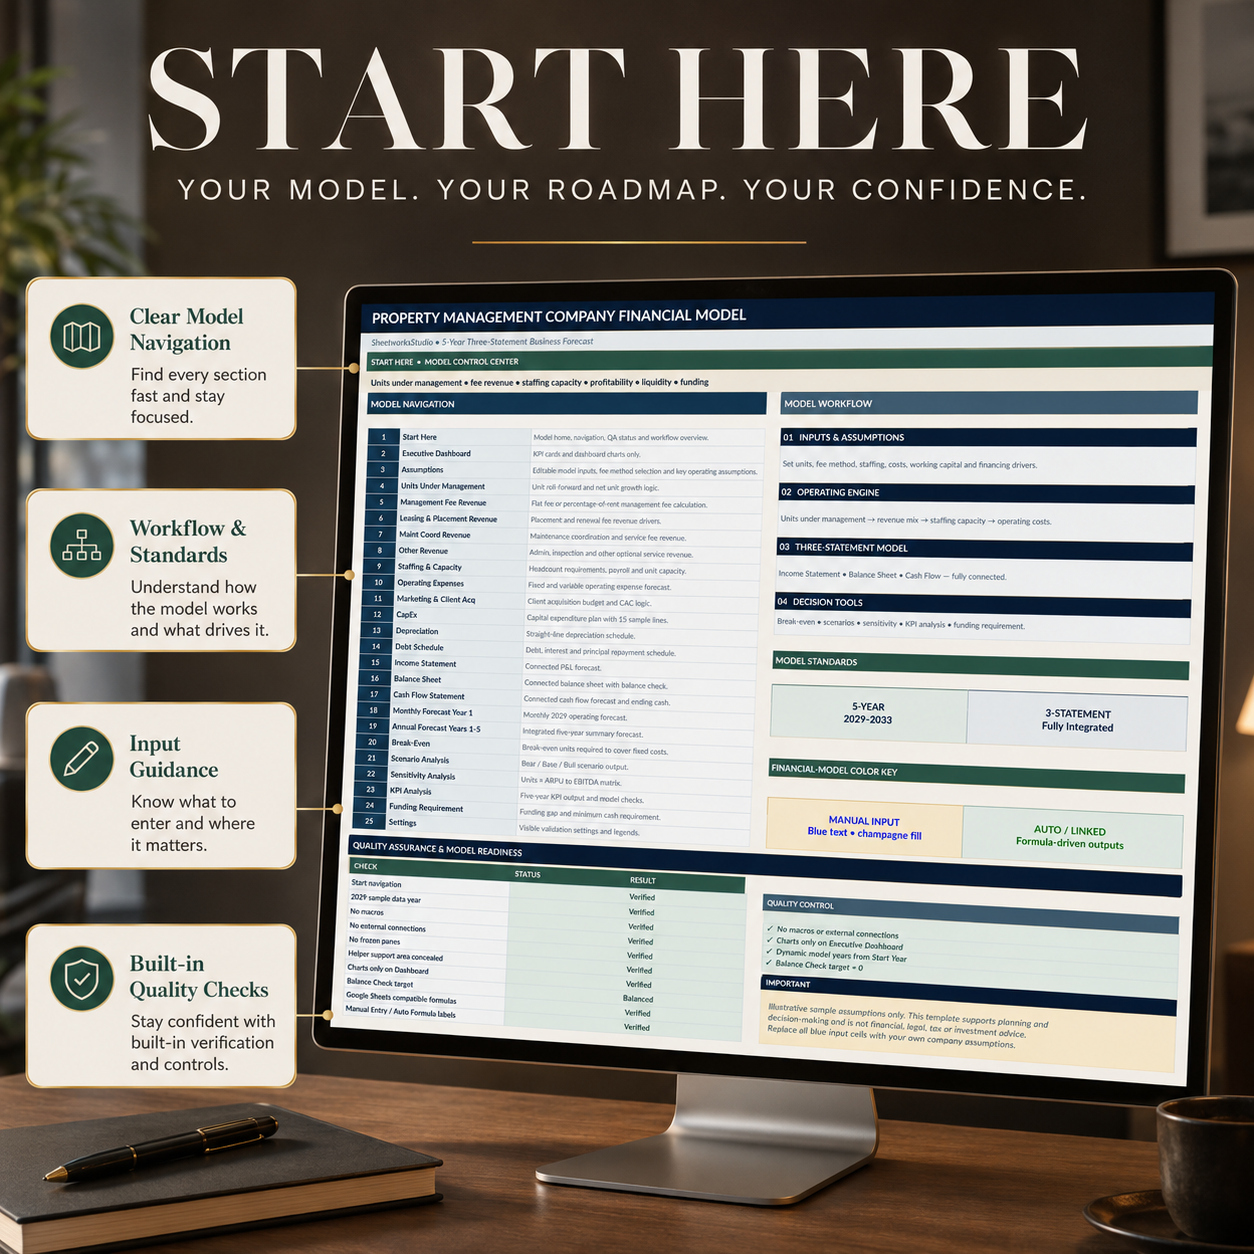
Plan portfolio growth, fee revenue, staffing requirements, operating costs, profitability, liquidity, and funding needs with a professional financial model built specifically for property management operating companies.


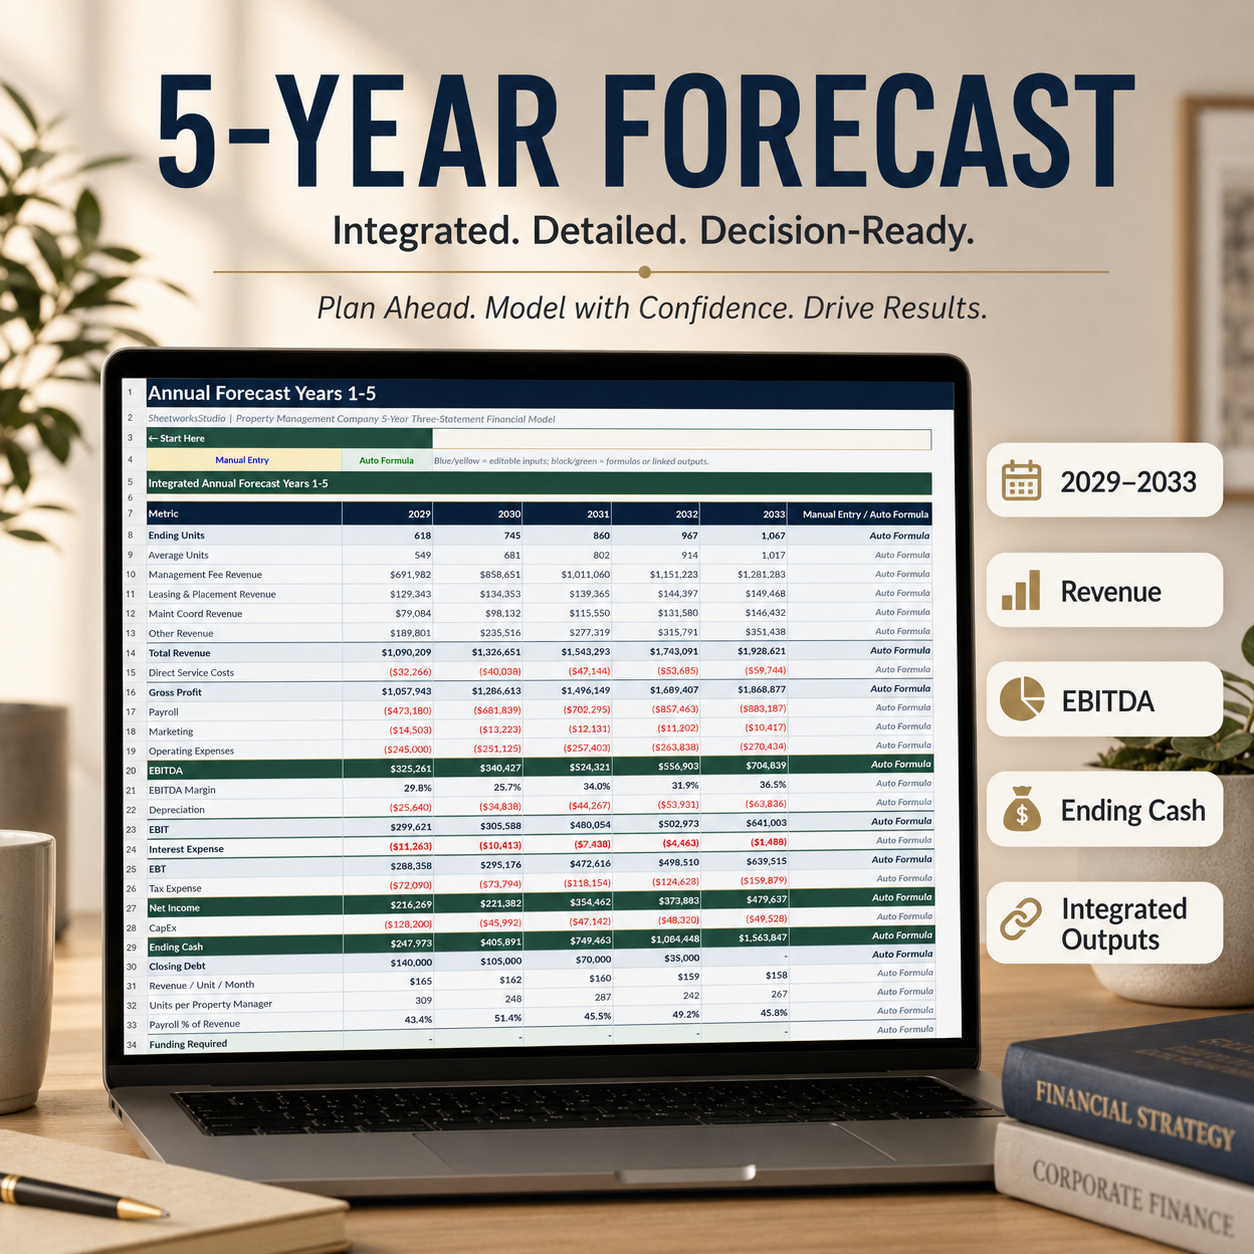
This integrated planning system connects operational assumptions with a complete 5-year financial forecast for 2029–2033, helping owners, managers, finance professionals, and consultants understand how Units Under Management, client growth and attrition, fee structures, staffing capacity, OPEX, CapEx, debt, and financing assumptions may affect future performance.


πŸ“Œ Important: This is a financial model for a property management company operating business. It is not an investment, acquisition, valuation, or rental-property model for individual real estate assets.
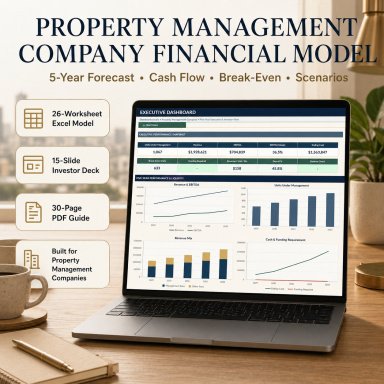
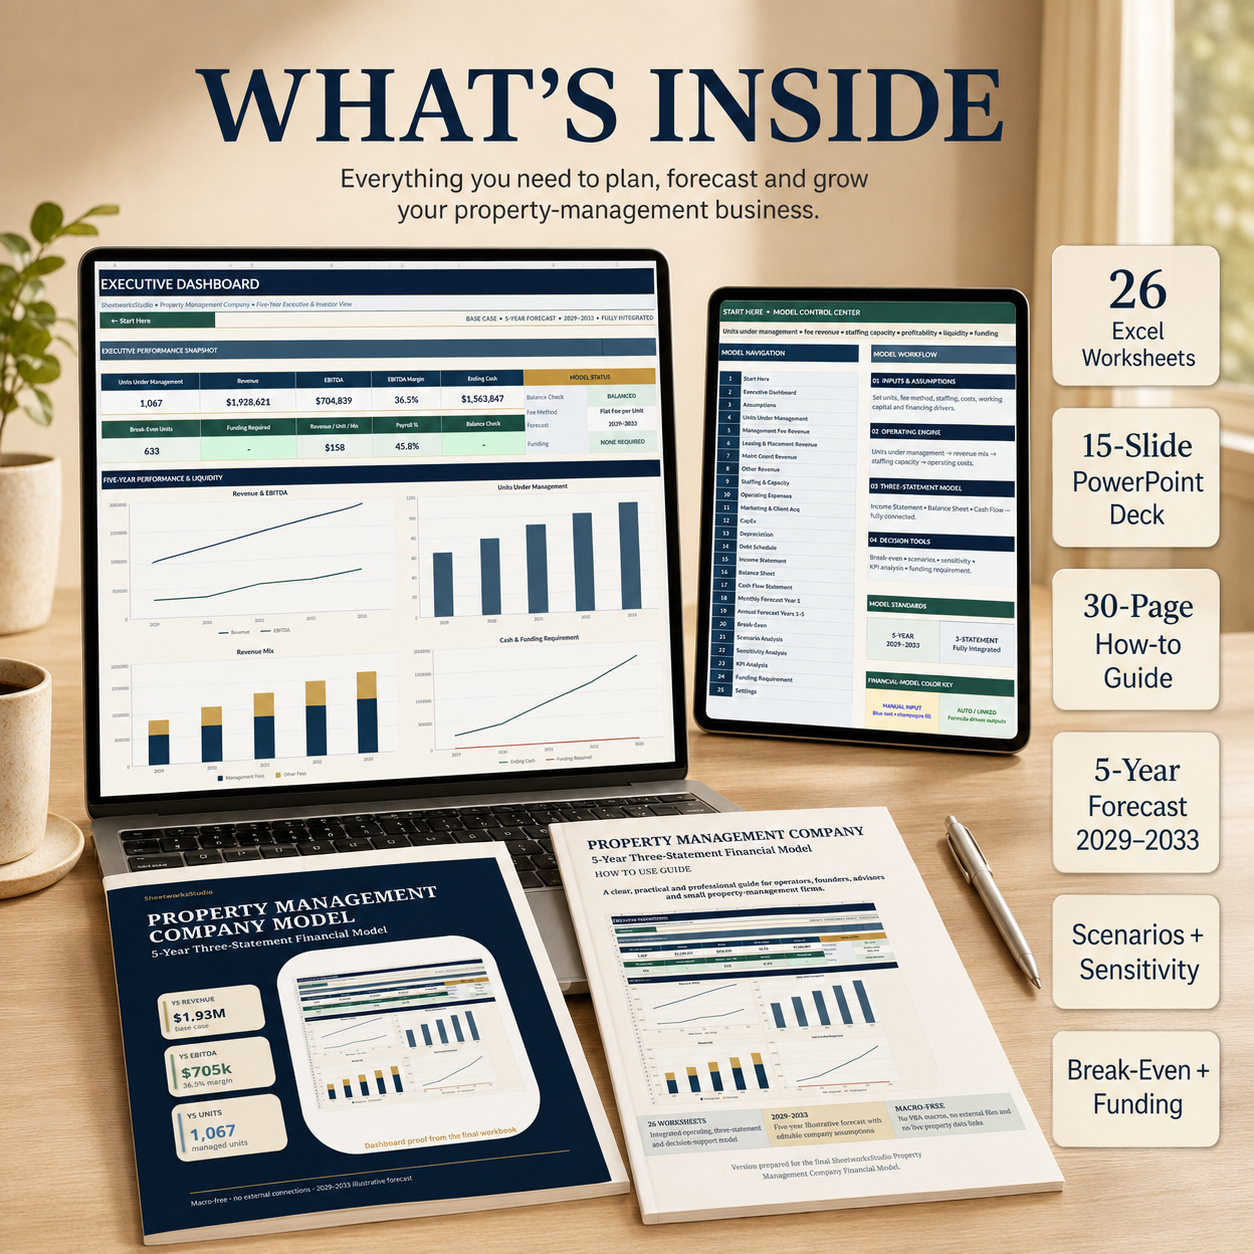
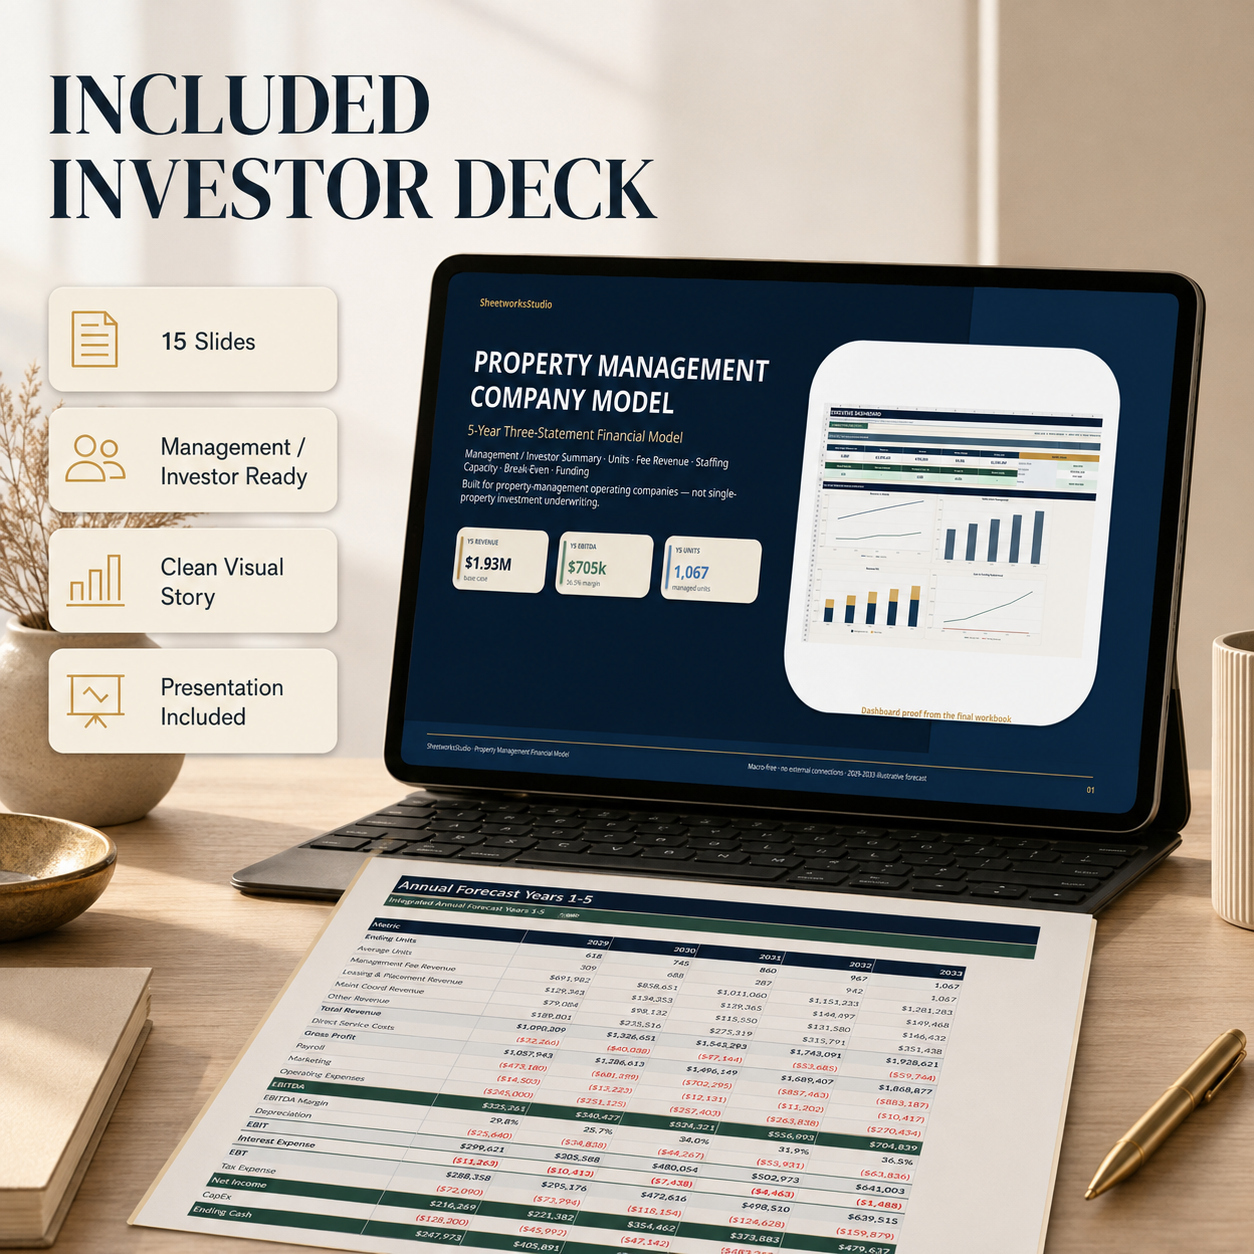
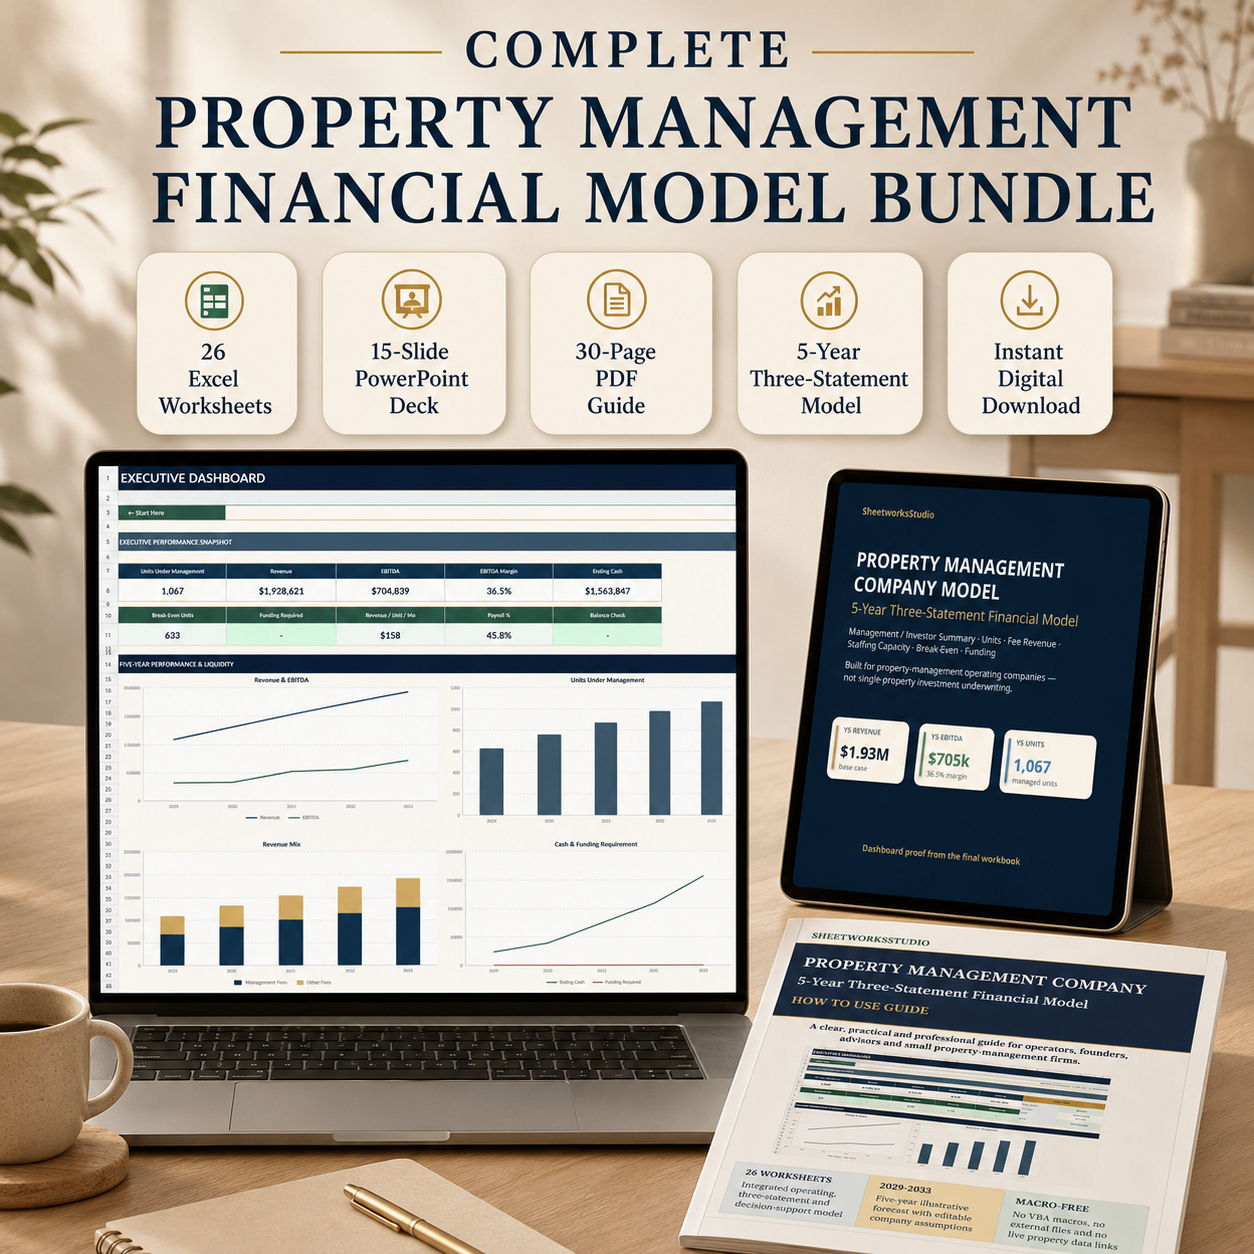
The package includes a 26-worksheet Excel Financial Model, a professional 15-slide Management / Investor PowerPoint Deck, and a detailed 30-page How-to-Use PDF Guide.
All included 2029–2033 figures are illustrative sample data and can be replaced with company-specific assumptions.


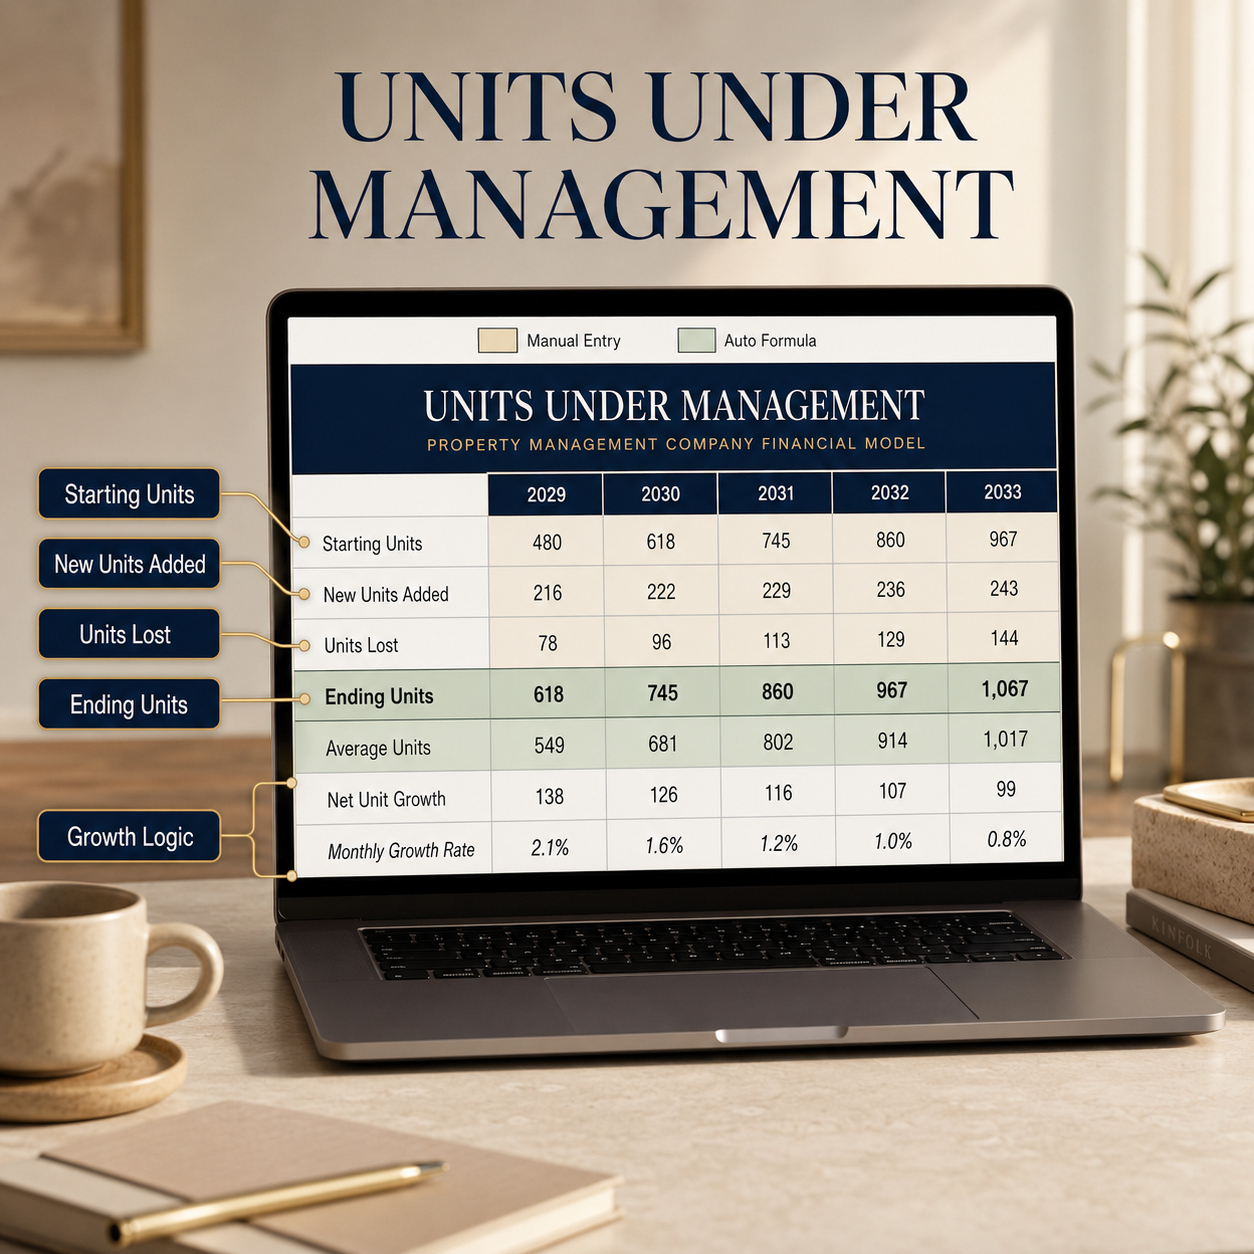
🏘️ UNITS UNDER MANAGEMENT
The operating model tracks:
βœ… Starting Units
βœ… New Units Added
βœ… Units Lost
βœ… Ending Units
βœ… Average Units
βœ… Net Unit Growth
βœ… Monthly Growth Rate
This creates a transparent portfolio roll-forward that drives revenue, staffing requirements, break-even analysis, and other model outputs.


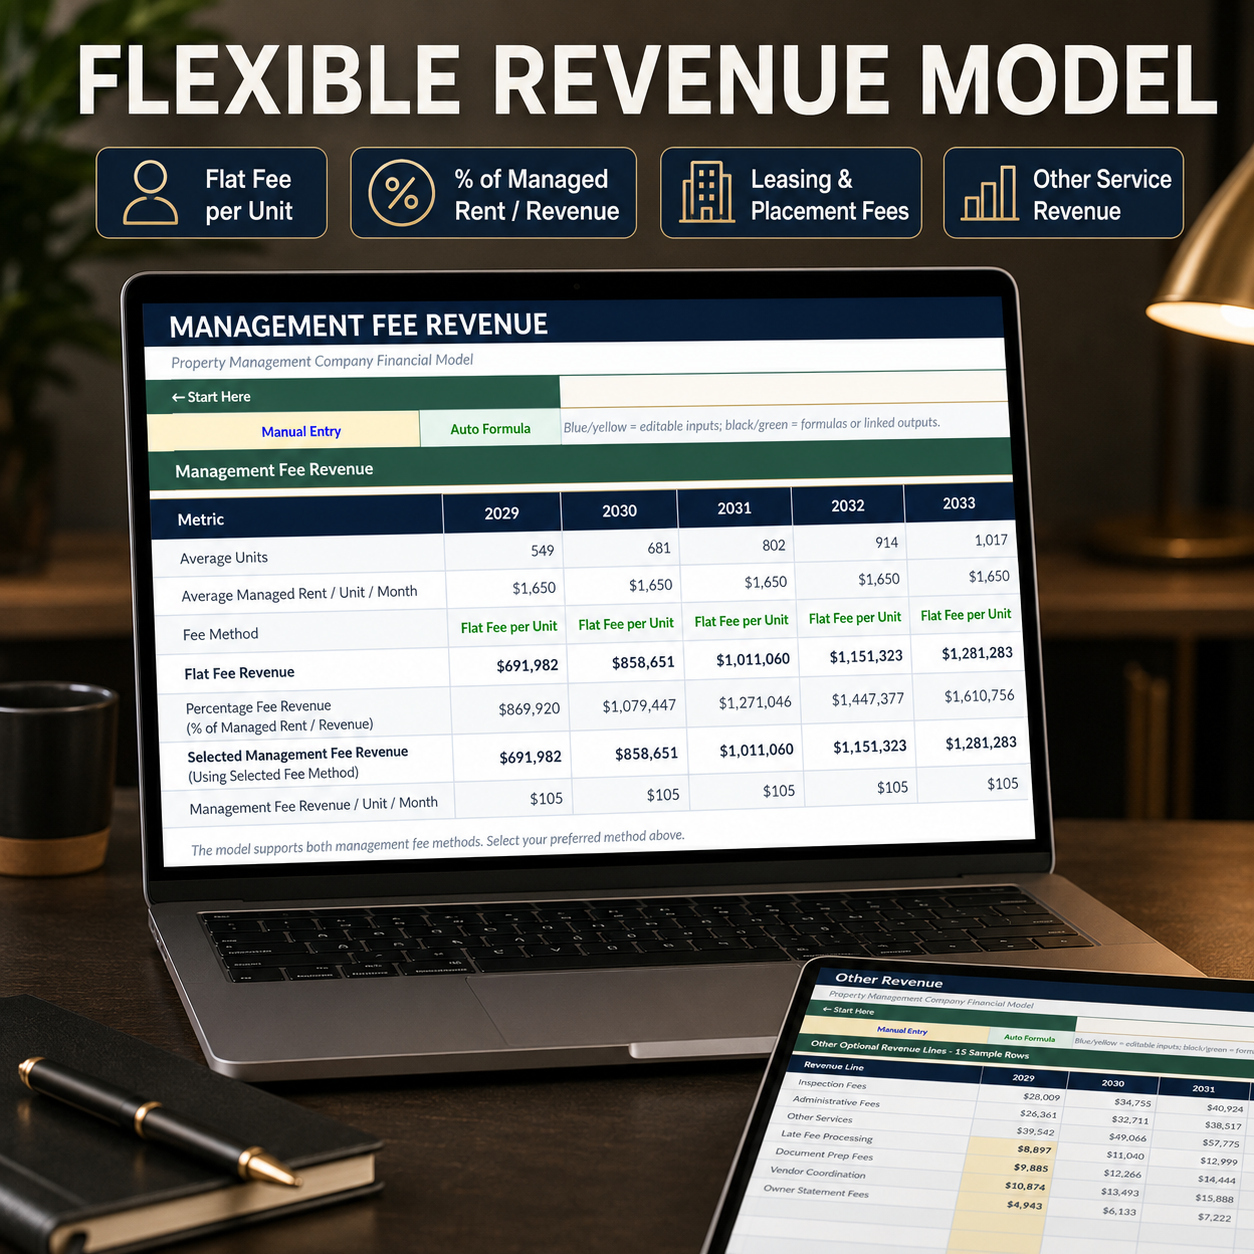
πŸ’° MANAGEMENT FEE REVENUE
The workbook supports two primary fee structures:
βœ… Flat Fee per Unit
βœ… Percentage of Managed Rent
Users can configure average managed rent, flat management fees, percentage fees, and related assumptions.
Additional revenue schedules include:
βœ… Leasing & Placement Fees
βœ… Renewal Fees
βœ… Maintenance Coordination
βœ… Inspection Fees
βœ… Administrative Fees
βœ… Other Service Revenue
βœ… Additional optional fee lines
This separates recurring management-fee revenue from ancillary service revenue for clearer analysis.


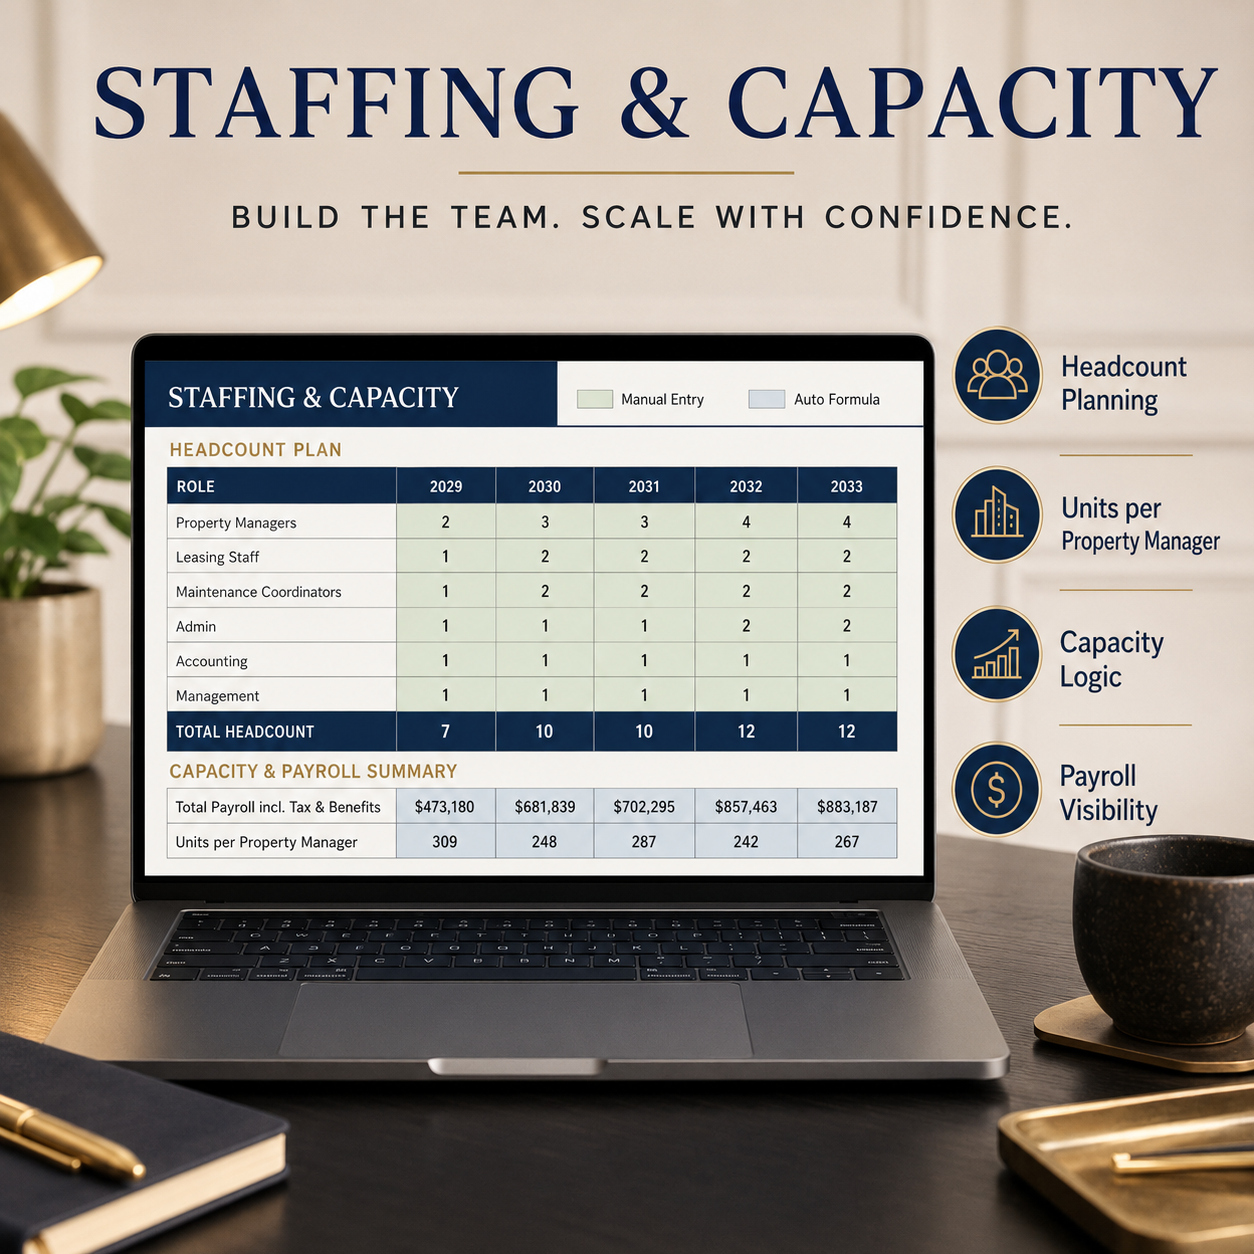
πŸ‘₯ STAFFING & CAPACITY
Plan staffing requirements for:
βœ… Property Managers
βœ… Leasing Staff
βœ… Maintenance Coordinators
βœ… Administration
βœ… Accounting
βœ… Management
The model incorporates starting headcount, compensation, role-specific capacity, projected headcount, total payroll, and Units per Property Manager.
This helps connect portfolio growth directly to operational capacity and staffing costs.


πŸ“‰ OPERATING EXPENSES & CLIENT ACQUISITION
Operating-cost planning includes 15 illustrative expense categories covering areas such as:
βœ… Office Rent
βœ… Software & Tools
βœ… Insurance
βœ… Professional Fees
βœ… Utilities
βœ… Training
βœ… Recruiting
βœ… Licenses & Subscriptions
βœ… Owner Reporting Tools
βœ… Other G&A
The Marketing & Client Acquisition schedule also provides 15 illustrative channels and calculates acquisition spending in relation to net new units.


πŸ—οΈ CAPEX, DEPRECIATION & DEBT
The model includes separate schedules for capital expenditure, depreciation, and debt.
CapEx can be planned across areas including software implementation, owner portals, computers, equipment, CRM, reporting systems, security, data migration, BI tools, and other investments.
Debt assumptions cover opening balances, new borrowing, interest, repayments, and closing debt.


🧾 FULL THREE-STATEMENT FINANCIAL MODEL
The workbook integrates:
βœ… Income Statement
βœ… Balance Sheet
βœ… Cash Flow Statement
The operating schedules flow into the financial statements, providing a connected view of revenue, gross profit, payroll, OPEX, EBITDA, net income, working capital, CapEx, financing, and cash.
A Balance Check supports financial-model QA and consistency.


πŸ“… MONTHLY + FIVE-YEAR FORECAST
The model includes:
βœ… Monthly Forecast β€” Year 1
βœ… Annual Forecast β€” Years 1–5
βœ… Illustrative forecast period 2029–2033
The five-year view consolidates Units Under Management, Management Fee Revenue, ancillary revenue, Total Revenue, operating costs, EBITDA, Net Income, CapEx, Ending Cash, Debt, and Funding Required.


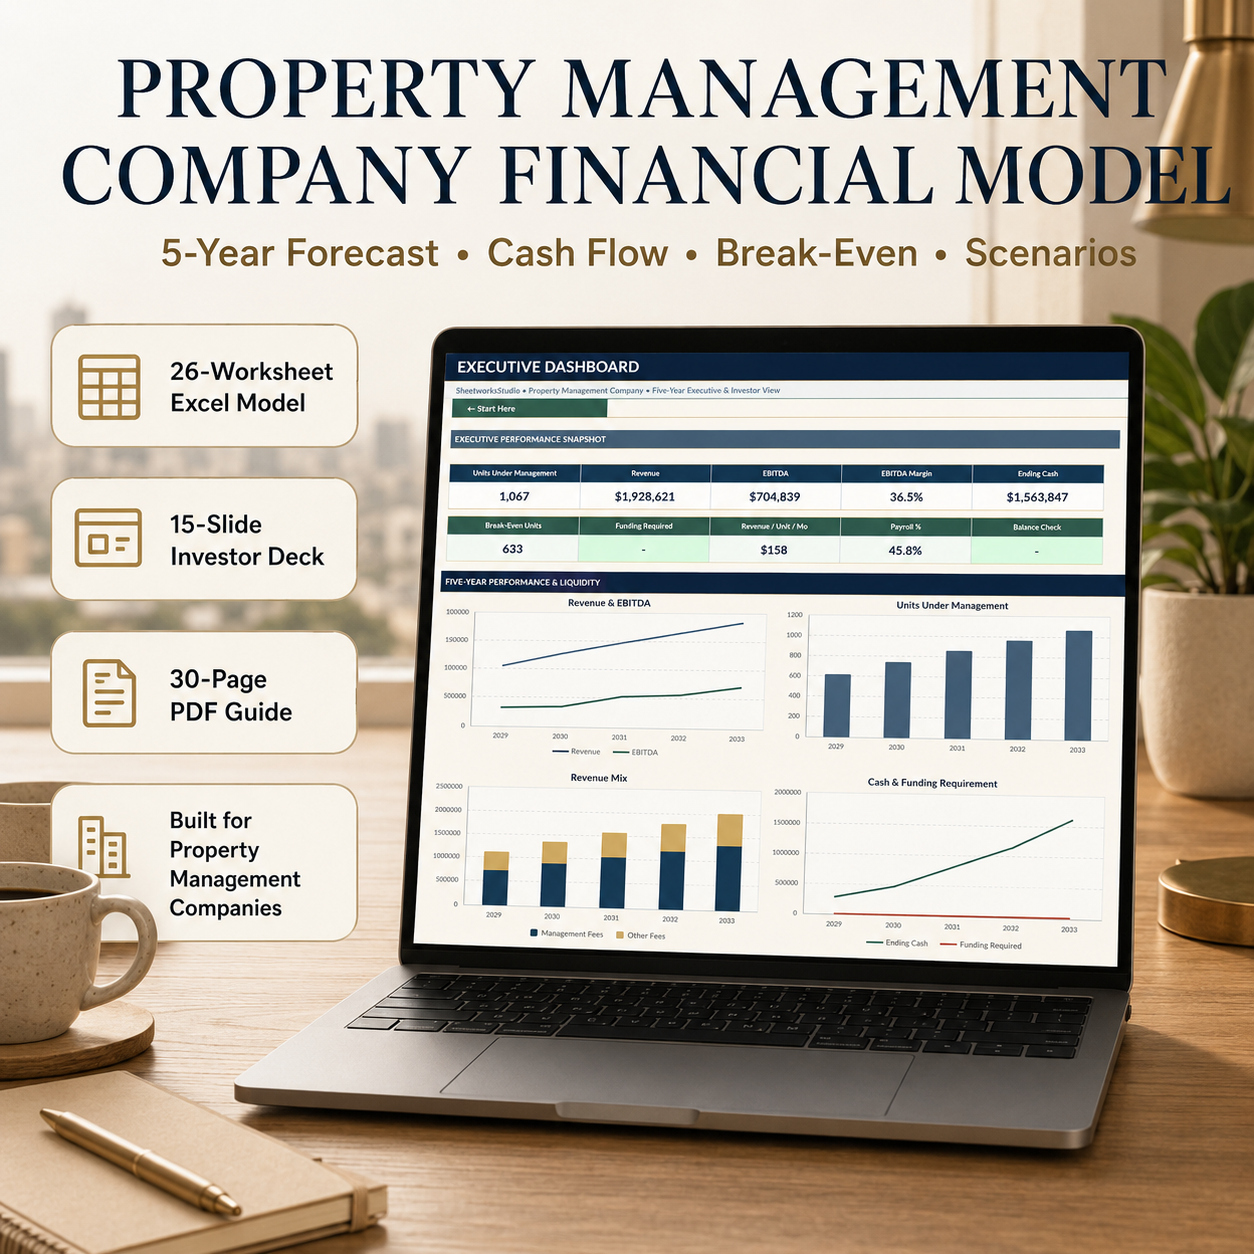
πŸ“Š EXECUTIVE DASHBOARD & KPI ANALYSIS
The Executive Dashboard provides an immediate management view of key outputs including:
✨ Units Under Management
✨ Revenue
✨ EBITDA
✨ EBITDA Margin
✨ Ending Cash
✨ Break-Even Units
✨ Funding Required
✨ Revenue per Unit / Month
✨ Payroll %
✨ Balance Check
Four integrated charts visualize:
πŸ“ˆ Units Under Management
πŸ’° Revenue & EBITDA
🧩 Revenue Mix
πŸ’΅ Cash & Funding Requirement
The dedicated KPI Analysis expands this view with metrics including:
βœ… Net Unit Growth
βœ… Management Fee Revenue
βœ… Other Fee Revenue
βœ… Units per Property Manager
βœ… Payroll %
βœ… EBITDA & EBITDA Margin
βœ… Ending Cash
βœ… Break-Even Units
βœ… Funding Required
βœ… Balance Check


🎯 BREAK-EVEN ANALYSIS
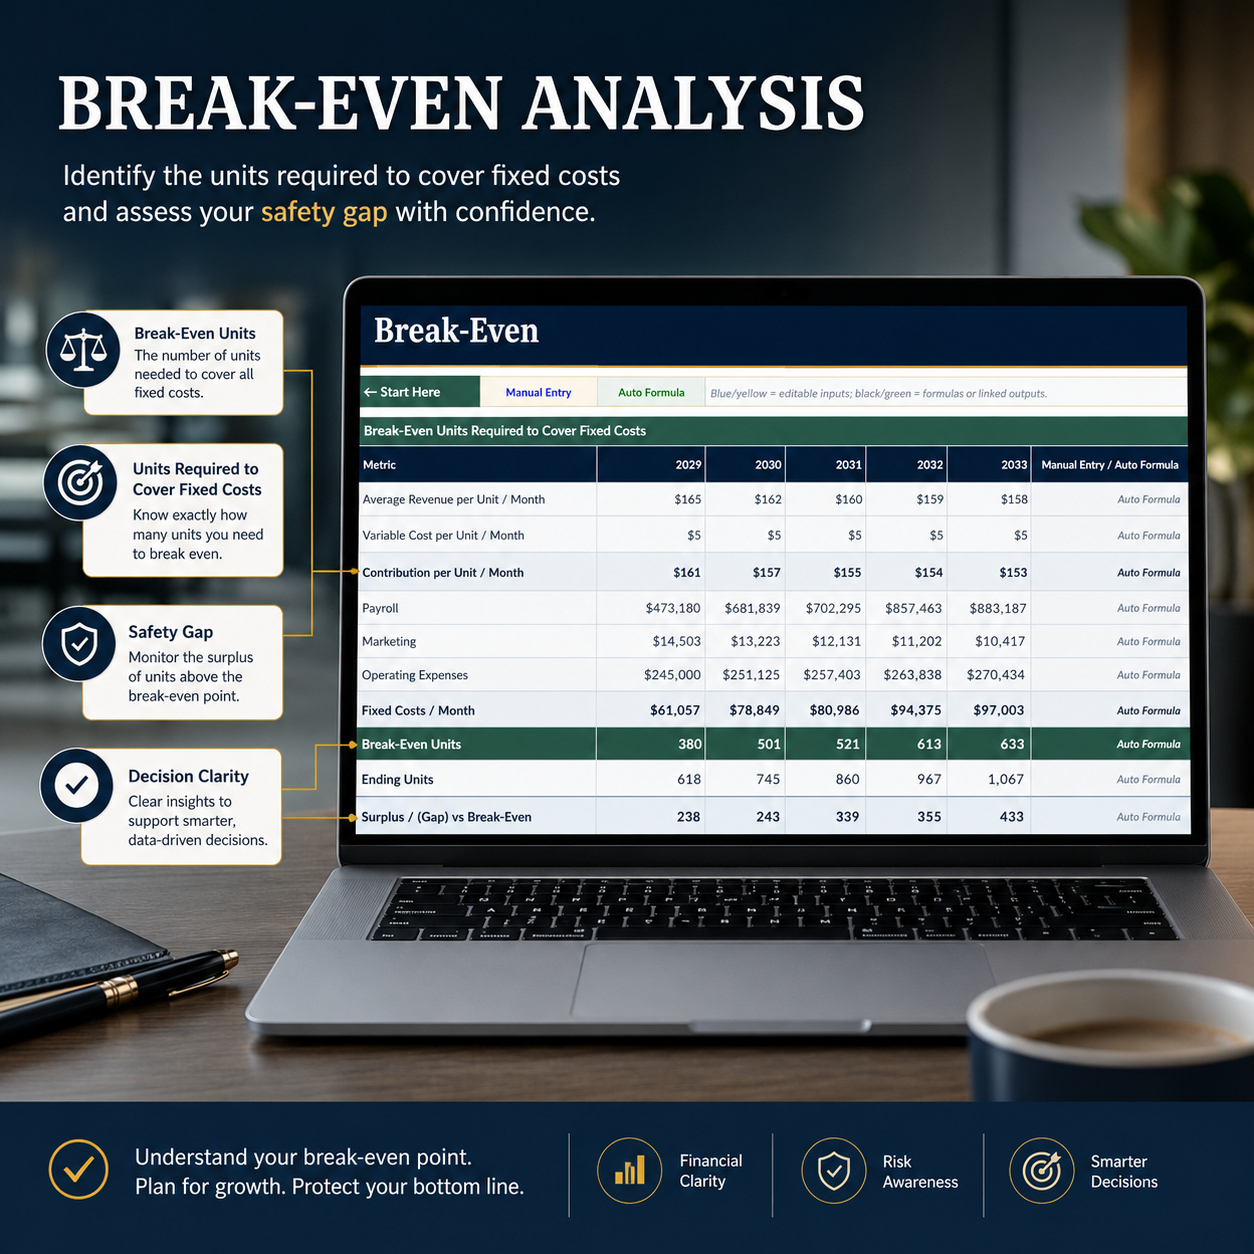
Estimate the number of managed units required to cover the company’s fixed operating costs.
The analysis considers:
βœ… Average Revenue per Unit
βœ… Variable Cost per Unit
βœ… Contribution per Unit
βœ… Payroll
βœ… Marketing
βœ… Operating Expenses
βœ… Fixed Costs
βœ… Break-Even Units
βœ… Surplus / Gap versus Break-Even


πŸ”„ BEAR β€’ BASE β€’ BULL SCENARIOS
Test three transparent operating scenarios:
πŸ”΄ Bear
πŸ”΅ Base
🟒 Bull


Scenario assumptions can flex:
βœ… Unit Growth
βœ… Fee Levels
βœ… Client Attrition
βœ… Payroll / Staffing
βœ… Operating Expenses
The scenario outputs compare projected Year 5 Revenue, EBITDA, and indicative cash.


πŸ“Š EBITDA SENSITIVITY ANALYSIS
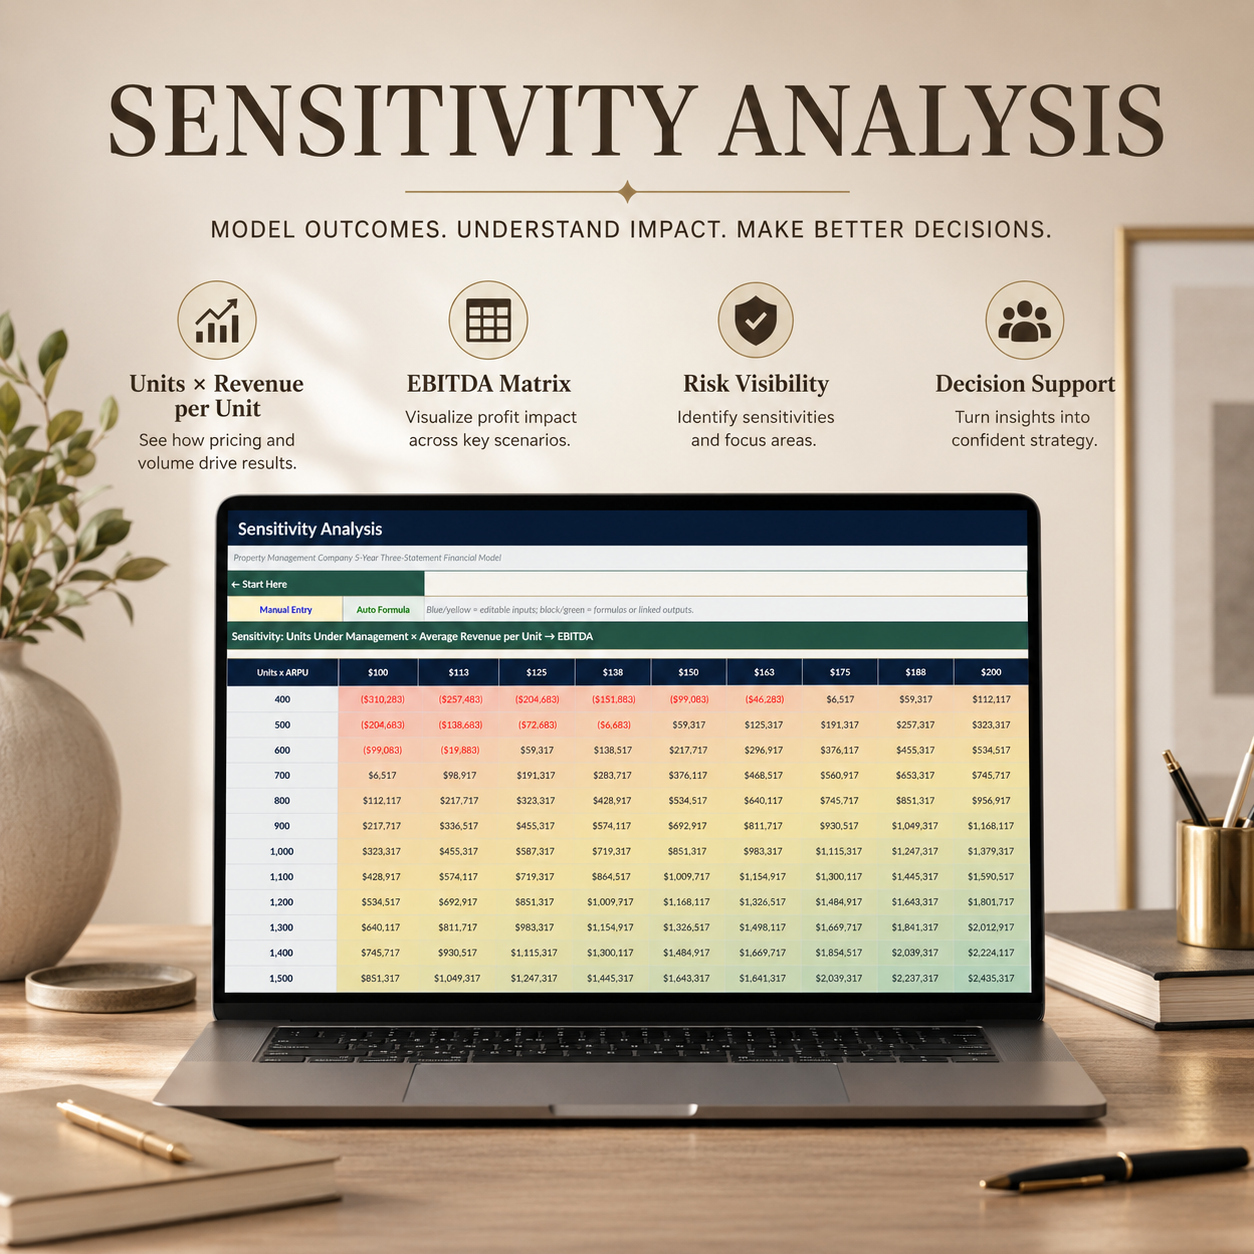
The sensitivity matrix analyzes how different combinations of:
Units Under Management Γ— Average Revenue per Unit
may affect EBITDA.
This provides a clear way to evaluate the relationship between portfolio scale, monetization, and profitability.


🏦 FUNDING REQUIREMENT
The Funding Requirement schedule evaluates:
βœ… Beginning Cash
βœ… Cash Flow from Operations
βœ… Capital Expenditures
βœ… Debt Draws
βœ… Debt Repayments
βœ… Ending Cash Before Funding
βœ… Minimum Cash Target
βœ… Funding Required
βœ… Ending Cash After Funding
This helps users identify whether projected liquidity remains above the chosen minimum cash threshold.


🎀 15-SLIDE MANAGEMENT / INVESTOR POWERPOINT
The included professional presentation covers:
🏒 Company / Model Overview
🏘️ Units Under Management
πŸ“ˆ Unit Growth
πŸ’° Revenue Model
🧩 Revenue Mix
πŸ‘₯ Staffing Capacity
πŸ“Š 5-Year Forecast
πŸ’Ž EBITDA Development
πŸ’΅ Cash Flow
🎯 Break-Even Units
🏦 Funding
πŸ”„ Scenario Analysis
⚠️ Sensitivity & Risks
⭐ Executive Summary
The deck is suitable for management reviews, consulting work, internal planning, financing preparation, and structured stakeholder discussions.


πŸ“˜ 30-PAGE HOW-TO-USE GUIDE
The detailed PDF guide covers:
βœ… Model Orientation
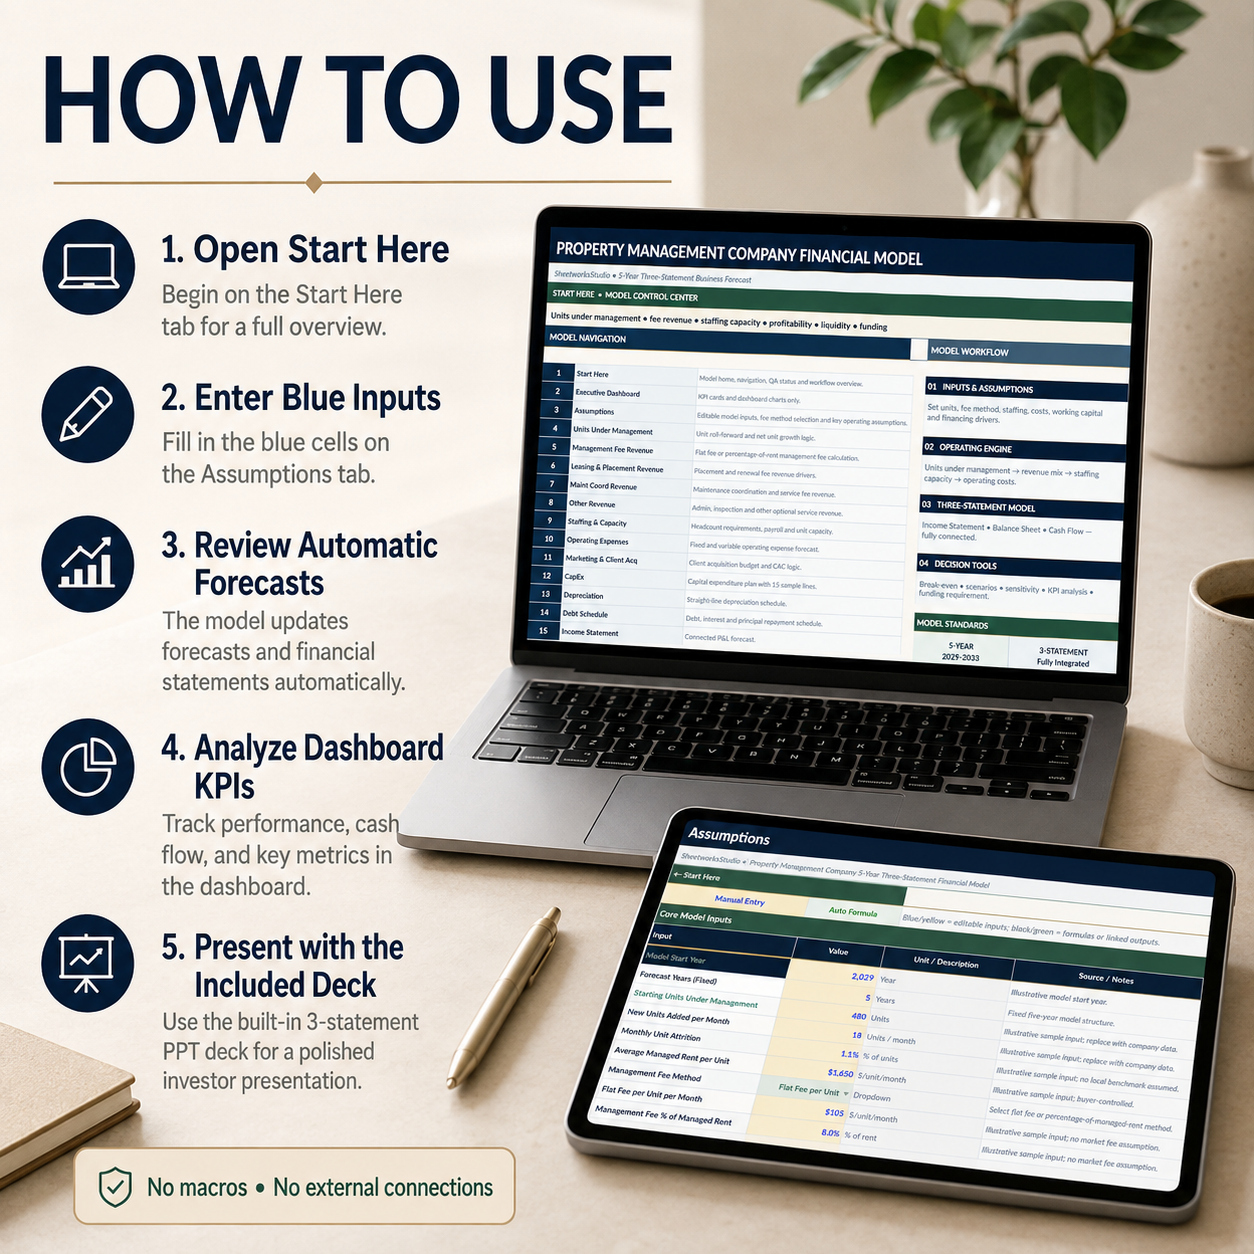
βœ… Quick Start
βœ… Editing Rules & Financial Model Color Logic
βœ… Start Here Navigation
βœ… Executive Dashboard
βœ… Assumptions
βœ… Units Under Management
βœ… Management Fee Revenue
βœ… Leasing & Placement Revenue
βœ… Maintenance Coordination & Other Revenue
βœ… Staffing & Capacity
βœ… OPEX & Marketing
βœ… CapEx, Depreciation & Debt
βœ… Income Statement
βœ… Balance Sheet
βœ… Cash Flow Statement
βœ… Monthly Forecast Year 1
βœ… Annual Forecast Years 1–5
βœ… Break-Even Analysis
βœ… Scenario Analysis
βœ… Sensitivity Analysis
βœ… KPI Analysis
βœ… Funding Requirement
βœ… Settings & Helper Logic
βœ… Google Sheets Workflow
βœ… Recommended Planning Workflow
βœ… Troubleshooting & QA
βœ… Final Review & Responsible Use


πŸ’» TECHNICAL COMPATIBILITY
βœ… Microsoft Excel (.xlsx)
βœ… Microsoft PowerPoint (.pptx)
βœ… PDF Guide
βœ… Google Sheets import possible where practical
βœ… No macros
βœ… No APIs
βœ… No external Excel links
βœ… No live property or accounting data feeds
πŸ“Œ Microsoft Excel remains the reference environment. Formatting, charts, or certain visual elements may vary after import into Google Sheets.


βš–οΈ IMPORTANT DISCLAIMER
This product is an editable template for financial planning, modeling, organizational, and decision-support purposes only.
All figures and assumptions included in the files are illustrative sample data and should be replaced with company-specific information before real-world use.


The model does not constitute financial, investment, accounting, tax, legal, real estate, valuation, financing, or business advice and does not guarantee forecast accuracy, profitability, funding availability, or business outcomes.
Users remain responsible for reviewing their assumptions, interpreting the outputs, and obtaining qualified professional advice where appropriate.


✨ SheetworksStudio β€” Professional Planning. Clear Numbers. Better Decisions.

This Best Practice includes
1 Property Management Company Financial Model (.xlsx), 1 Management / Investor Summary Deck (.pptx), 1 How-to-Use Guide

Acquire business license for $79.90

Add to cart

Add to bookmarks

Discuss

Further information

The objective of this financial model is to provide property management companies, founders, finance professionals, consultants, and management teams with a structured framework for translating operating assumptions into financial performance, liquidity, and funding requirements.

Users can model Units Under Management, new portfolio growth, client attrition, management fees, ancillary service revenue, staffing capacity, payroll, operating expenses, client acquisition, CapEx, debt, and working-capital assumptions within one integrated planning system.

The model is designed to help management evaluate how portfolio scale and revenue per unit influence profitability, how staffing requirements evolve as the managed portfolio grows, how many units may be required to reach break-even, and whether forecast cash remains above a defined minimum level.

Scenario and sensitivity tools also support structured discussions around growth, pricing, attrition, cost structures, EBITDA, and liquidity.

This model is particularly suitable for:

Property management operating companies
Residential property management firms
Small and growing real estate management businesses
Property management founders and owners
CFOs and finance managers
Operations managers
Management consultants
Property management consultants
Fractional CFOs
Business advisors
Management teams preparing budgets or forecasts

It is especially useful when evaluating portfolio growth, comparing management-fee models, planning staffing capacity, testing client attrition assumptions, assessing profitability, estimating break-even scale, preparing a multi-year budget, or reviewing future liquidity and funding requirements.

This model is designed for a property management operating company and is not intended to model the acquisition, valuation, financing, rental yield, IRR, cap rate, or investment return of individual properties or real estate portfolios.

It does not replace accounting software, property-management systems, ERP platforms, specialist FP&A systems, professional valuation models, or real estate investment underwriting tools.

It does not include live property data, automatic accounting feeds, APIs, bank integrations, market benchmarks, or external data connections.

The template does not constitute financial, investment, accounting, tax, legal, real estate, valuation, financing, or business advice.


0.0 / 5 (0 votes)

please wait...