

Originally published: 21/06/2019 15:53
Publication number: ELQ-87478-1
View all versions & Certificate
Publication number: ELQ-87478-1
View all versions & Certificate

Statistics for Business
Statistics for Business consists of an excel spreadsheet that presents the main statistical tools used in business.
Description
Statistics for Business consists of an excel spreadsheet that presents the main statistical tools used in business. The spreadsheet presents a range of techniques using excel formulas. These tools can be used for business decisions and analysis or as a supporting tool in relevant academic courses (Statistics, Distributions, Hypothesis Testing, Regressions).
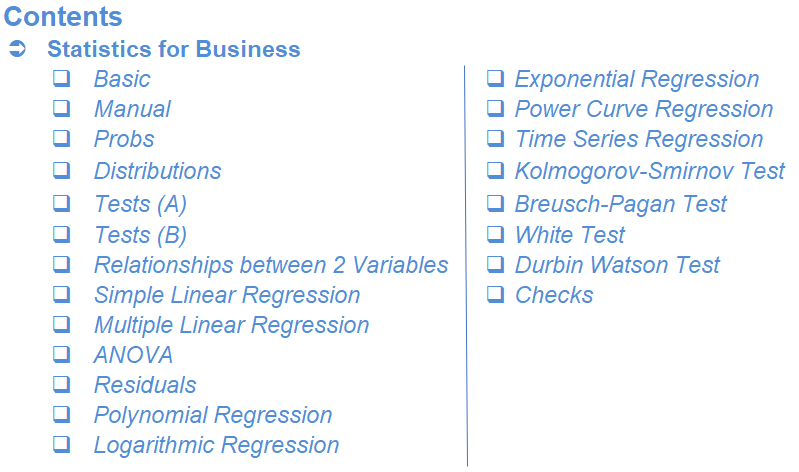
So a quick overview of the model, in the contents tab you can see the structure of the model and by clicking on any of the headlines to be redirected to the relevant worksheet.
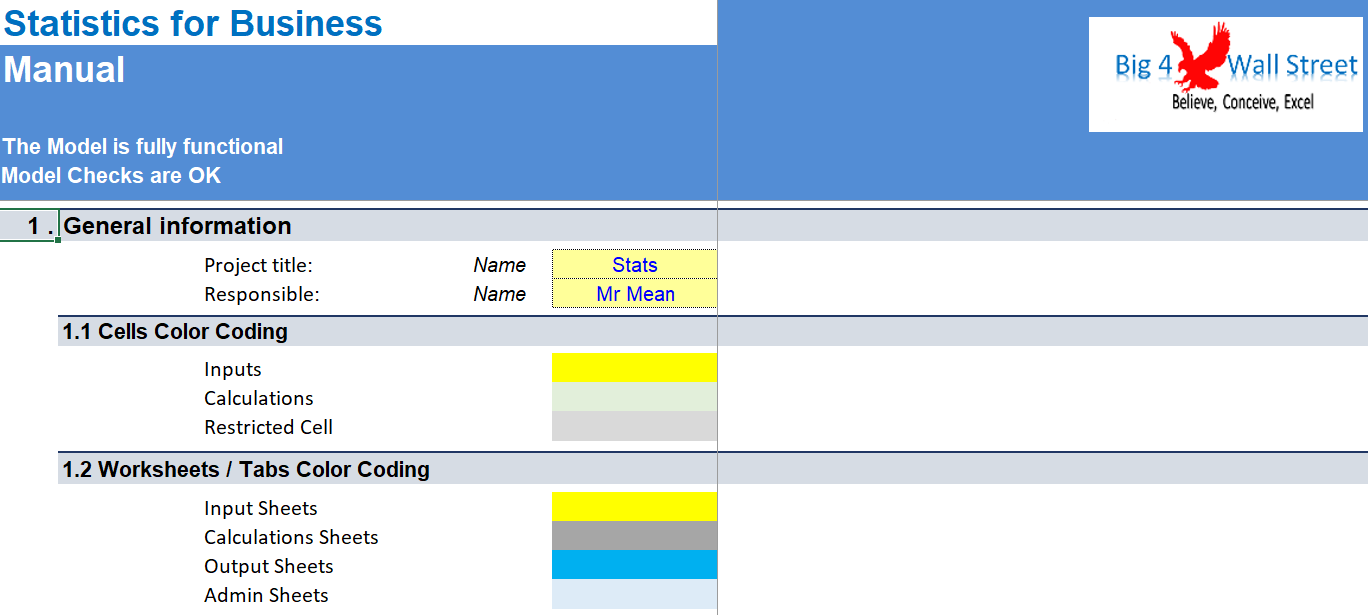
On the manual tab you are able to feed the general information for the model such as: project title, responsible. Additionally there is a description of the color coding of the model in the same tab. Inputs are always depicted with a yellow fill and blue letters, and calculations are depicted with light green fill and black characters, finally restricted cells are in light grey fill.
There is also a color coding for the various tabs of the model. Yellow tabs are mostly assumptions tabs, grey tabs are calculations tabs, blue tabs are outputs tabs (that is effectively results or graphs) and finally light blue tabs are admin tabs (for example: the cover page, contents and checks).
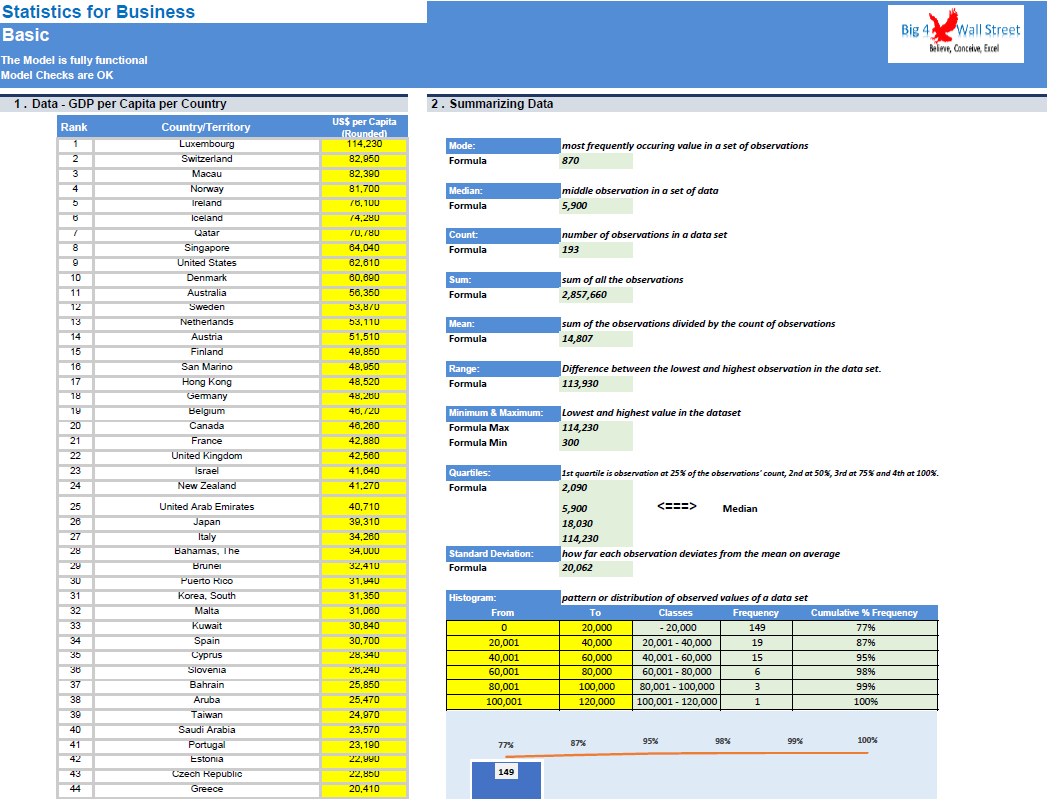
Starting from the tab "Basic", we present the formula used in order to summarize data such as mean, median, mode, count, sum, average, minimum and maximum, quartiles and standard deviation. We finish by constructing an histogram with the data used.
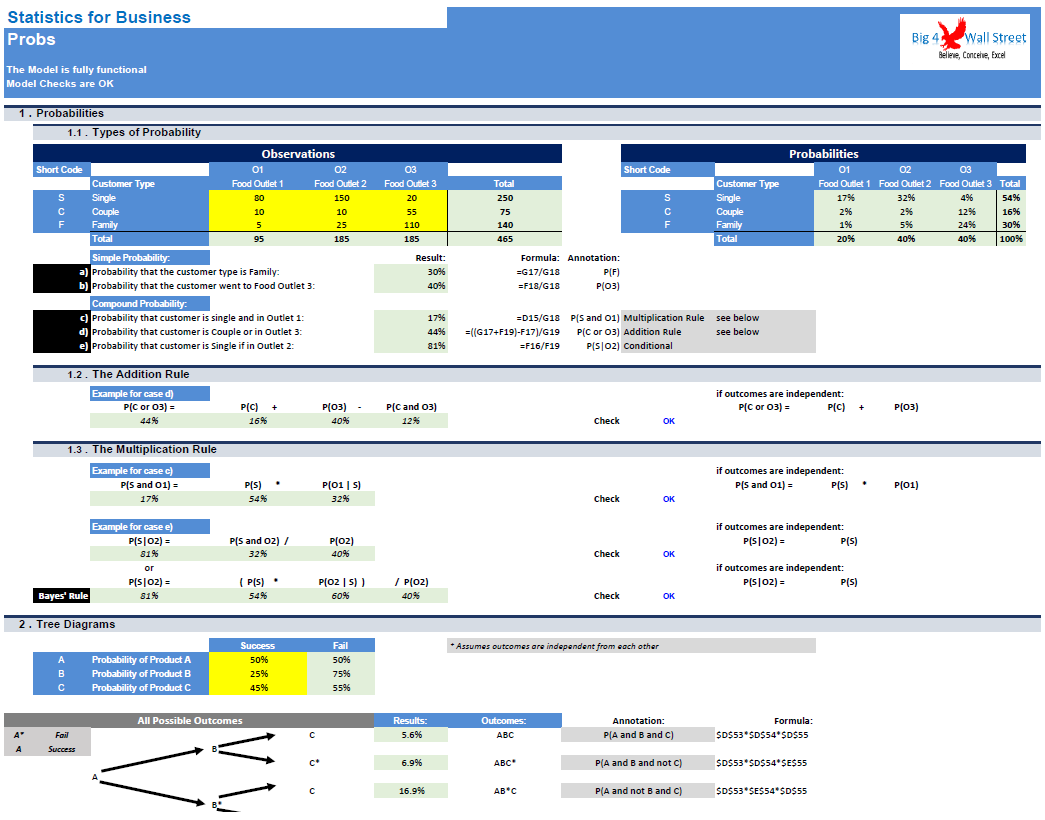
Moving on we present probabilities in the "Probs" tab, where we depict the types of probability, the addition and multiplication rules, tree diagrams, decision analysis and the decision rules.
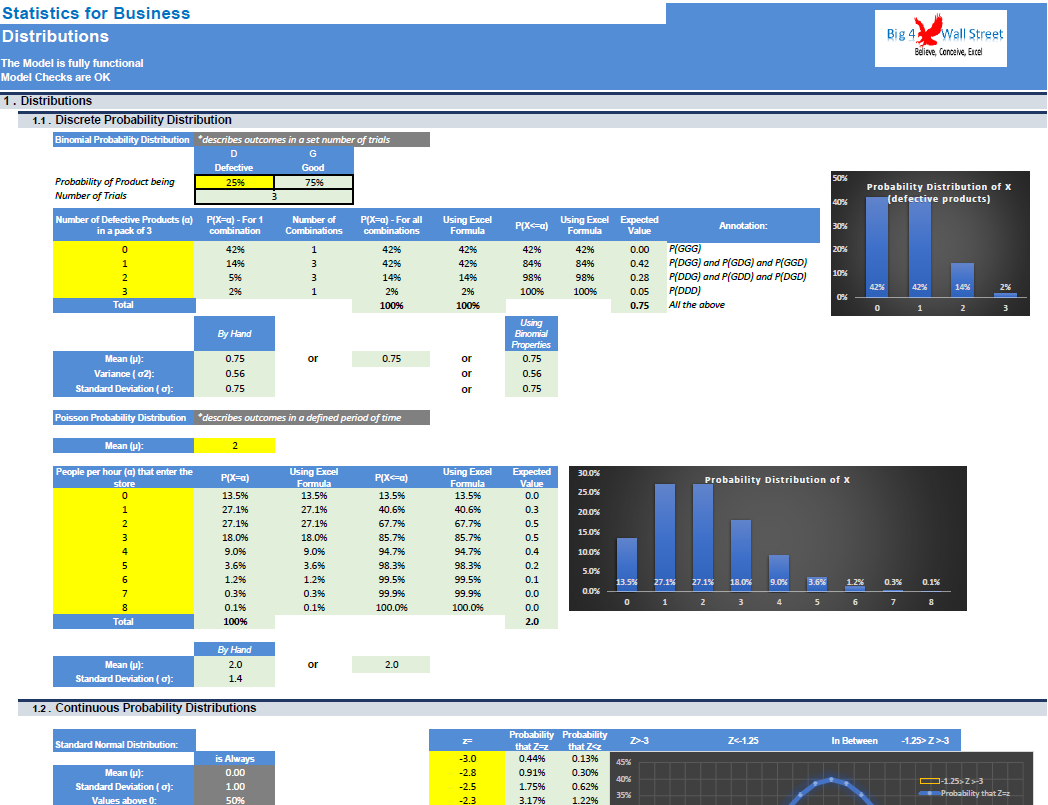
In the following tab, distributions are presented starting from discrete probability distributions (Binomial and Poisson) and ending with continuous probability distributions (standard normal and exponential distribution).
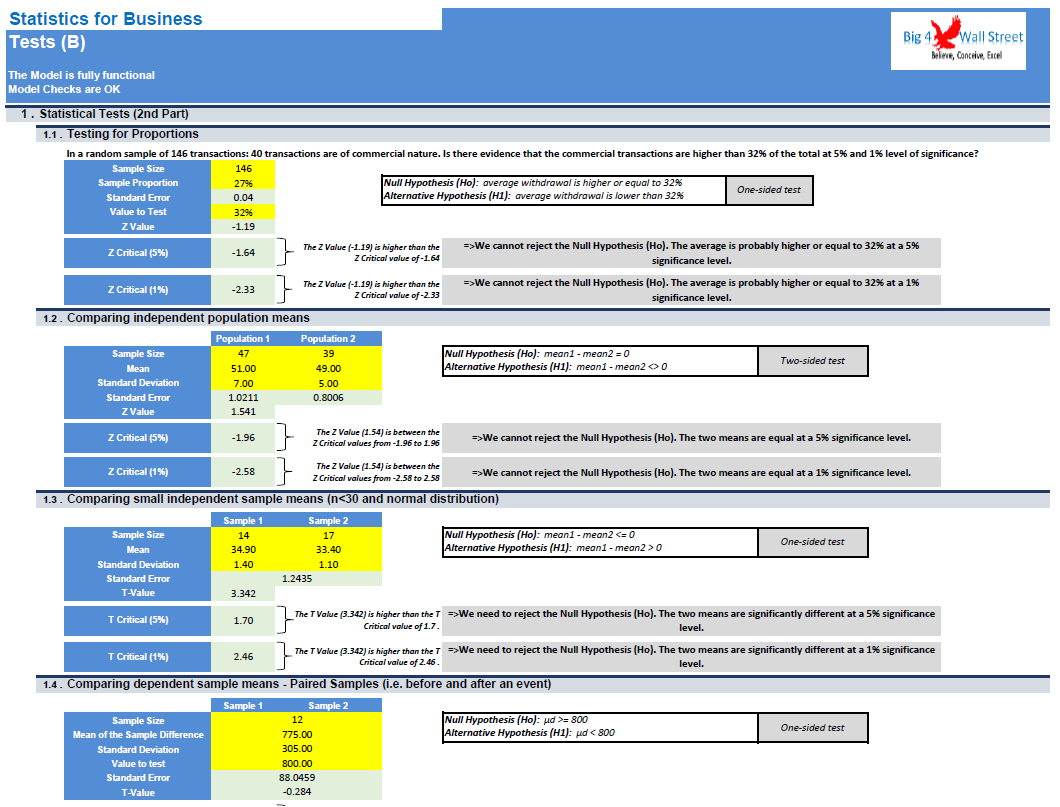
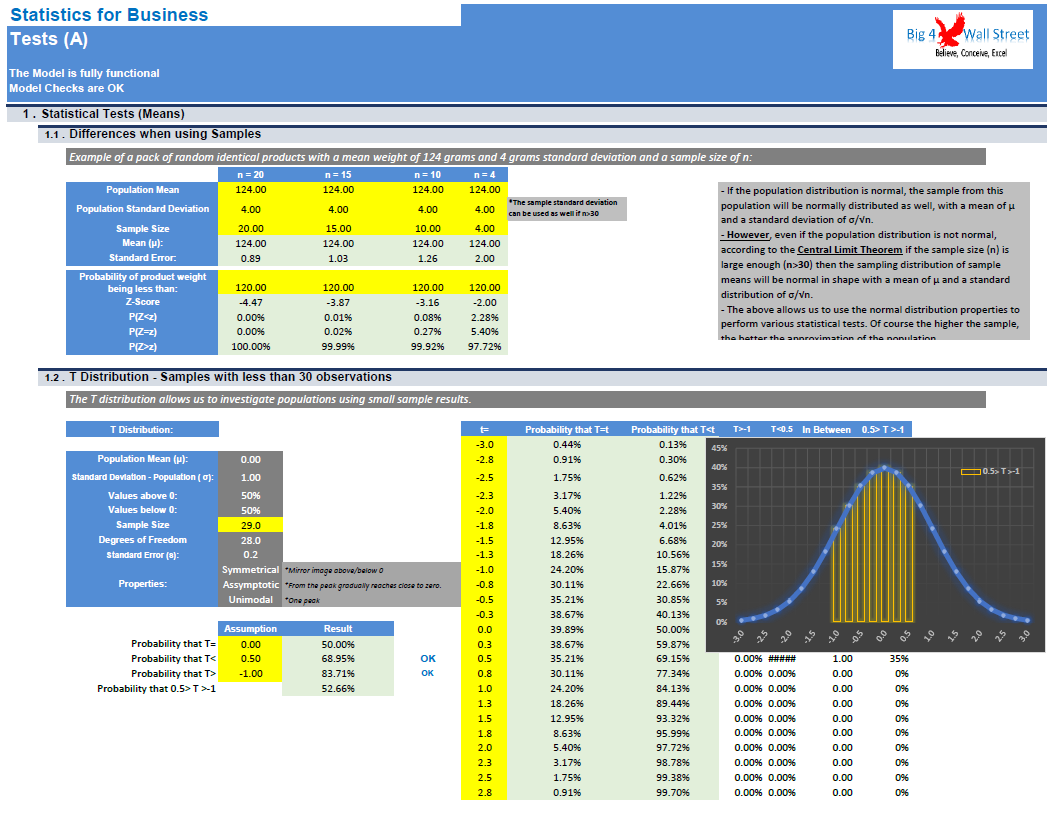
In the next two tabs "Tests A" and "Tests B", a series of statistical tests using the Z and T distribution are presented, as well as the process to choose between the two distributions, and applying correctly the criteria for acceptance or rejection of the null hypothesis. The second tab presents tests for proportions, independent population means and paired samples.
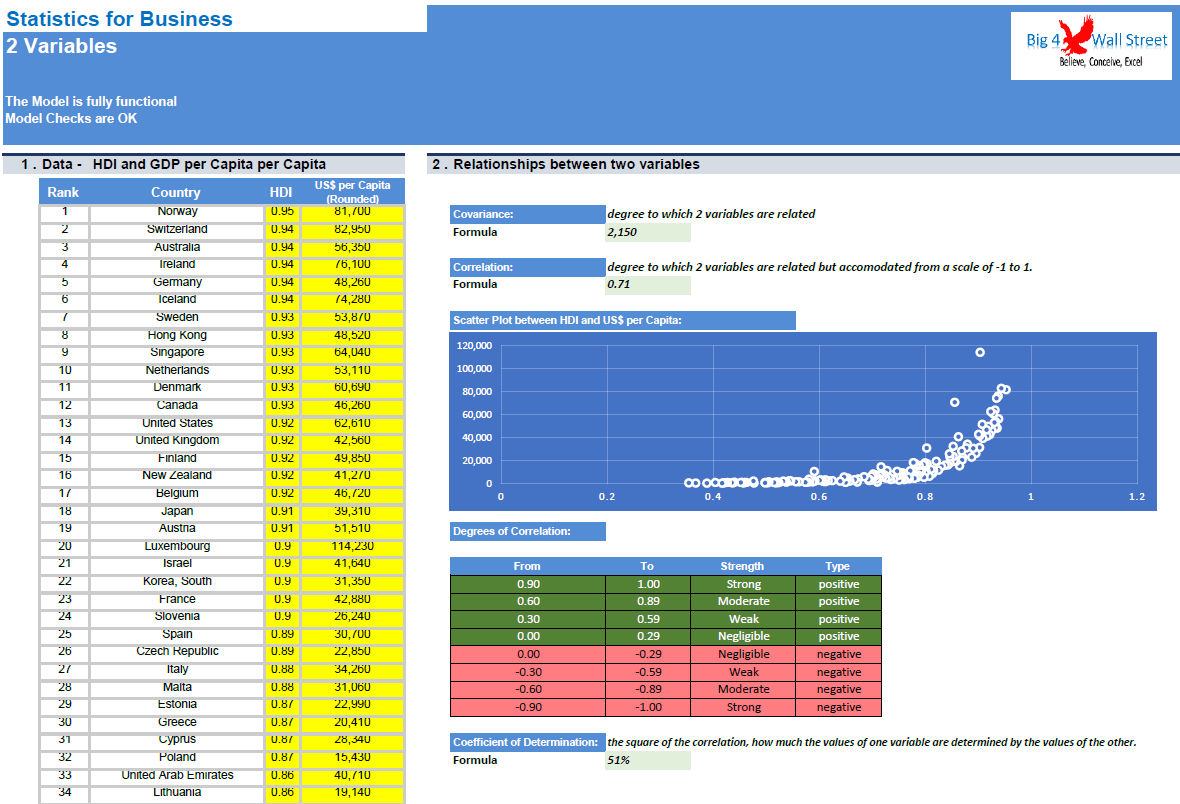
Moving on the relationship between two variables is presented in "2 Variables" tab where covariance, correlation and coefficient of determination are depicted as well as the degrees of correlation.
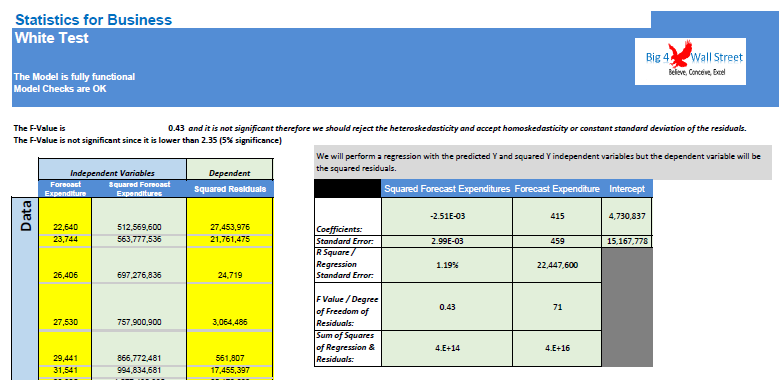
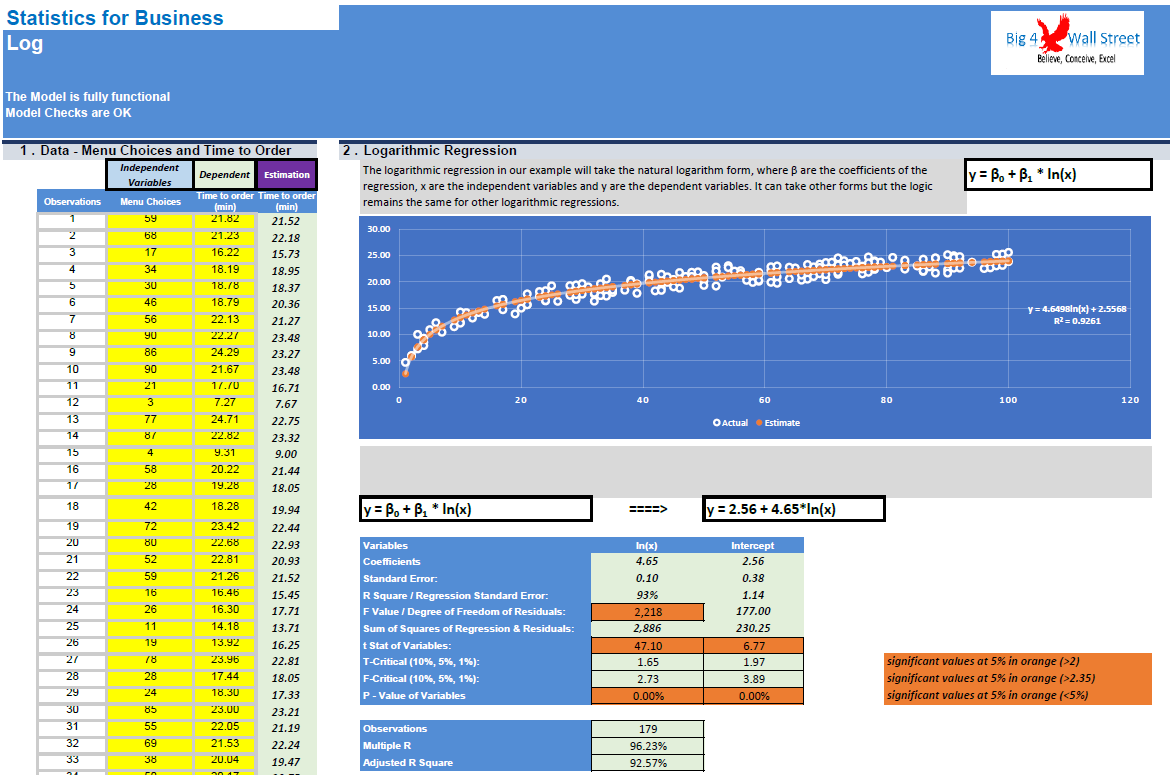
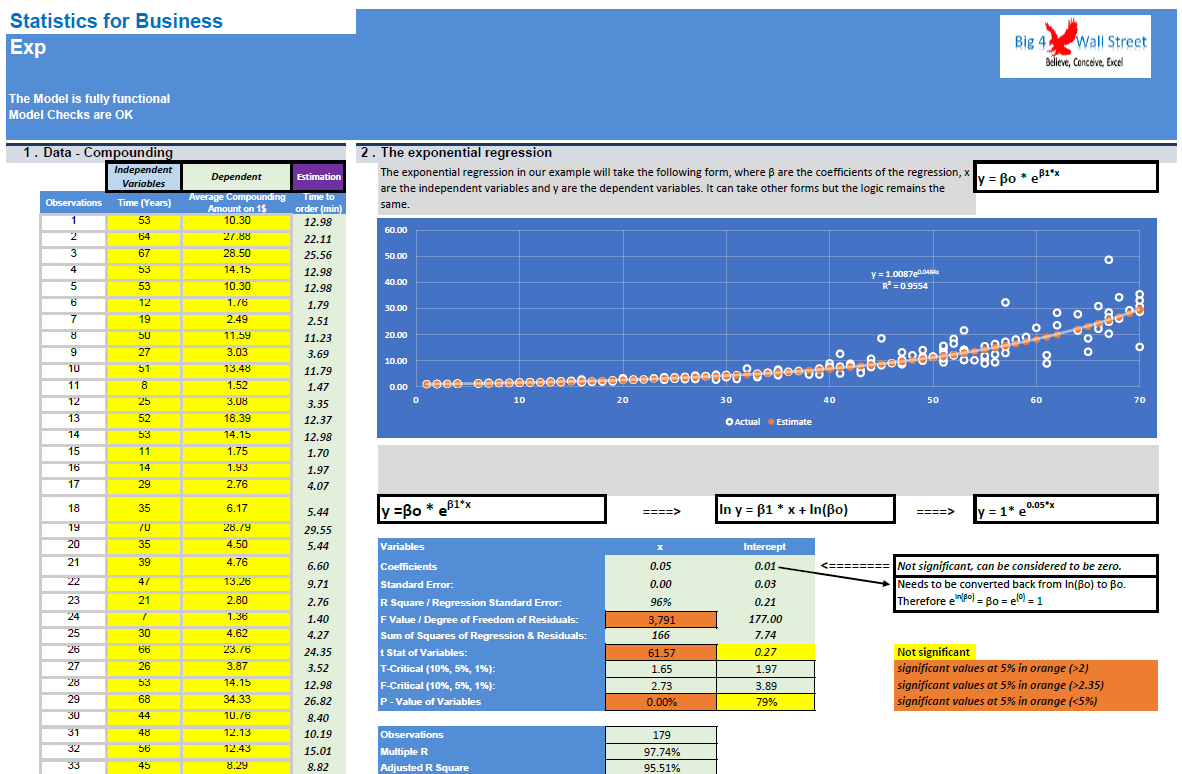
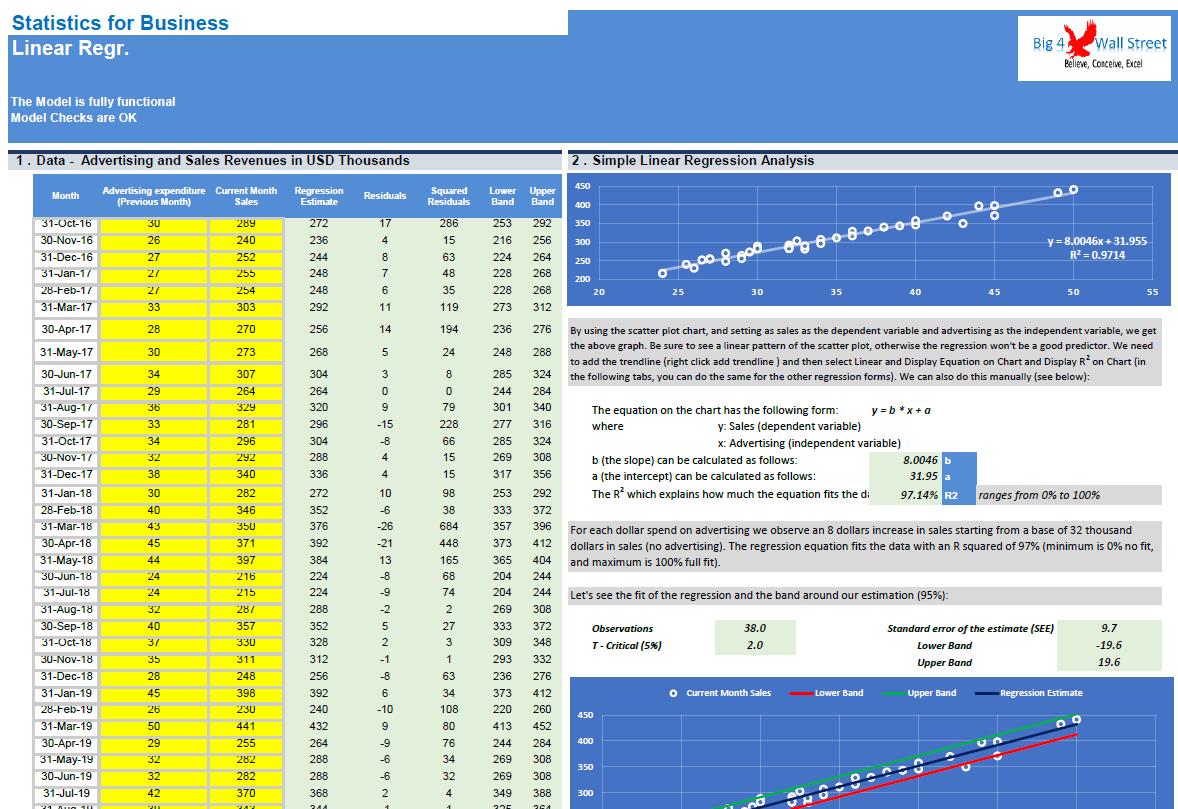
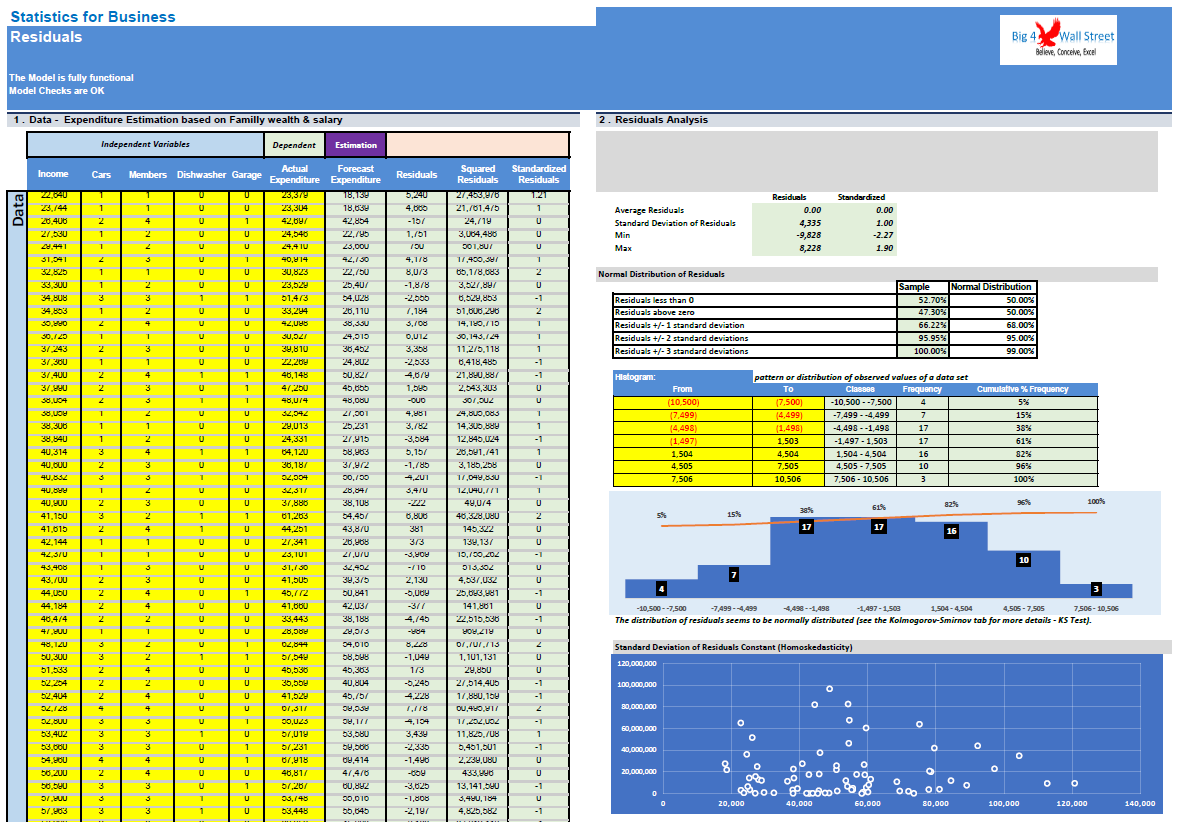
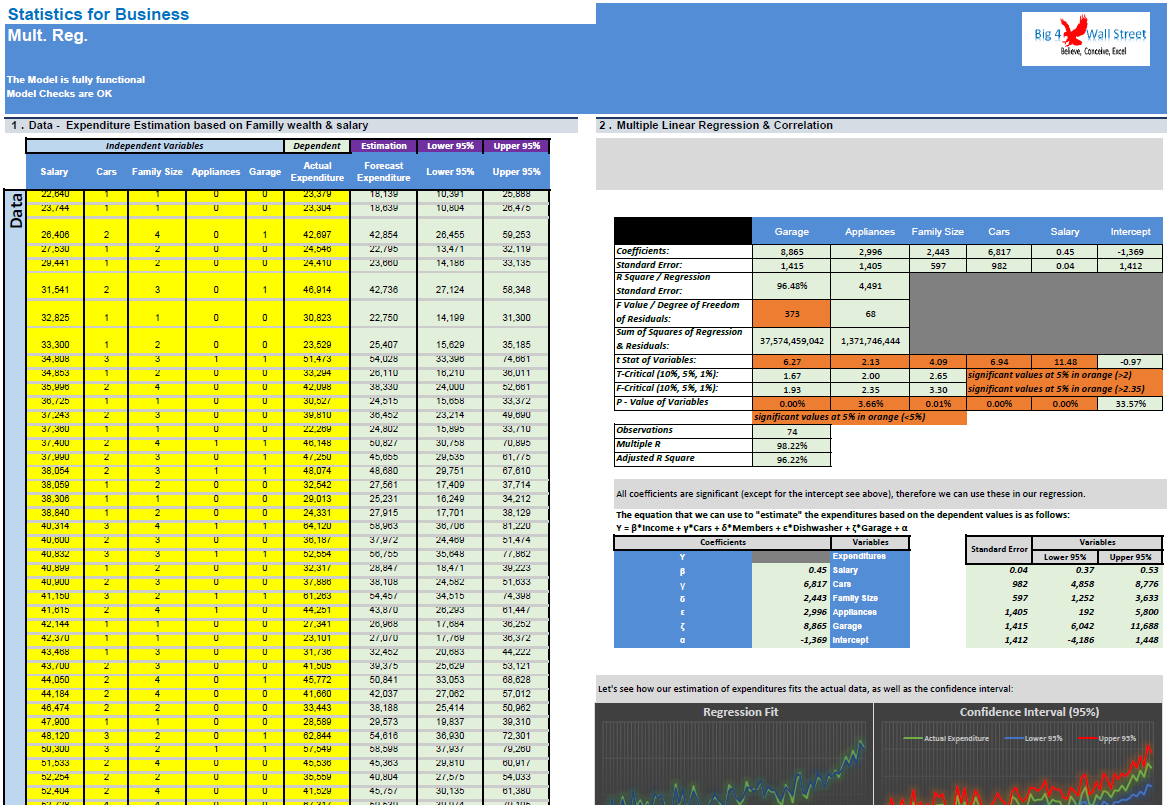
The following tabs are related to regression analysis. We start from a simple linear regression, then we examine the Multiple Linear Regression. We present how to determine using excel the coefficients of the regression, the Standard Error, R Square, Regression Standard Error, F Value, Degree of Freedom of Residuals, Sum of Squares of Regression, Residuals, t Stat of Variables, T-Critical at 10%, 5%, 1%, F-Critical at 10%, 5%, 1%, P Value of Variables, Observations, Multiple R and Adjusted R Square. We also perform ANOVA analysis and a series of residuals tests in the relevant worksheets (Kolmogorov-Smirnov, Breusch-Pagan, White, Durbin Watson).
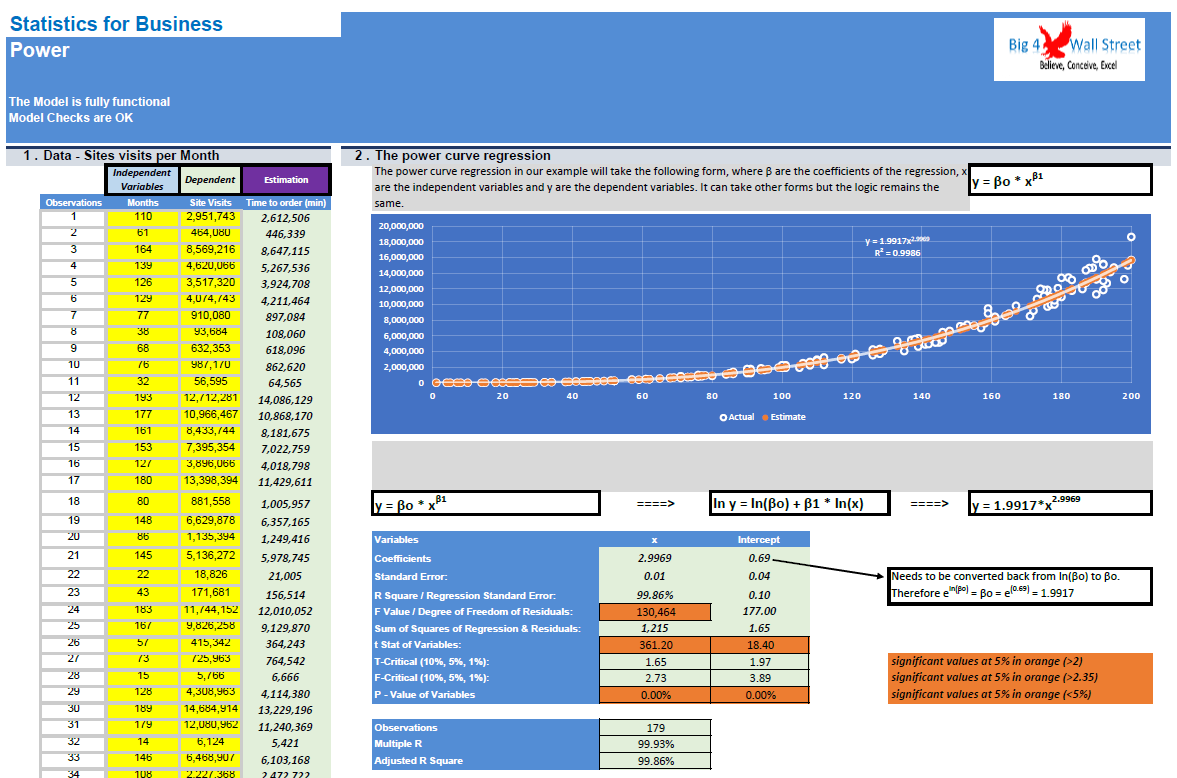
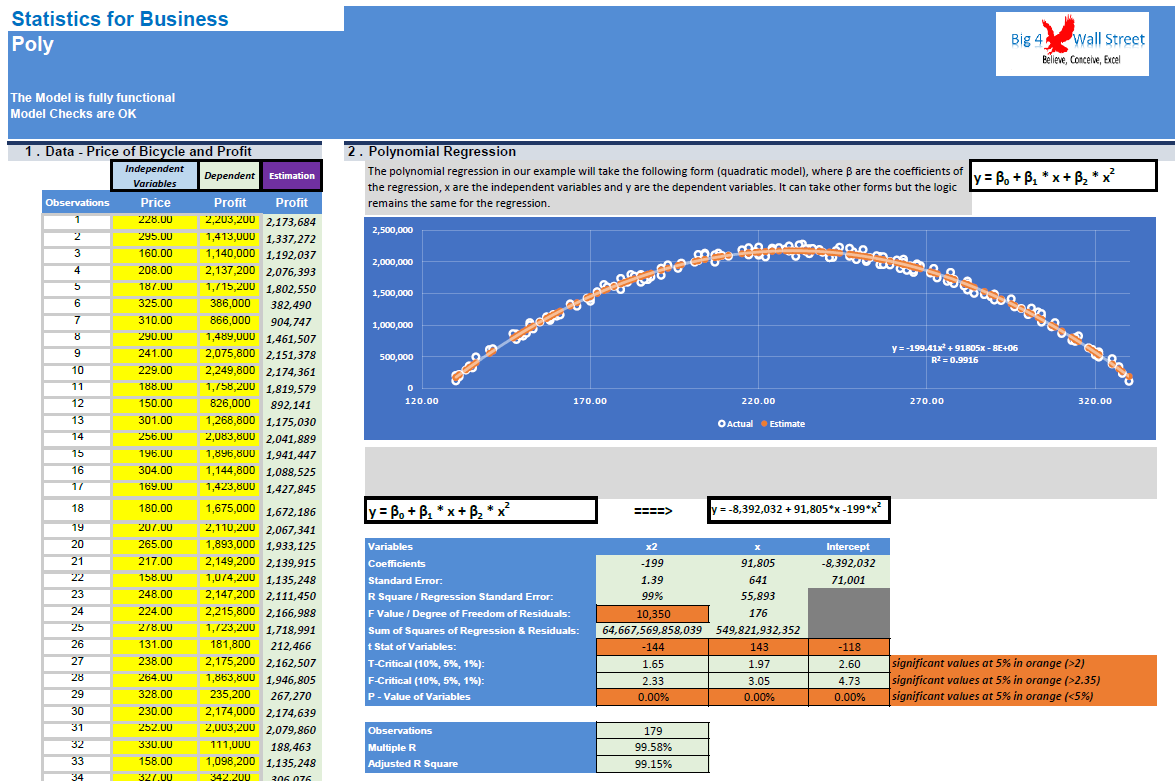
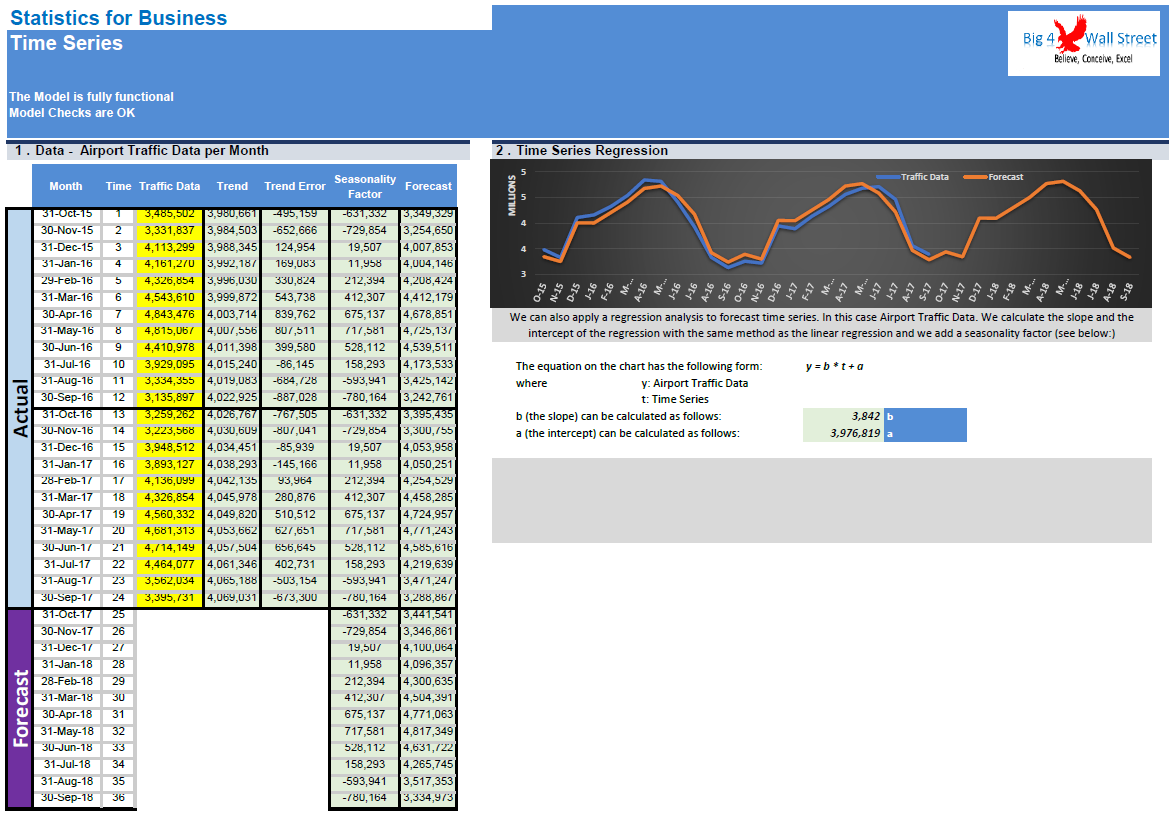
Besides the linear regressions we also examine regressions such as polynomial, logarithmic, exponential, power and times series with seasonality.
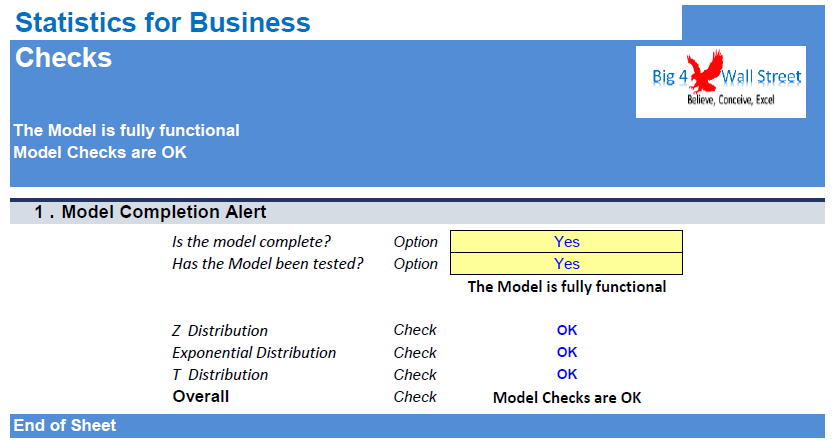
Finally the last tab ensures that everything in this model is working as it should.
Statistics for Business consists of an excel spreadsheet that presents the main statistical tools used in business. The spreadsheet presents a range of techniques using excel formulas. These tools can be used for business decisions and analysis or as a supporting tool in relevant academic courses (Statistics, Distributions, Hypothesis Testing, Regressions).
So a quick overview of the model, in the contents tab you can see the structure of the model and by clicking on any of the headlines to be redirected to the relevant worksheet.
On the manual tab you are able to feed the general information for the model such as: project title, responsible. Additionally there is a description of the color coding of the model in the same tab. Inputs are always depicted with a yellow fill and blue letters, and calculations are depicted with light green fill and black characters, finally restricted cells are in light grey fill.
There is also a color coding for the various tabs of the model. Yellow tabs are mostly assumptions tabs, grey tabs are calculations tabs, blue tabs are outputs tabs (that is effectively results or graphs) and finally light blue tabs are admin tabs (for example: the cover page, contents and checks).
Starting from the tab "Basic", we present the formula used in order to summarize data such as mean, median, mode, count, sum, average, minimum and maximum, quartiles and standard deviation. We finish by constructing an histogram with the data used.
Moving on we present probabilities in the "Probs" tab, where we depict the types of probability, the addition and multiplication rules, tree diagrams, decision analysis and the decision rules.
In the following tab, distributions are presented starting from discrete probability distributions (Binomial and Poisson) and ending with continuous probability distributions (standard normal and exponential distribution).
In the next two tabs "Tests A" and "Tests B", a series of statistical tests using the Z and T distribution are presented, as well as the process to choose between the two distributions, and applying correctly the criteria for acceptance or rejection of the null hypothesis. The second tab presents tests for proportions, independent population means and paired samples.
Moving on the relationship between two variables is presented in "2 Variables" tab where covariance, correlation and coefficient of determination are depicted as well as the degrees of correlation.
The following tabs are related to regression analysis. We start from a simple linear regression, then we examine the Multiple Linear Regression. We present how to determine using excel the coefficients of the regression, the Standard Error, R Square, Regression Standard Error, F Value, Degree of Freedom of Residuals, Sum of Squares of Regression, Residuals, t Stat of Variables, T-Critical at 10%, 5%, 1%, F-Critical at 10%, 5%, 1%, P Value of Variables, Observations, Multiple R and Adjusted R Square. We also perform ANOVA analysis and a series of residuals tests in the relevant worksheets (Kolmogorov-Smirnov, Breusch-Pagan, White, Durbin Watson).
Besides the linear regressions we also examine regressions such as polynomial, logarithmic, exponential, power and times series with seasonality.
Finally the last tab ensures that everything in this model is working as it should.
This Best Practice includes
1 Excel + 1 PDF
