
Originally published: 30/11/2020 09:13
Publication number: ELQ-41764-1
View all versions & Certificate
Publication number: ELQ-41764-1
View all versions & Certificate

Forecasting Accuracy Report
Cascading Forecast: Transparency in the Year End Forecast
Description
Too often, there is a tendency to be overly optimistic when forecasting. It is not much fun being the bearer of bad news, or there may be a natural bias of optimism.
I have been guilty of this. After actualizing the first few months of a new year, and seeing red to the original budget numbers, I have tweaked up revenues, or low balled expenses in the remaining months' forecast, so that the year end forecast would still be in line with budget. The thinking was that we could just make up the shortfall in later months. However, the year end forecast was becoming biased with optimism.
Once a forecast becomes overly optimistic, the complacency shortens the opportunity to initiate cost containment measures and revenue driving strategies to make up for the shortfall.
Forecasting bias can cut both ways. Just as a forecast can be embedded with too much optimism, also known as "blue-skying", there can also be bias leading to under forecasting, commonly known as "sand-bagging". This second scenario can wreak havoc on how advertising dollars are spent and lead to incentives paid when not truly deserved.
Weeding Out the Bias Infiltrating the Forecast
Best Practice Solution
* Lock down your re-forecast after each monthly closing. This will provide a basis for measuring accuracy over time.
* Be transparent and rate your forecasting accuracy. This will support the reliability of your forecasting and gauge your forecasting practices and methodology.
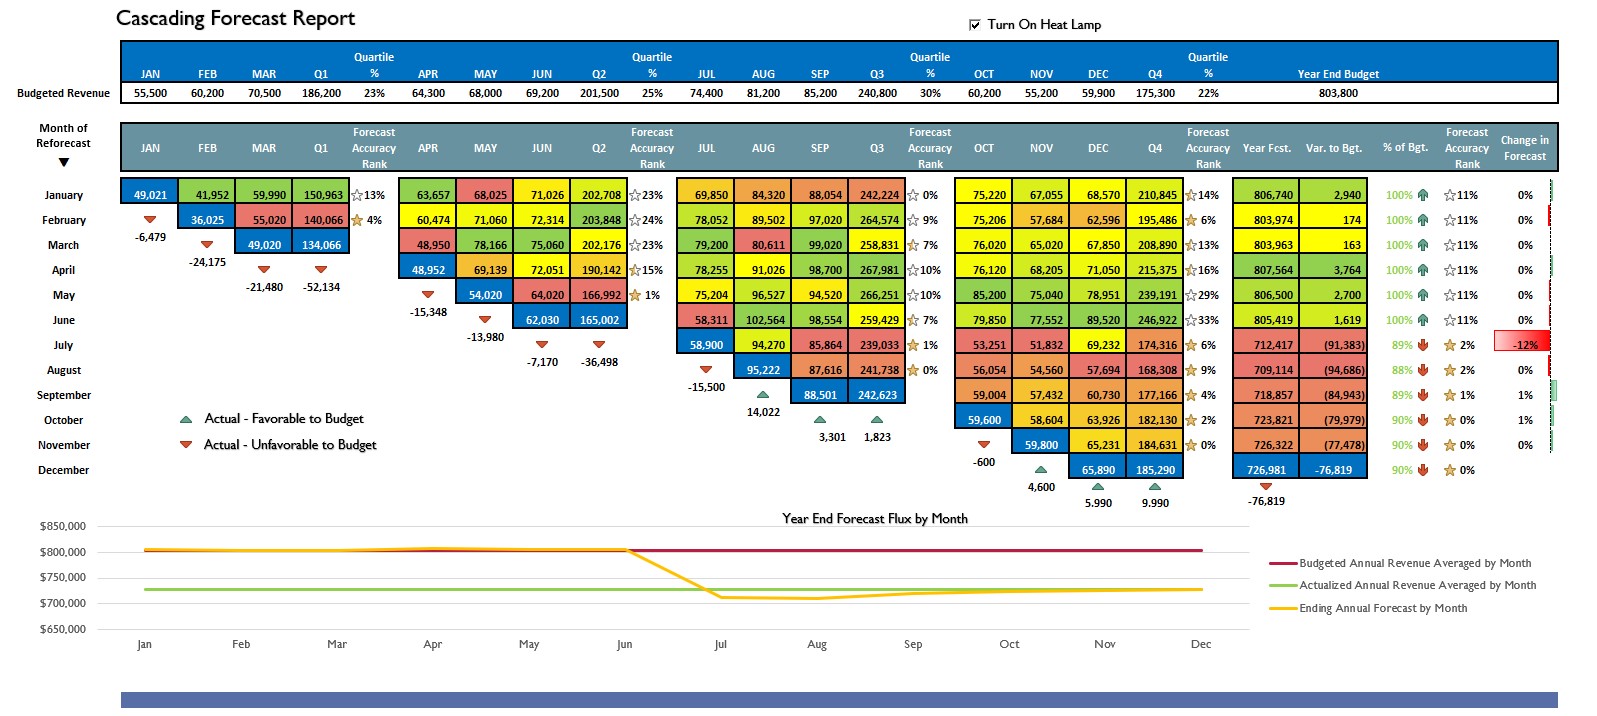
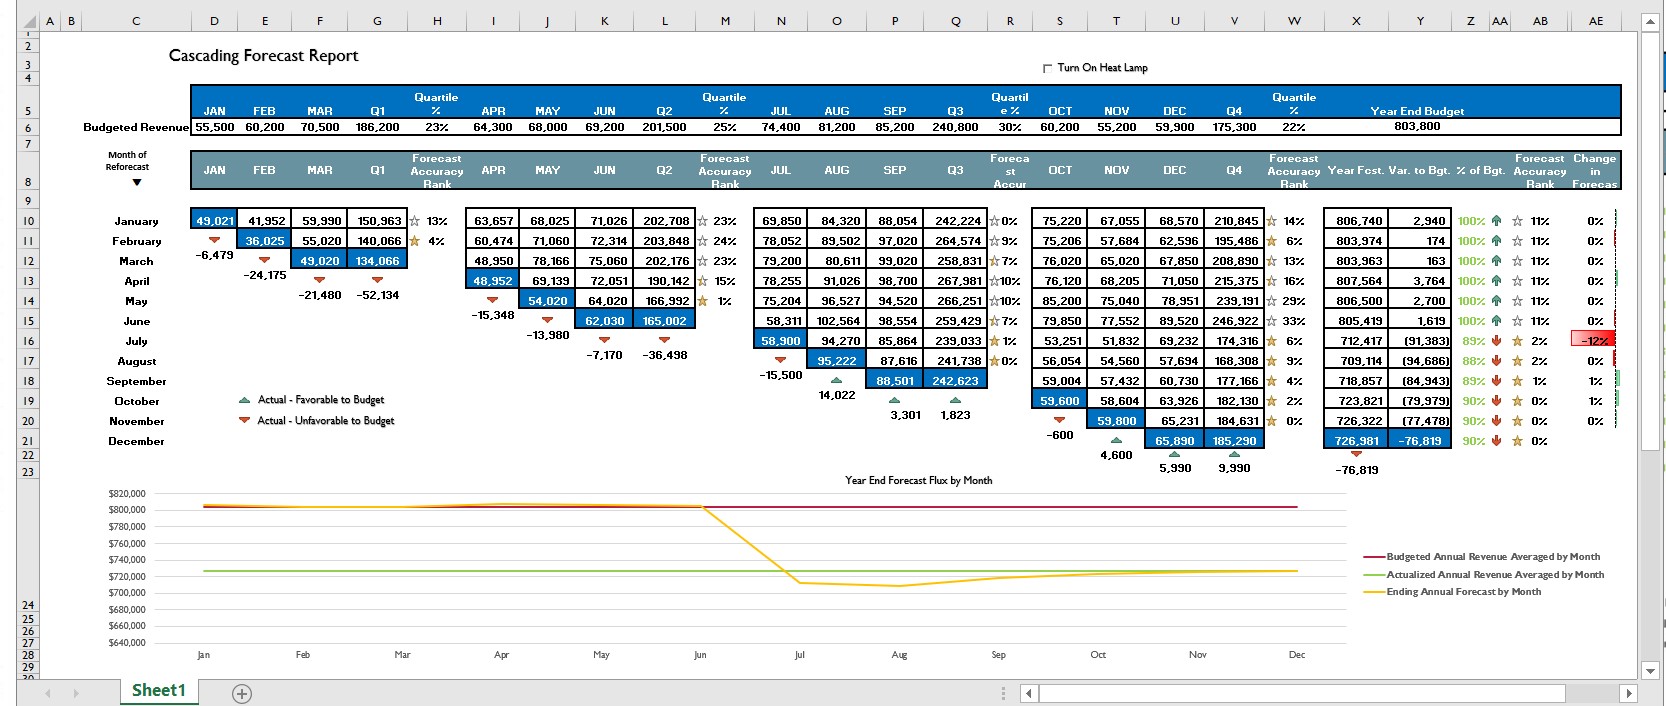
The Cascading Forecast
The Cascading Forecasting model is designed to lock each forecast and rate accuracy over time. It could just as well be called a Forecasting Accuracy Report. The variables in the example are for revenue, but any metric, EBITDA, N.O.I., etc. could be used.
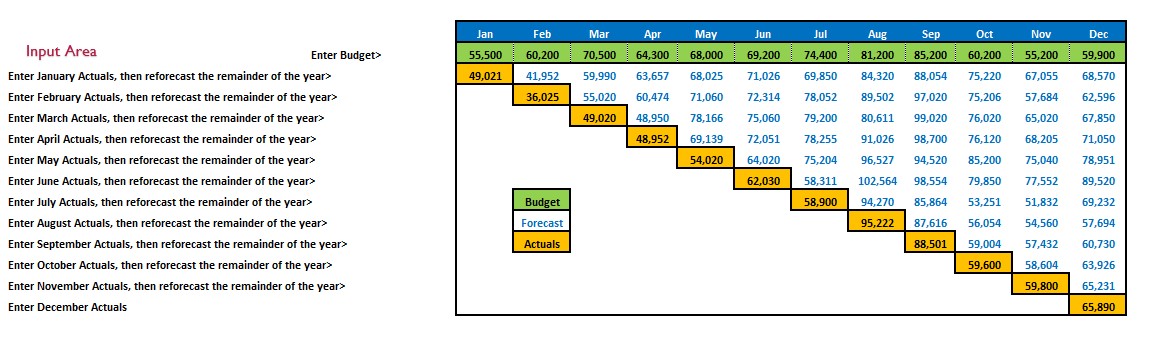
How the Cascading Forecasting works:
The Plan or Budget is entered for a 12 month cycle. After a financial month is actualized, a reforecast made for the remainder of the year. For example, once January closes, actual numbers are entered for January, while a forecast for the remainder of the year is made for February through December. Those numbers are essentially locked for analysis.
When February closes, a new row is entered this the actuals of February and a revised forecast from March through December.
The model calculates the change that is occurring to the overall year end forecast. Variances are calculated for the quarter as well.
The model analyzes forecasting accuracy. Poor forecasting leads to a delayed opportunity to pursue mitigating strategies.
Conclusion:
Analyzing your forecasting accuracy is key to improving your forecasting accuracy.
Accurate forecasting has endless benefits including:
1) Better cash flow management
2) Better target marketing
3) Improved inventory and cost management
4 ) Improved staff management
5) Higher employee and guest satisfaction.
And of course, a better bottom line. Being reactive always costs more than being proactive.
Too often, there is a tendency to be overly optimistic when forecasting. It is not much fun being the bearer of bad news, or there may be a natural bias of optimism.
I have been guilty of this. After actualizing the first few months of a new year, and seeing red to the original budget numbers, I have tweaked up revenues, or low balled expenses in the remaining months' forecast, so that the year end forecast would still be in line with budget. The thinking was that we could just make up the shortfall in later months. However, the year end forecast was becoming biased with optimism.
Once a forecast becomes overly optimistic, the complacency shortens the opportunity to initiate cost containment measures and revenue driving strategies to make up for the shortfall.
Forecasting bias can cut both ways. Just as a forecast can be embedded with too much optimism, also known as "blue-skying", there can also be bias leading to under forecasting, commonly known as "sand-bagging". This second scenario can wreak havoc on how advertising dollars are spent and lead to incentives paid when not truly deserved.
Weeding Out the Bias Infiltrating the Forecast
Best Practice Solution
* Lock down your re-forecast after each monthly closing. This will provide a basis for measuring accuracy over time.
* Be transparent and rate your forecasting accuracy. This will support the reliability of your forecasting and gauge your forecasting practices and methodology.
The Cascading Forecast
The Cascading Forecasting model is designed to lock each forecast and rate accuracy over time. It could just as well be called a Forecasting Accuracy Report. The variables in the example are for revenue, but any metric, EBITDA, N.O.I., etc. could be used.
How the Cascading Forecasting works:
The Plan or Budget is entered for a 12 month cycle. After a financial month is actualized, a reforecast made for the remainder of the year. For example, once January closes, actual numbers are entered for January, while a forecast for the remainder of the year is made for February through December. Those numbers are essentially locked for analysis.
When February closes, a new row is entered this the actuals of February and a revised forecast from March through December.
The model calculates the change that is occurring to the overall year end forecast. Variances are calculated for the quarter as well.
The model analyzes forecasting accuracy. Poor forecasting leads to a delayed opportunity to pursue mitigating strategies.
Conclusion:
Analyzing your forecasting accuracy is key to improving your forecasting accuracy.
Accurate forecasting has endless benefits including:
1) Better cash flow management
2) Better target marketing
3) Improved inventory and cost management
4 ) Improved staff management
5) Higher employee and guest satisfaction.
And of course, a better bottom line. Being reactive always costs more than being proactive.
This Best Practice includes
Excel Template
