
Originally published: 21/09/2021 11:37
Publication number: ELQ-46726-1
View all versions & Certificate
Publication number: ELQ-46726-1
View all versions & Certificate

Daycare Center Excel Financial Model
Buy our Daycare Center Excel Financial Model. Impress bankers and investors with a proven, strategic business plan.
Our mission is to be the industrial leader and pioneer in our business domainFollow 17
cash flow statementbalance sheetthree statement financial modeldashboardfinancial planfinancial analysisnet present valuedaycare center financial modelstartupfinancial projections
Description
# Daycare Center Excel Financial Model
If you want to start a daycare center or want to check its future feasibility then you need a financial model. The daycare center excel financial model will help you predict your daycare capacity and overall revenue by looking at hourly revenue per child for different age groups. The daycare center financial model also guides you to calculate staff expenses based on required caregivers per age group, and supplies cost on a per-child basis. This daycare center financial model will populate the expenses and cash flows on the financial statements for you. A user can enter your monthly expenses as either fixed amounts.
# Similar Business Model
C C Learning Center, Reliable Day Care Center, and Blaine Day Care Center
# Introduction to Daycare Center Excel Financial Model
Daycare Center Excel Financial Model Template presents the business case of a brand new start-up consultancy business with an upfront investment in a website, SEO, logo, copywriting. The model contains the three financial statements including the cash flows and calculates the relevant metrics (Sensitivity Analysis, Break-even Analysis, Diagnostic Tools, Project evaluation, and Charts).
The financing options for the project include a standard long-term loan as well as an investment made by the investors and of course marketing sheet ( include automated inbound and outbound marketing costs sheet which also contains how many customers will achieve as a result).
# Key Inputs of Daycare Center Excel Financial Model
1: The growth rate Price and Expense.
2: Average no of children per customer.
3: No of children leave per month.
4: Maximum Children at one time.
5: Average Hours children per month.
6: Open hours per month.
7: Average Payable and Receivable days your business is following.
8: Child Segmentation & hourly rate.
9: Marketing Cost.
10: Cost of per caregiver.
11: Cost of Goods.
12: Fixed Asset and Capital Expenditure.
13: Tax Rate.
14: Investment table.
# Key Features of Daycare Center Excel Financial Model
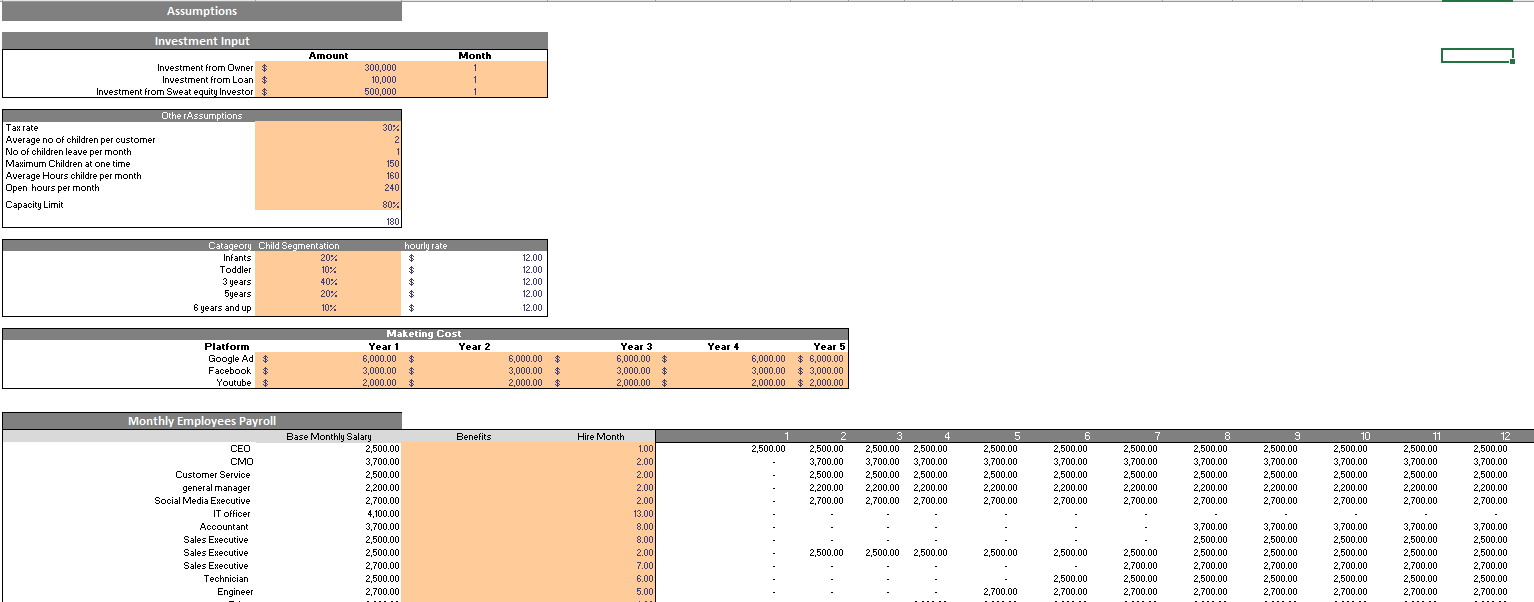
1: Input Sheet
This financial model template contains inputs that, when changed, impact the calculations and, therefore, the changes are applied to all relevant sheets. This financial model always has built-in flexibility to display different outcomes or final calculations based on this sheet’s changes.
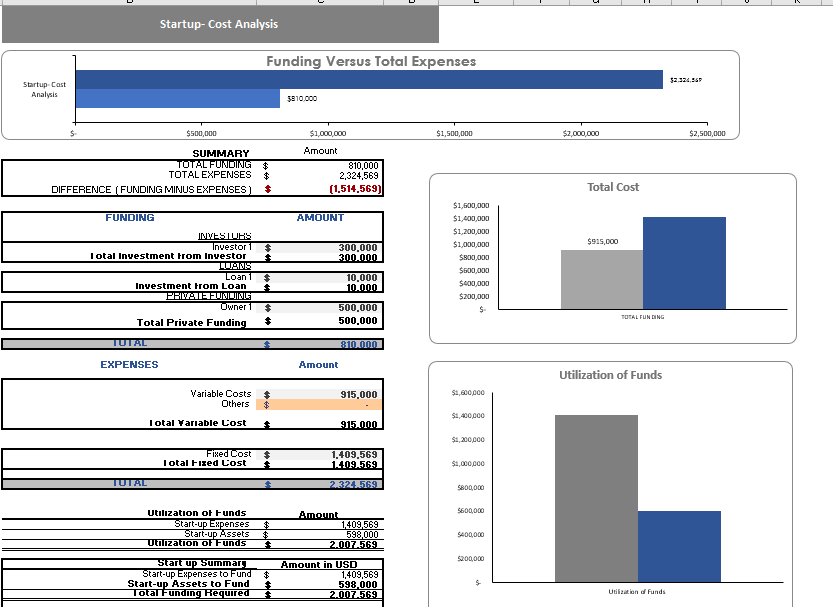
2: Startup Summary
A start-up summary tab includes the total cost incurred at the start of business and capital expenditure, how much cash injected by the company so far, and based on the number of months the amount of investment required is calculated.
A Startup Summary helps you take a realistic view of your idea and double-check whether it’s the business has enough funds to support operations.
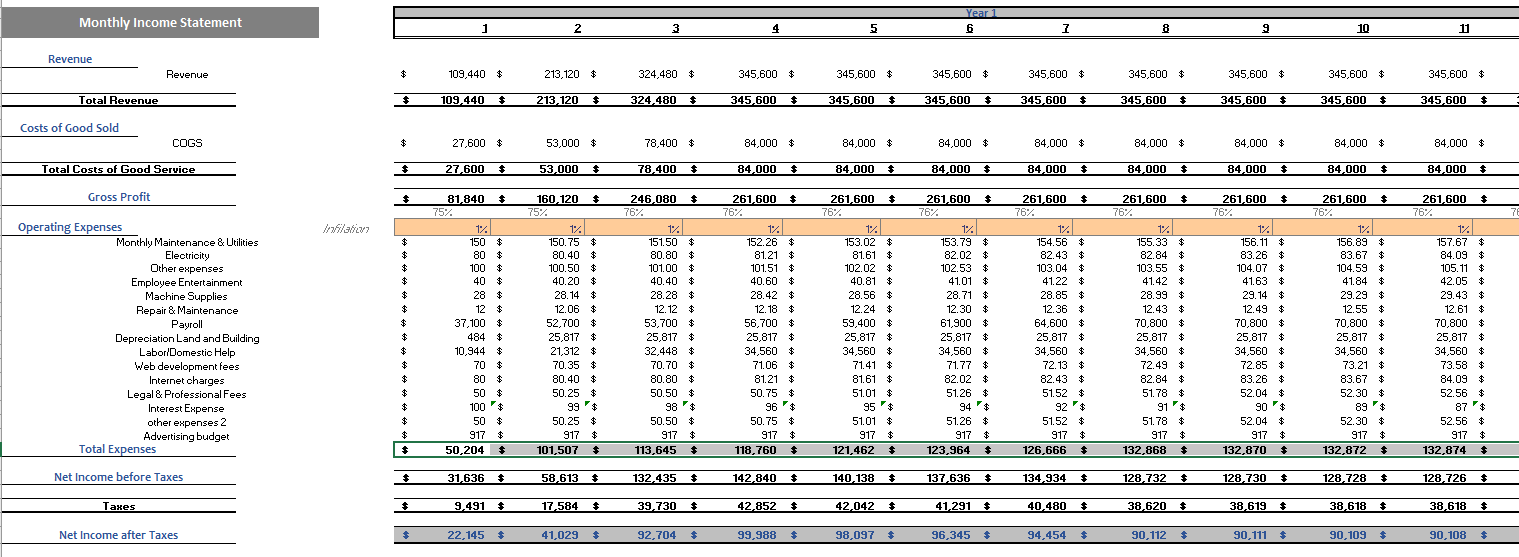
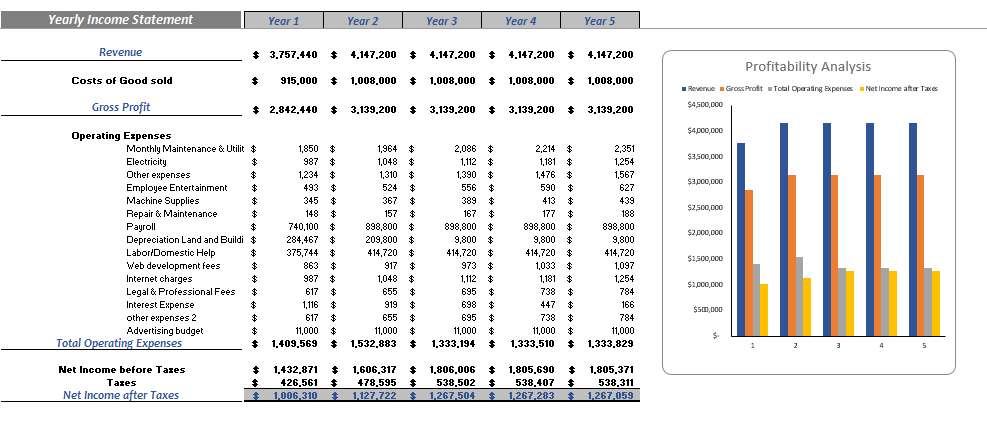
3: Monthly & Yearly Income Statement
The Daycare Center Excel Financial Model provides the monthly as well as yearly income statement structure. The framework for creating a full corporate forecasting model tailored to your particular business.
An integrated financial model is powerful since it enables the Financial Model user to change any assumption in one part of the statement to see how it impacts all other parts of the statements accurately and consistently.
The monthly Income Statement sheet of the Financial Model is perfect for those who require regular reporting and details. Additionally, Income Statement contains all revenue streamlines with gross earnings, net earnings linked with a revenue analysis sheet to ensure accurate reporting. Oak Business Consultants understands the accounting Services business’s goal. Therefore, we have developed a mechanism that helps business owners determine whether they are making profits or otherwise.
Furthermore, the Yearly Income Statement gives you complete insights into revenue and general & administrative expenses. The Yearly Income Statement also contains several graphs, assumptions, ratios, net profit, cost of services, and profit after tax.
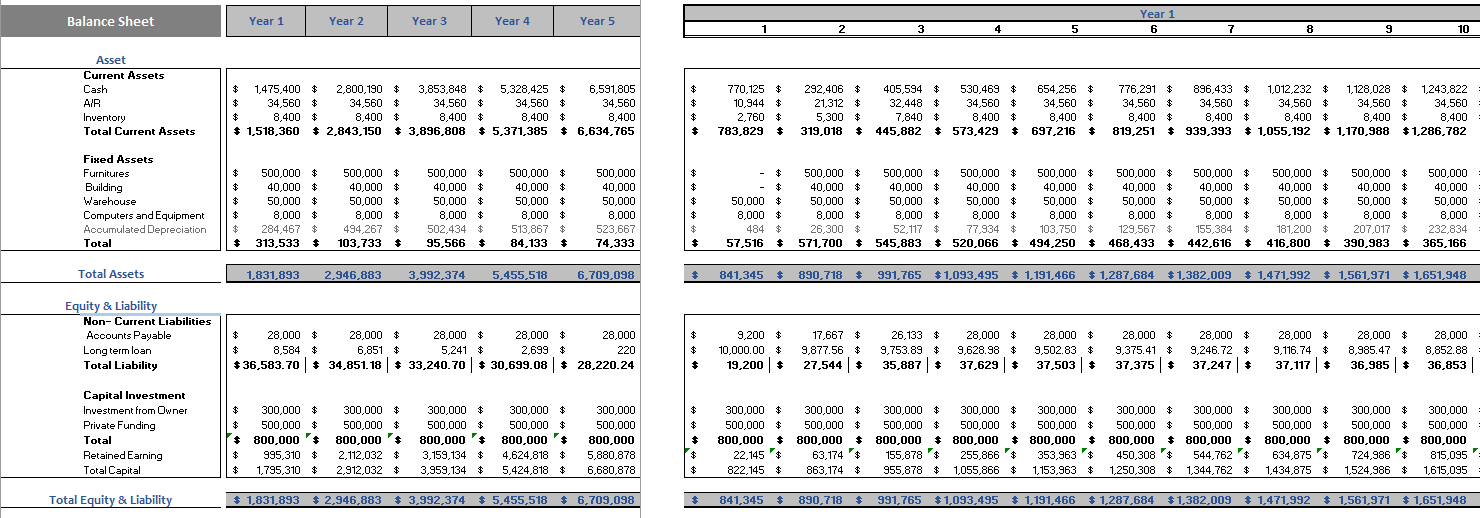
4: Balance Sheet
This balance sheet enables you to analyze your position of current assets, fixed assets, liabilities, and equity. This also allows you to monitor your accounts receivable, accounts payable, accrued expenses, etc. Therefore, this specific, financial model gives you the perfect space to analyze your key financial balance accounts.
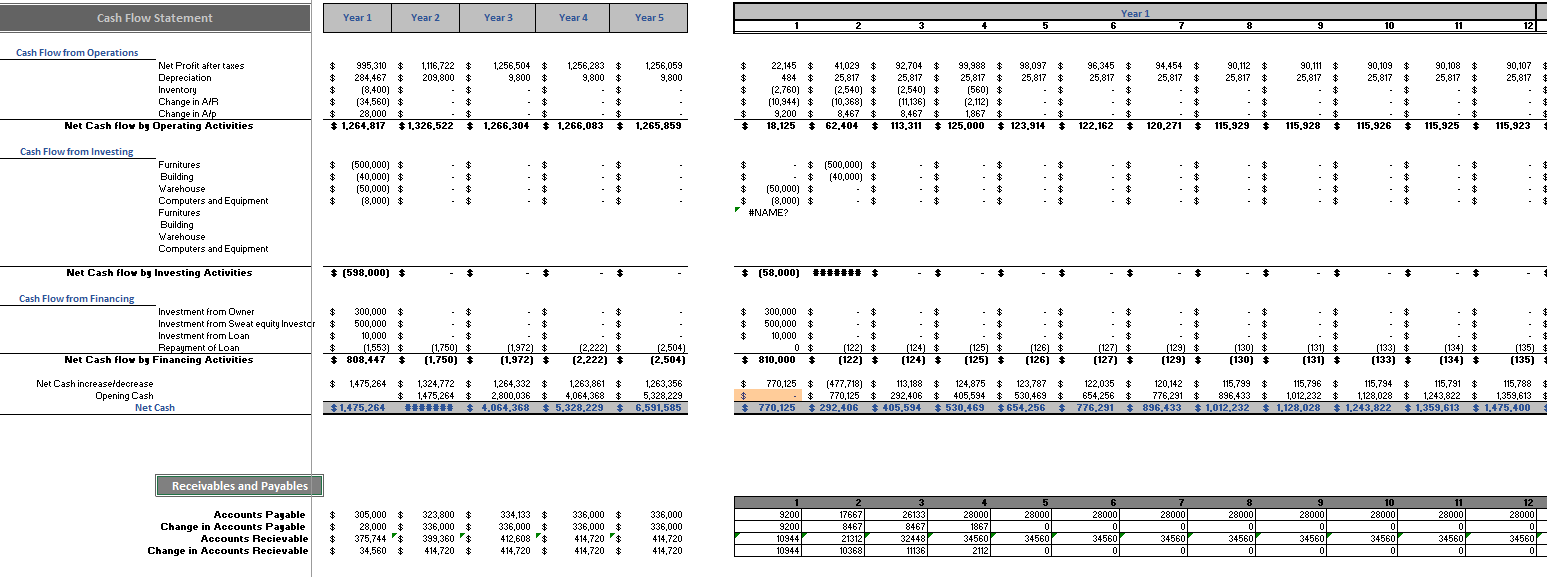
5: Cash Flow Statement
The Cash Flow Statement is the vital part of the three statements that report the cash spent and generated during a specific period. The Cash Flow Statements act as a bridge between the income statement and balance sheet by how money has moved in and out of the business.
# Three main sections of the Cash flow Statement:
1: Operating Activities: We have included all cash in and out related to the operations of the business.
2: Investing Activities: Any cash from the disposal of an asset and investments included in this section and linked to the inputs and fixed asset tab.
3: Financing Activities: We have separately made a loan-related tab where you can enter all loan-related information thee. The tab is linked to Financing Activities of Cashflow Statement
The Cashflow Statement in our Model contains a dedicated sheet to monitor and analyze your company cash-ins and out. This cash flow statement is based on several key inputs, such as Payable and Receivable Days, yearly income, working capital, long-term debt, net cash, etc. This calculation then computes your net cash flow, beginning and end cash balances. This is a perfect template for your company’s cash flow management.
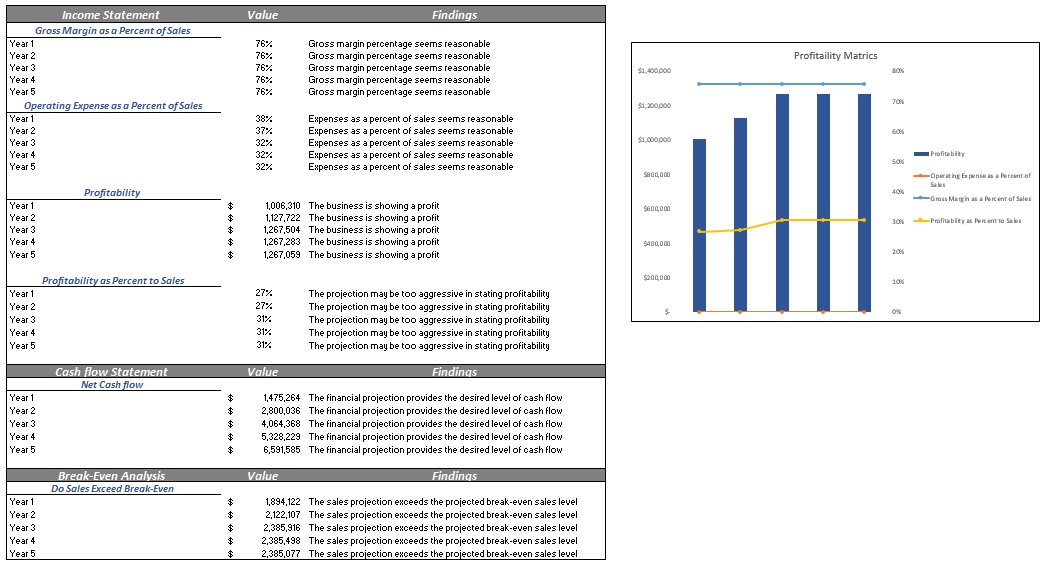
6: Diagnostic Sheet
This Diagnostic sheet is a new inclusion to our financial model. This automatically explains the condition of the business. For example, if your company’s profit is 30% of the total sales the sheet will include favorable comments. The comments are automatically connected to the numbers of financial data in the income statement, balance sheet, and Cashflow. The Diagnostic Sheet is very helpful to give the company’s insights in just one line.
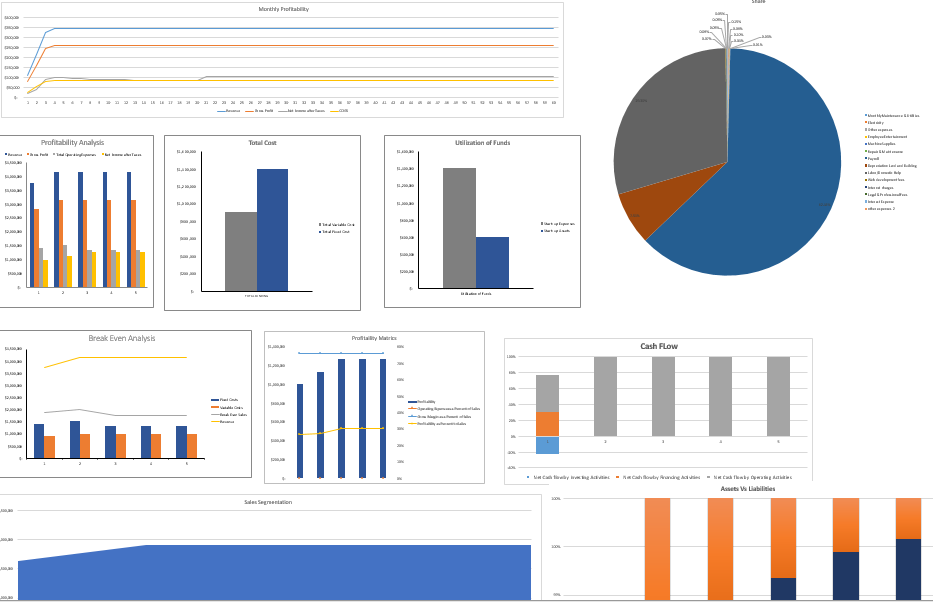
7: Dashboard
Users and readers respond and process visual graphs better than data. Furthermore, This dashboard provides you a graphical management tool that enables you to track all your relevant financial KPIs, improve cash flow management, and track expenses, sales, and net revenue in detail to meet and outperform the financial objectives of your business.
# Benefits of Daycare Center Excel Financial Model
1: Encapsulate Company Performance- The Daycare Center Excel Financial Model Template analysis simplifies a company’s financial statements. It allows the user to express critical profitability and financial position information in just a few numbers. For example, the company’s net profit margin encapsulates the net effect of a company’s revenues and all expenses. It will enable the user to conclude a company’s profitability without going through lengthy account statements.
2: Bottom Line – A Daycare Center Excel Financial Model can be the key to your company’s better and informed future. Succeeding to plan your Company’s finances well will mean overall success in making wise investment decisions, purchasing the right operating assets, control costs, and determining company valuation.
3: Accommodates Investors – This model provides valuation and performance analysis charts. It enables the investors and banks to clearly determine the company’s actual worth considering lending funds to your company.
4: Based on Financial Principles – We did in-depth research on a Courier business model. So this financial model has created with logically correct financial and economic principles and assumptions.
# How To Use Daycare Center Excel Financial Model
For the purpose of making this model easy to use, Oak Business Consultant has designed this Daycare Center Excel Financial Model with maximum care. Each cell has a color code, and the input areas are all highlighted in peach color.
The User is only required to input data in color cells. All other cells are either helping calculations or results of the model. Therefore there is no need to change any other cell except colored cells.
# Consultation:
If you are not sure about the numbers, you can hire us as your consultants. We have a pool of Financial Experts who could advise numbers like growth rate, first-year operational expenses, employee headcount, sales capacity, etc.
# Daycare Center Excel Financial Model
If you want to start a daycare center or want to check its future feasibility then you need a financial model. The daycare center excel financial model will help you predict your daycare capacity and overall revenue by looking at hourly revenue per child for different age groups. The daycare center financial model also guides you to calculate staff expenses based on required caregivers per age group, and supplies cost on a per-child basis. This daycare center financial model will populate the expenses and cash flows on the financial statements for you. A user can enter your monthly expenses as either fixed amounts.
# Similar Business Model
C C Learning Center, Reliable Day Care Center, and Blaine Day Care Center
# Introduction to Daycare Center Excel Financial Model
Daycare Center Excel Financial Model Template presents the business case of a brand new start-up consultancy business with an upfront investment in a website, SEO, logo, copywriting. The model contains the three financial statements including the cash flows and calculates the relevant metrics (Sensitivity Analysis, Break-even Analysis, Diagnostic Tools, Project evaluation, and Charts).
The financing options for the project include a standard long-term loan as well as an investment made by the investors and of course marketing sheet ( include automated inbound and outbound marketing costs sheet which also contains how many customers will achieve as a result).
# Key Inputs of Daycare Center Excel Financial Model
1: The growth rate Price and Expense.
2: Average no of children per customer.
3: No of children leave per month.
4: Maximum Children at one time.
5: Average Hours children per month.
6: Open hours per month.
7: Average Payable and Receivable days your business is following.
8: Child Segmentation & hourly rate.
9: Marketing Cost.
10: Cost of per caregiver.
11: Cost of Goods.
12: Fixed Asset and Capital Expenditure.
13: Tax Rate.
14: Investment table.
# Key Features of Daycare Center Excel Financial Model
1: Input Sheet
This financial model template contains inputs that, when changed, impact the calculations and, therefore, the changes are applied to all relevant sheets. This financial model always has built-in flexibility to display different outcomes or final calculations based on this sheet’s changes.
2: Startup Summary
A start-up summary tab includes the total cost incurred at the start of business and capital expenditure, how much cash injected by the company so far, and based on the number of months the amount of investment required is calculated.
A Startup Summary helps you take a realistic view of your idea and double-check whether it’s the business has enough funds to support operations.
3: Monthly & Yearly Income Statement
The Daycare Center Excel Financial Model provides the monthly as well as yearly income statement structure. The framework for creating a full corporate forecasting model tailored to your particular business.
An integrated financial model is powerful since it enables the Financial Model user to change any assumption in one part of the statement to see how it impacts all other parts of the statements accurately and consistently.
The monthly Income Statement sheet of the Financial Model is perfect for those who require regular reporting and details. Additionally, Income Statement contains all revenue streamlines with gross earnings, net earnings linked with a revenue analysis sheet to ensure accurate reporting. Oak Business Consultants understands the accounting Services business’s goal. Therefore, we have developed a mechanism that helps business owners determine whether they are making profits or otherwise.
Furthermore, the Yearly Income Statement gives you complete insights into revenue and general & administrative expenses. The Yearly Income Statement also contains several graphs, assumptions, ratios, net profit, cost of services, and profit after tax.
4: Balance Sheet
This balance sheet enables you to analyze your position of current assets, fixed assets, liabilities, and equity. This also allows you to monitor your accounts receivable, accounts payable, accrued expenses, etc. Therefore, this specific, financial model gives you the perfect space to analyze your key financial balance accounts.
5: Cash Flow Statement
The Cash Flow Statement is the vital part of the three statements that report the cash spent and generated during a specific period. The Cash Flow Statements act as a bridge between the income statement and balance sheet by how money has moved in and out of the business.
# Three main sections of the Cash flow Statement:
1: Operating Activities: We have included all cash in and out related to the operations of the business.
2: Investing Activities: Any cash from the disposal of an asset and investments included in this section and linked to the inputs and fixed asset tab.
3: Financing Activities: We have separately made a loan-related tab where you can enter all loan-related information thee. The tab is linked to Financing Activities of Cashflow Statement
The Cashflow Statement in our Model contains a dedicated sheet to monitor and analyze your company cash-ins and out. This cash flow statement is based on several key inputs, such as Payable and Receivable Days, yearly income, working capital, long-term debt, net cash, etc. This calculation then computes your net cash flow, beginning and end cash balances. This is a perfect template for your company’s cash flow management.
6: Diagnostic Sheet
This Diagnostic sheet is a new inclusion to our financial model. This automatically explains the condition of the business. For example, if your company’s profit is 30% of the total sales the sheet will include favorable comments. The comments are automatically connected to the numbers of financial data in the income statement, balance sheet, and Cashflow. The Diagnostic Sheet is very helpful to give the company’s insights in just one line.
7: Dashboard
Users and readers respond and process visual graphs better than data. Furthermore, This dashboard provides you a graphical management tool that enables you to track all your relevant financial KPIs, improve cash flow management, and track expenses, sales, and net revenue in detail to meet and outperform the financial objectives of your business.
# Benefits of Daycare Center Excel Financial Model
1: Encapsulate Company Performance- The Daycare Center Excel Financial Model Template analysis simplifies a company’s financial statements. It allows the user to express critical profitability and financial position information in just a few numbers. For example, the company’s net profit margin encapsulates the net effect of a company’s revenues and all expenses. It will enable the user to conclude a company’s profitability without going through lengthy account statements.
2: Bottom Line – A Daycare Center Excel Financial Model can be the key to your company’s better and informed future. Succeeding to plan your Company’s finances well will mean overall success in making wise investment decisions, purchasing the right operating assets, control costs, and determining company valuation.
3: Accommodates Investors – This model provides valuation and performance analysis charts. It enables the investors and banks to clearly determine the company’s actual worth considering lending funds to your company.
4: Based on Financial Principles – We did in-depth research on a Courier business model. So this financial model has created with logically correct financial and economic principles and assumptions.
# How To Use Daycare Center Excel Financial Model
For the purpose of making this model easy to use, Oak Business Consultant has designed this Daycare Center Excel Financial Model with maximum care. Each cell has a color code, and the input areas are all highlighted in peach color.
The User is only required to input data in color cells. All other cells are either helping calculations or results of the model. Therefore there is no need to change any other cell except colored cells.
# Consultation:
If you are not sure about the numbers, you can hire us as your consultants. We have a pool of Financial Experts who could advise numbers like growth rate, first-year operational expenses, employee headcount, sales capacity, etc.
This Best Practice includes
Excel File
