Originally published: 02/08/2016 09:01
Publication number: ELQ-91363-1
View all versions & Certificate
Publication number: ELQ-91363-1
View all versions & Certificate

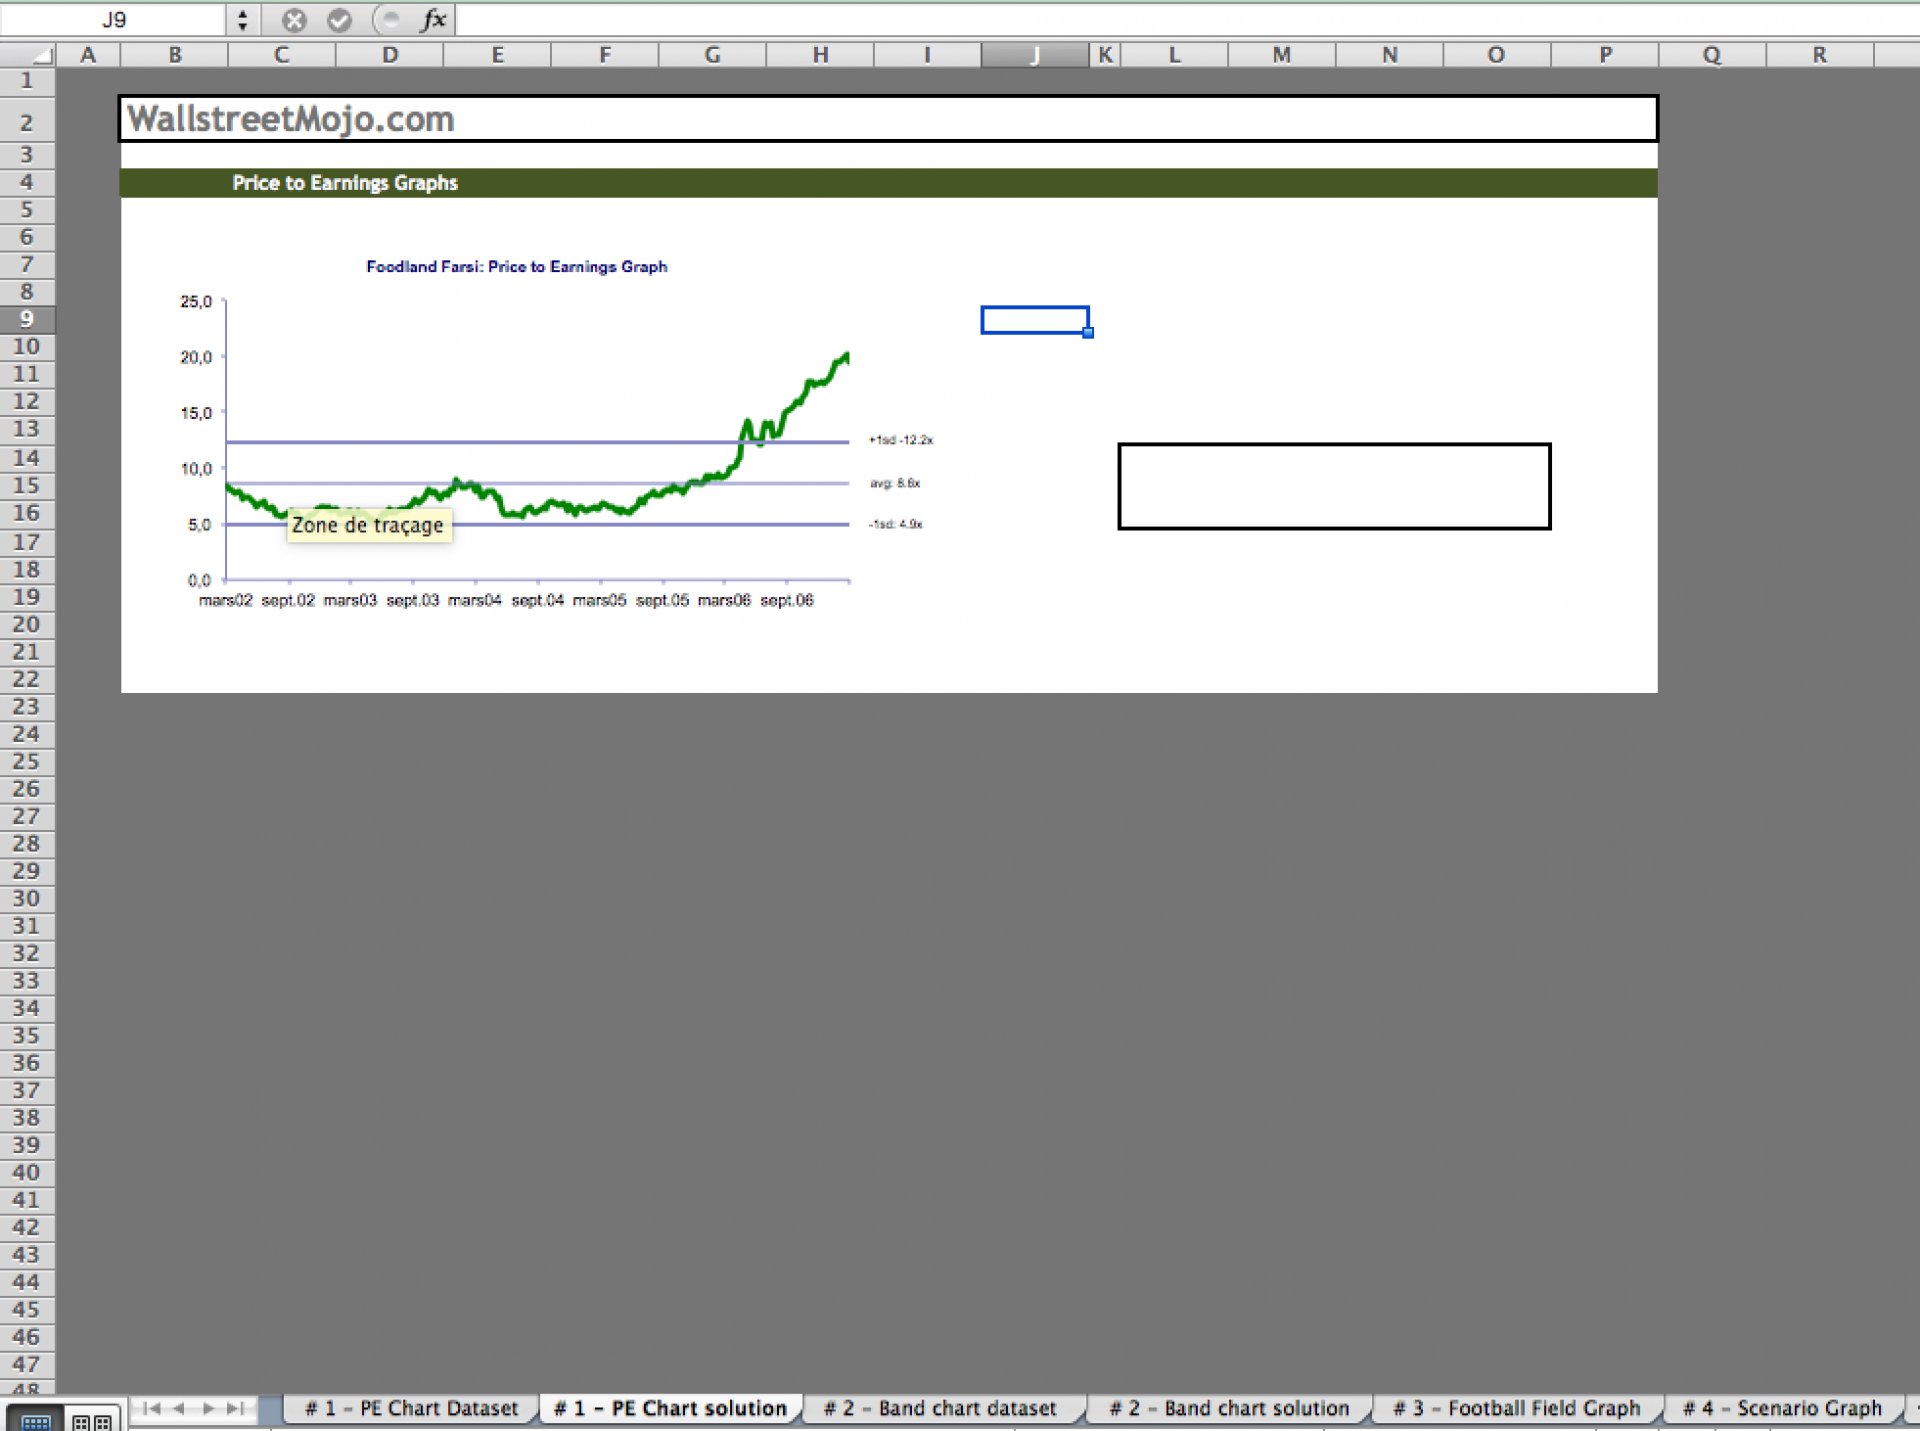
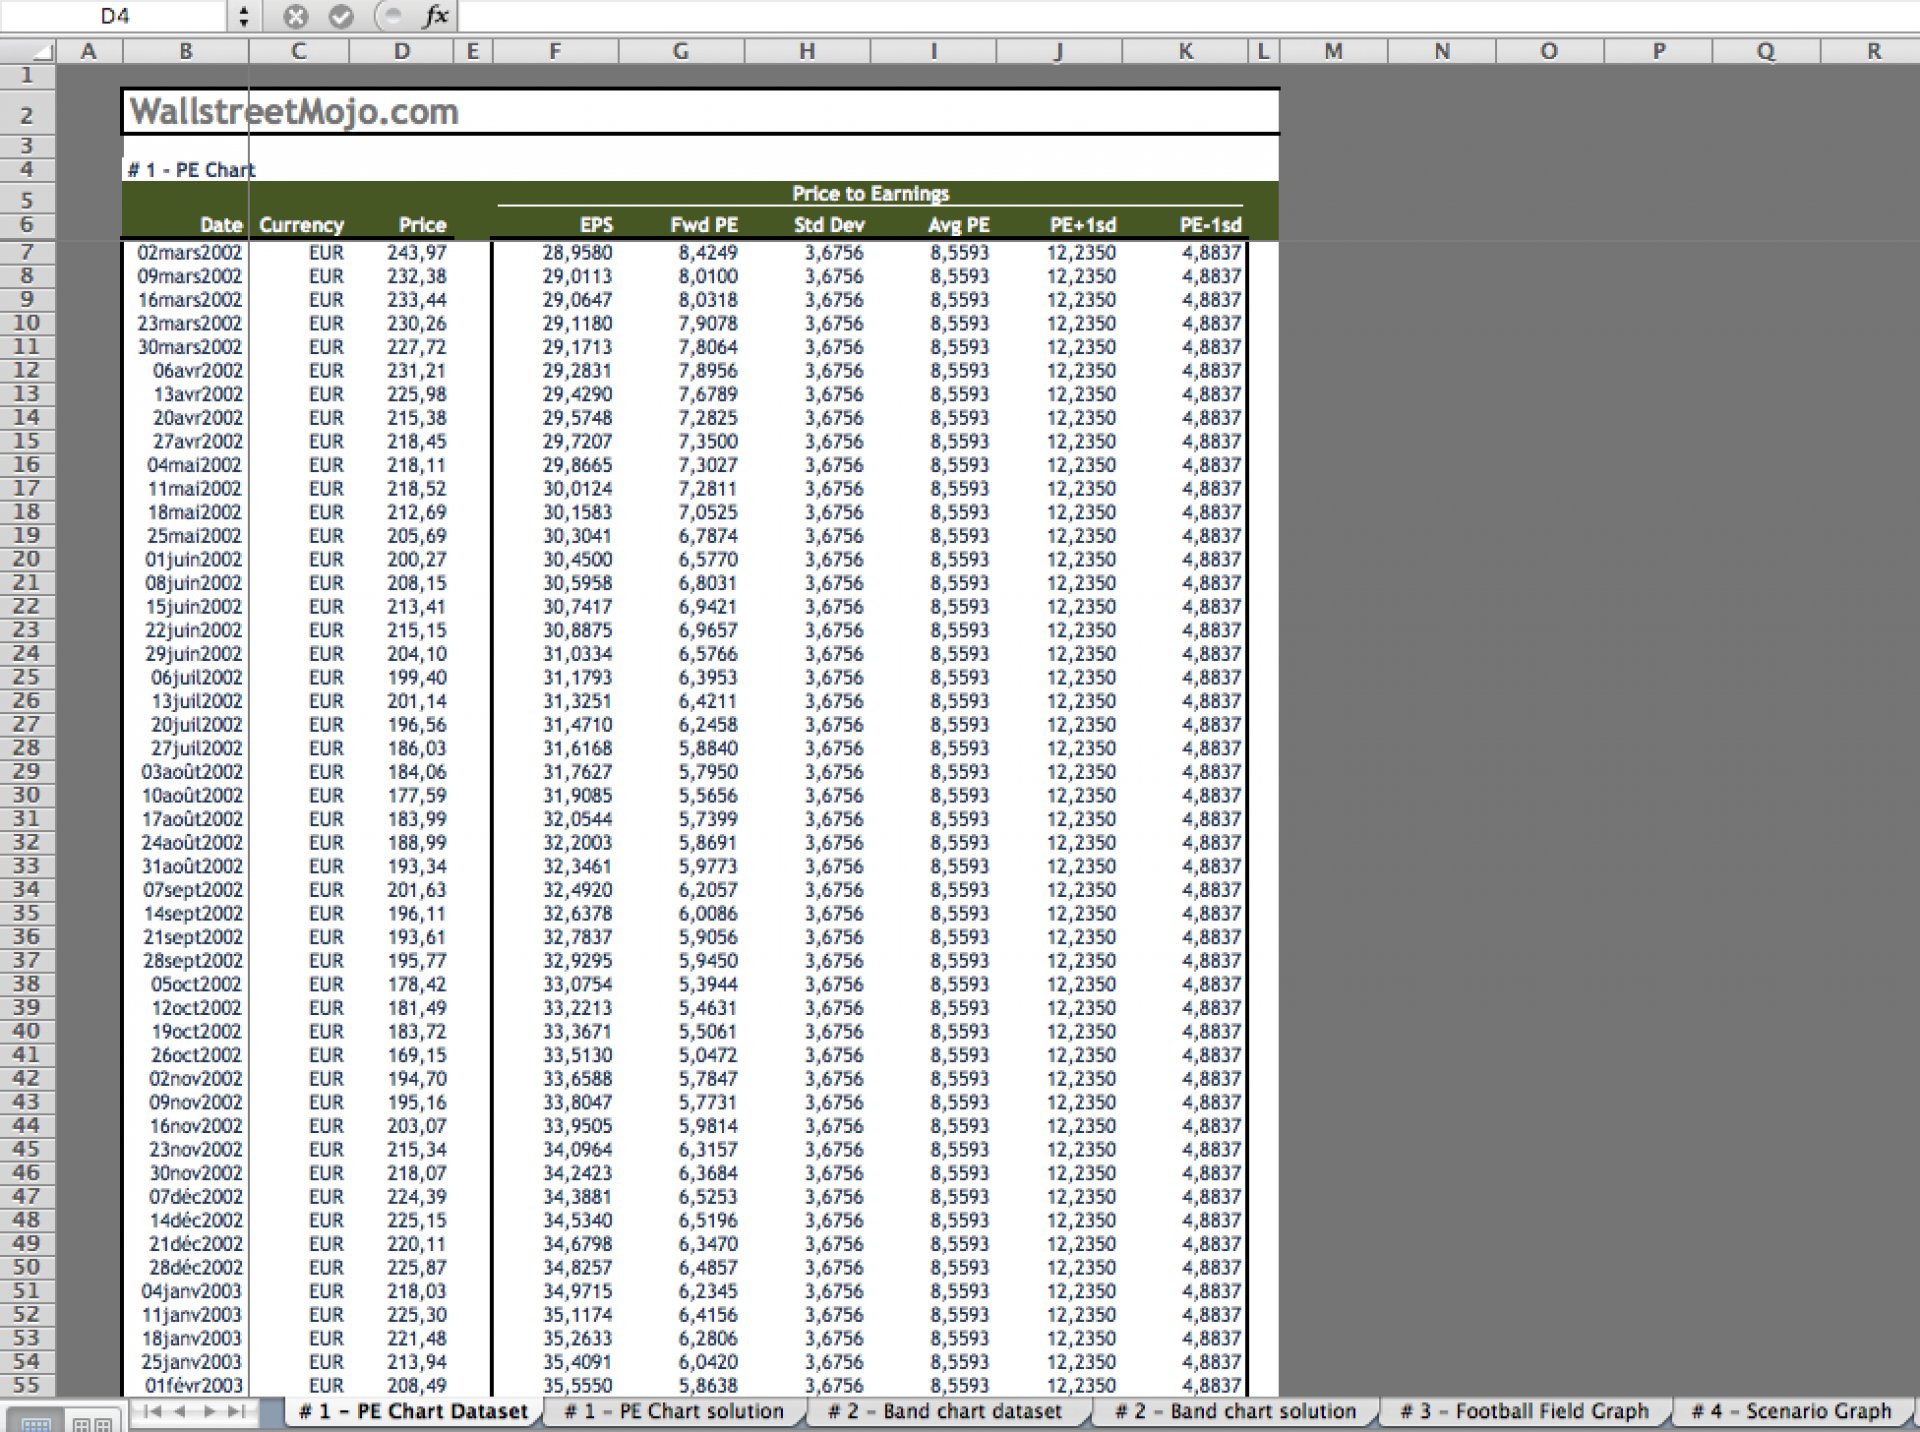
Private Equity Chart Template
Visualize the Valuation multiple of Stock or Index over a period of time.
Dheeraj Vaidya CFA FRM offers you this Best Practice for free!
download for free
Add to bookmarks
