Supplier Insights
Originally published: 29/03/2021 13:52
Publication number: ELQ-65963-1
View all versions & Certificate
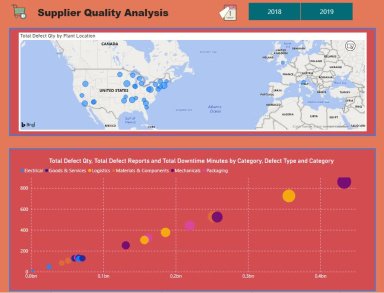
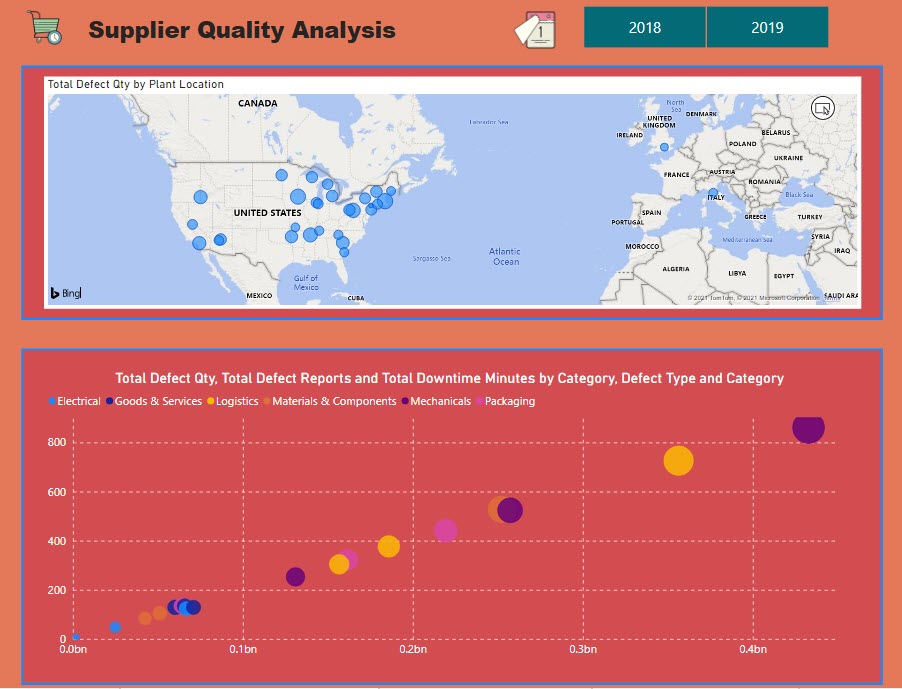
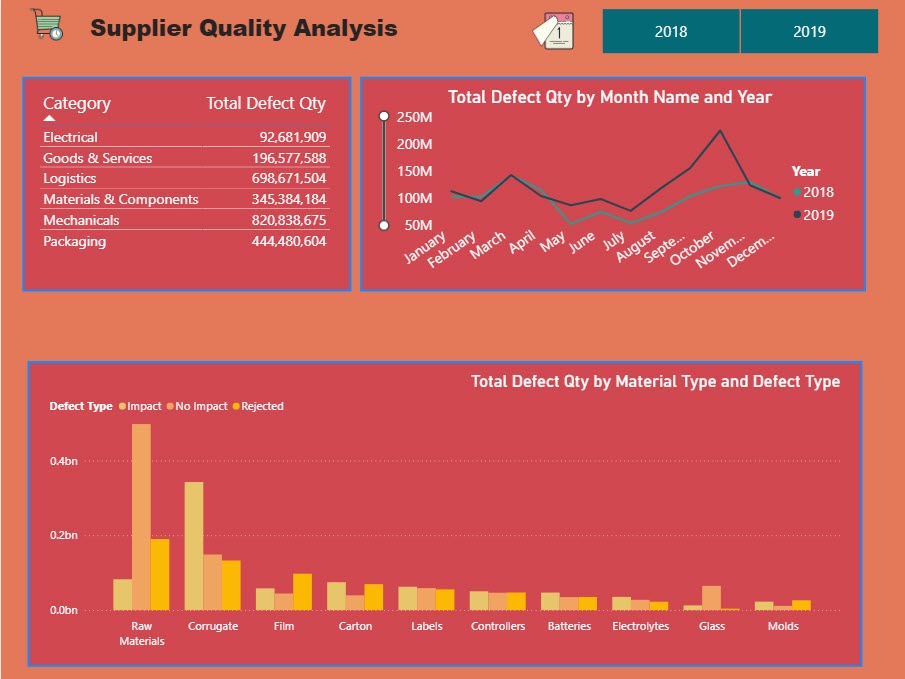
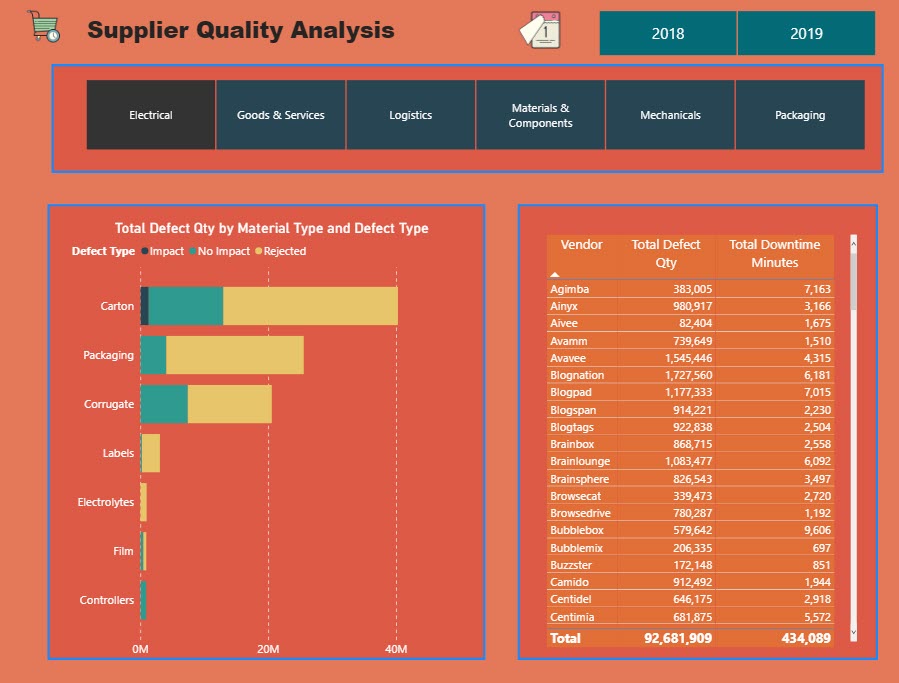
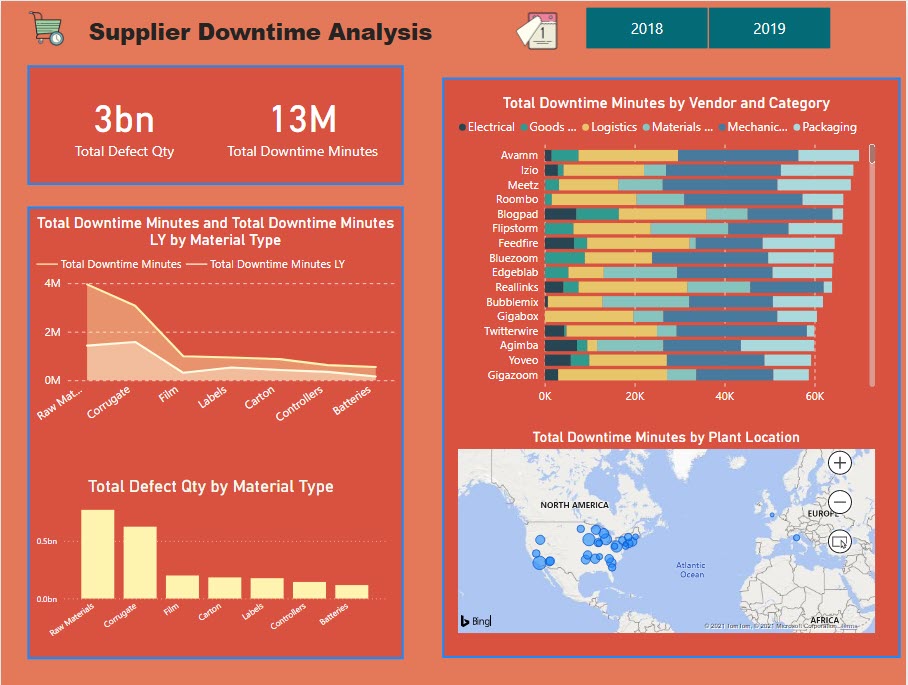
certified

Supplier Insights

Supplier Insights in Power BI - to download.

Description
This report is consisted of four pages.

1-Supplier Quality Metrics

2-Supplier Quality Regional

3-Top - Bottom Analysis

4-Downtime Analysis

Seven measures are written in this report.

On the Supplier Quality Metrics Page, the Total Number of Defects by Category is given in a Table, the Total Number of Defects by Month and Year is given in a Line Chart, and the
Total Number of Defects according to the Types of Defect and Material is given as Bars.
It is possible to filter the information on this page according to years.

On the Supplier Quality Regional Page, the Total Defect Product information according to the allocation of the factories is included in the Bar Chart.

At the same time, Total Number of Defects, Defect Reports and Total Downtime Minutes information are included in the form of Scatter Chart by Category and Defect types.

It is possible to filter the information on this page according to Years.

On the Top - Bottom Analysis Page, the Total Number of Defects in the form of Bar Charts according to the Material and Defect Types.

At the same time, the Total Defect Numbers and Total Downtime Minutes by Vendors are presented in table form.

On this page, it is possible to filter according to the following categories besides the years:

Electrical

Goods & Services

Logistics

Materials & Components

Mechanics

Packaging

It is possible to find information such as Total Defect Quantities and Total Downtime Minutes in the form of Card on the Downtime Analysis page.

Total Downtime Minutes according to Material types are shown in the form of Area Chart according to both Current Year and Previous Year information.

Total Defect information according to Material Types is included in the form of Bar Charts.

Finally, on this page, Total Downtime Minutes by Category and Vendors and Total
Downtime Minutes by Plant Location are shown in the forms of Bar and Map.

While preparing this report, I have applied what I learned from the Enterprise DNA portal.

Good luck...

This Best Practice includes
One Power BI Report, One Excel File

Acquire business license for $5.00

Add to cart

Add to bookmarks

Discuss

Further information

Users who deal with Supplier Analysis

Intermediate Level Power BI Users

Beginner Level Power BI Users


5.0 / 5 (2 votes)

please wait...