

Psychedelic Medicine rNPV Financial Model – Clinical Pipeline, Therapy Economics, Commercial Forecast & Valuation
Originally published: 31/08/2026 08:17
Publication number: ELQ-58385-1
View all versions & Certificate
certified

Psychedelic Medicine rNPV Financial Model – Clinical Pipeline, Therapy Economics, Commercial Forecast & Valuation

Value psychedelic drug pipelines with phase PoS, therapy economics, commercialization, scenarios, sensitivities, DCF, and program-level rNPV.

Description

🧠 PSYCHEDELIC MEDICINE PIPELINE, COMMERCIALIZATION & VALUATION—CONNECTED IN ONE MODEL

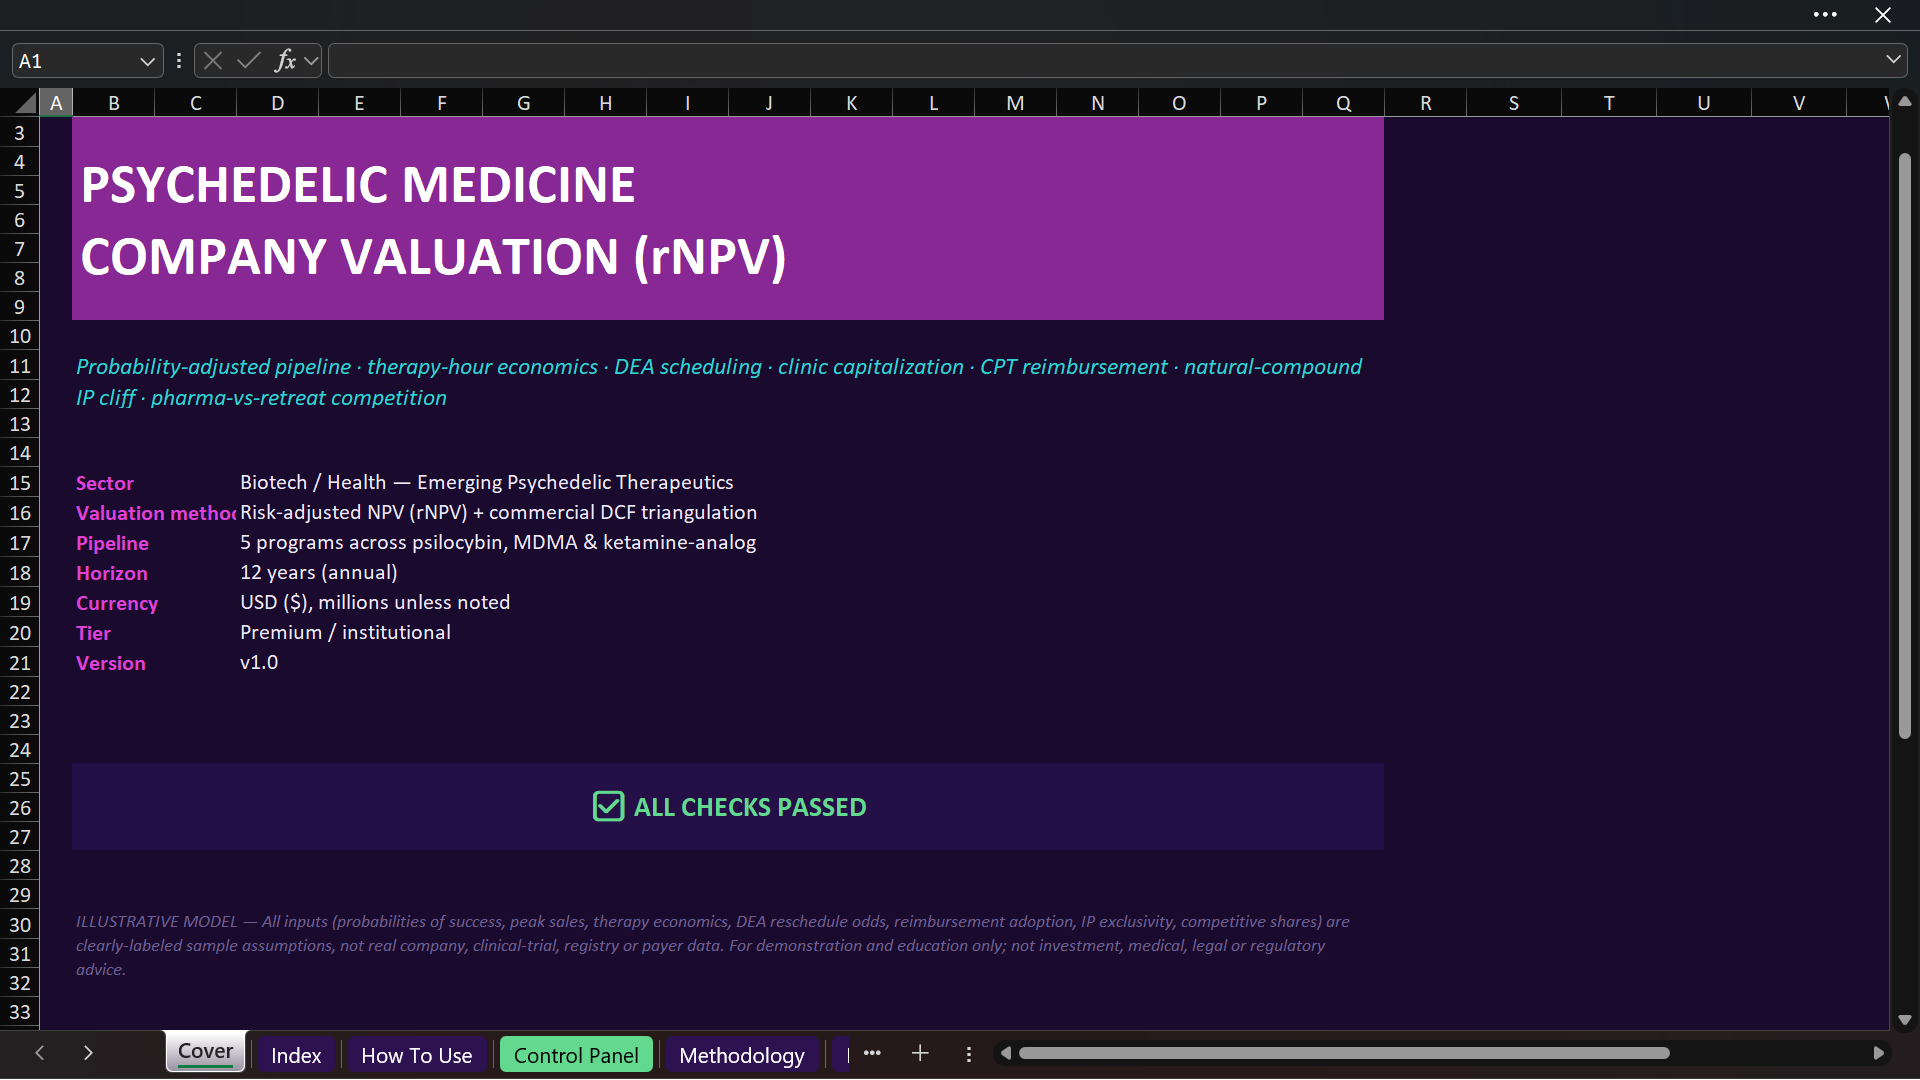
The Psychedelic Medicine rNPV Model is a 32-sheet Excel workbook designed to evaluate an emerging psychedelic-therapeutics company across clinical development, regulatory and scheduling uncertainty, therapy delivery, patient adoption, clinic capacity, reimbursement, intellectual property, competition, financial performance, funding, and valuation.

The model combines two complementary valuation approaches: a program-by-program risk-adjusted net present value (rNPV) and a consolidated commercial discounted cash flow. It then triangulates both views into a blended valuation while preserving visibility into each pipeline program, its current phase, cumulative probability of success, launch timing, peak-sales assumption, development cost, exclusivity period, and discounted contribution.

Psychedelic-assisted therapy has a distinctive commercial structure: monitored dosing, therapist staffing, preparation and integration, clinic throughput, training, scheduling controls, payer adoption, and alternative delivery models. The workbook brings these drivers into the same architecture as the clinical pipeline and valuation.

It is built for biotech founders, finance teams, investors, consultants, and analysts preparing business plans, fundraising cases, feasibility assessments, portfolio reviews, licensing discussions, or investment analysis. All editable assumptions are centralized on one Control Panel.

🎯 WHAT THIS MODEL HELPS YOU ANSWER
• What is each development program worth after adjusting for clinical probability, timing, development cost, and discounting?
• How does portfolio value change when probability of success or peak-sales expectations move?
• Which programs create the greatest share of risk-adjusted pipeline value?
• How do breakthrough-designation assumptions affect probability and launch timing?
• What value is exposed to regulatory scheduling or reclassification uncertainty?
• How do dosing duration, therapist staffing, preparation, integration, drug cost, and facility cost affect course economics?
• Can the clinic network and therapist base support expected patient demand?
• How do cash-pay and payer-reimbursed pricing combine as reimbursement adoption increases?
• What happens to price and volume after the assumed exclusivity period?
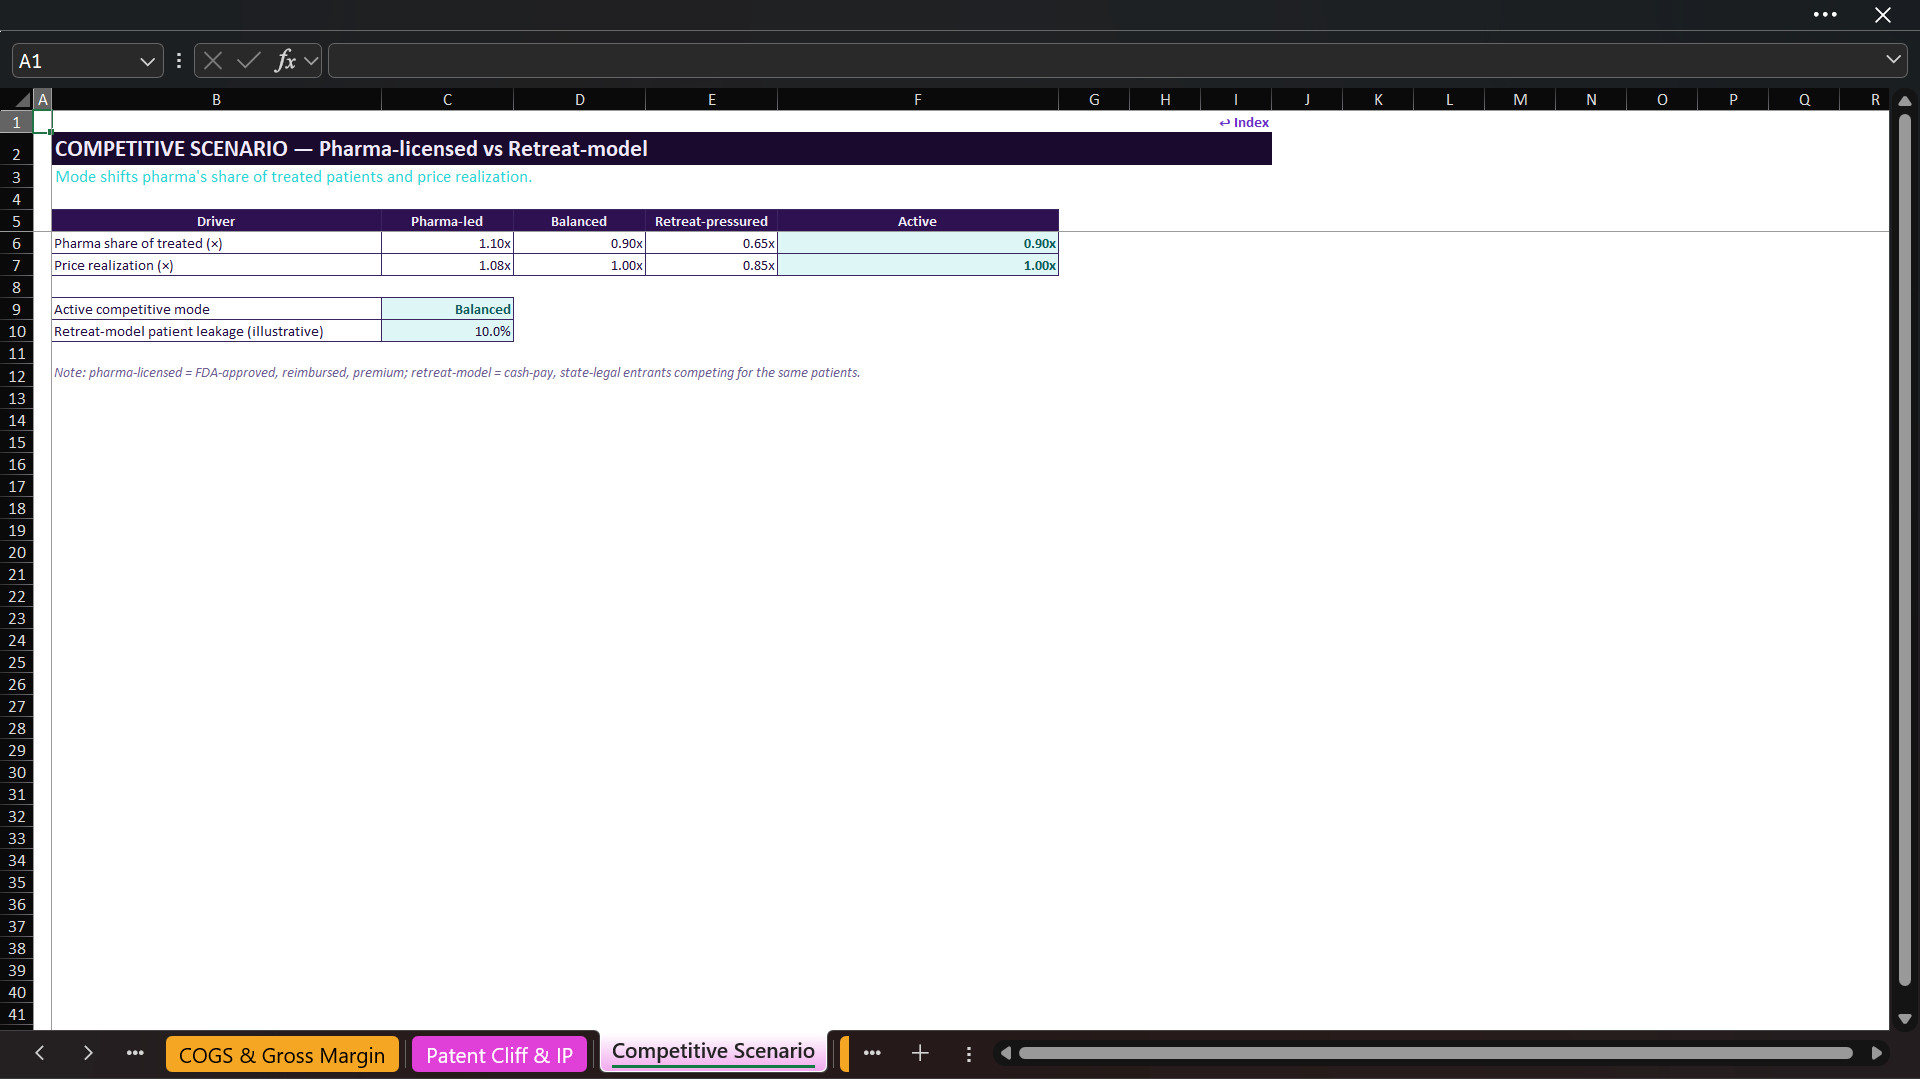
• How does a pharmaceutical-led, balanced, or retreat-pressured competitive environment affect share and price realization?
• What revenue, EBIT, free cash flow, peak funding need, enterprise value, and project IRR result from the selected assumptions?
• Which commercial, clinical, regulatory, and valuation assumptions have the largest impact on value?

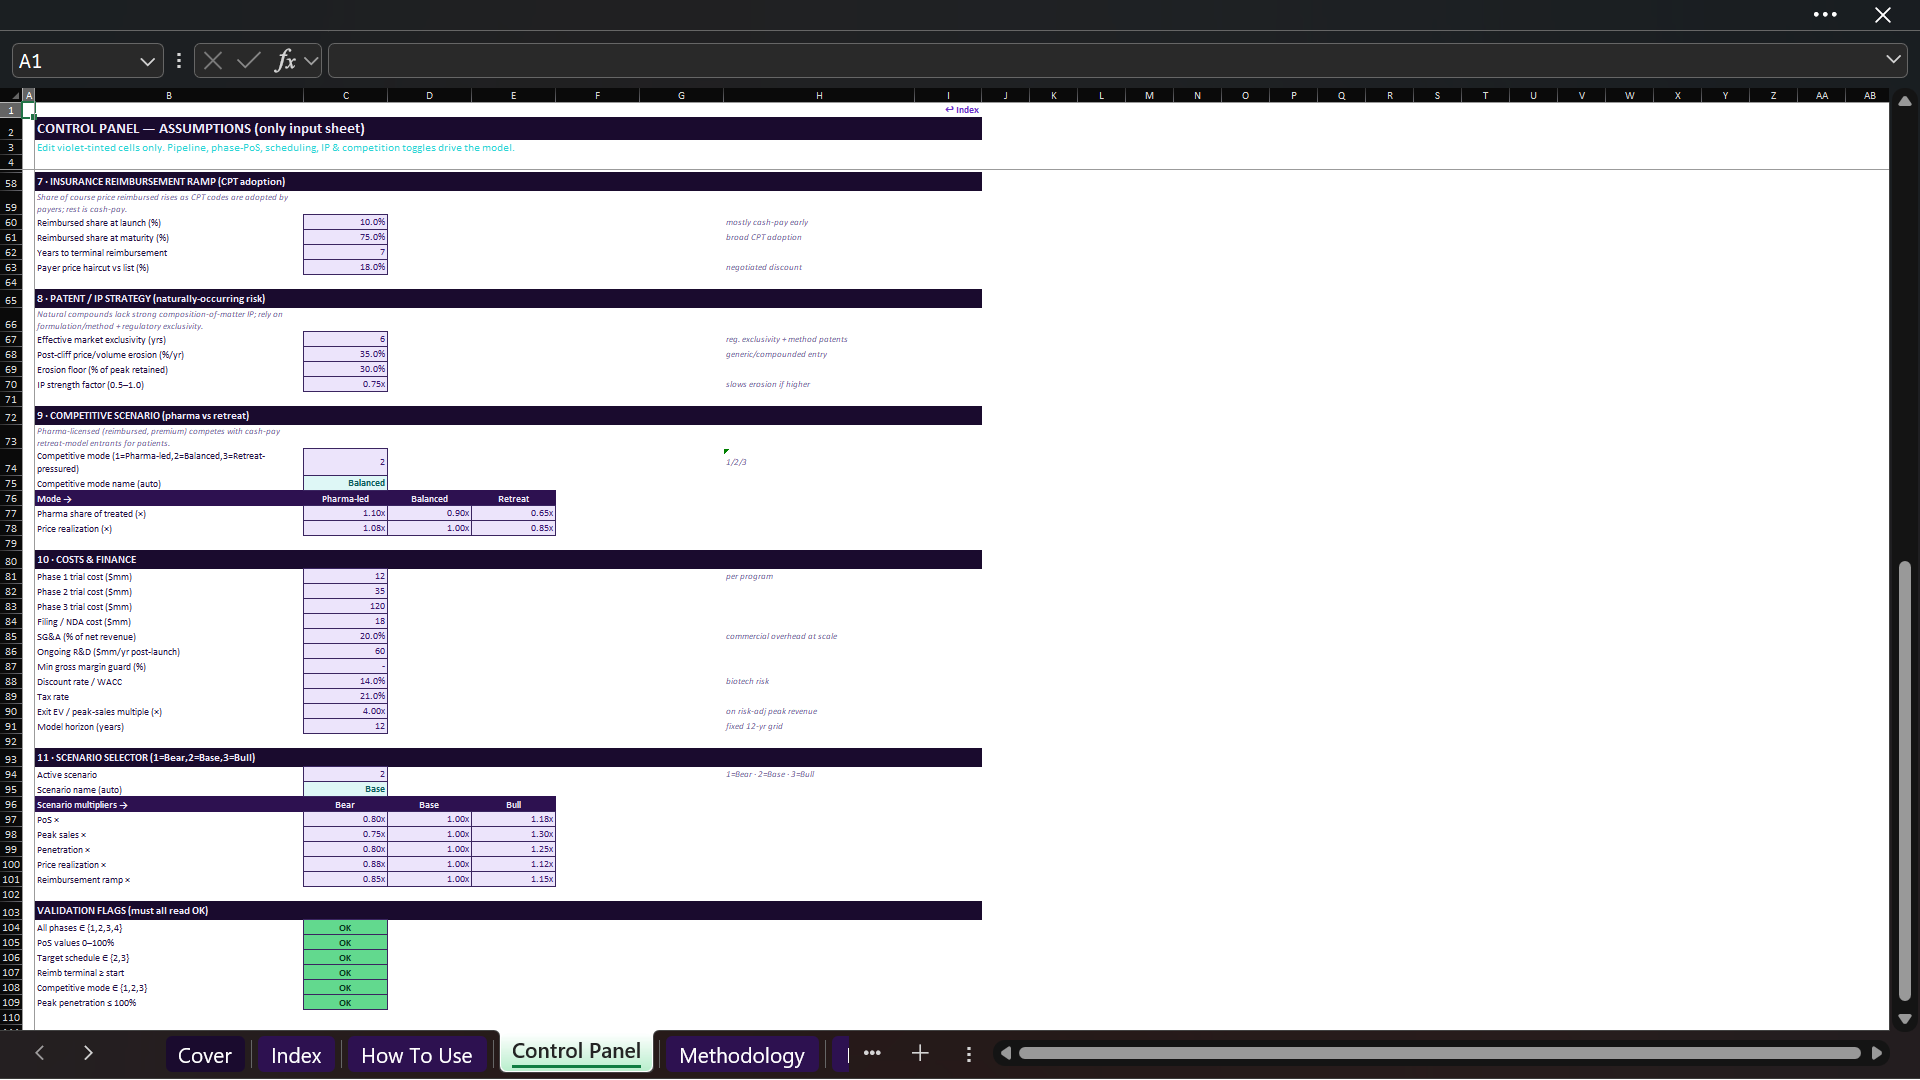
🎛️ ONE CENTRAL CONTROL PANEL
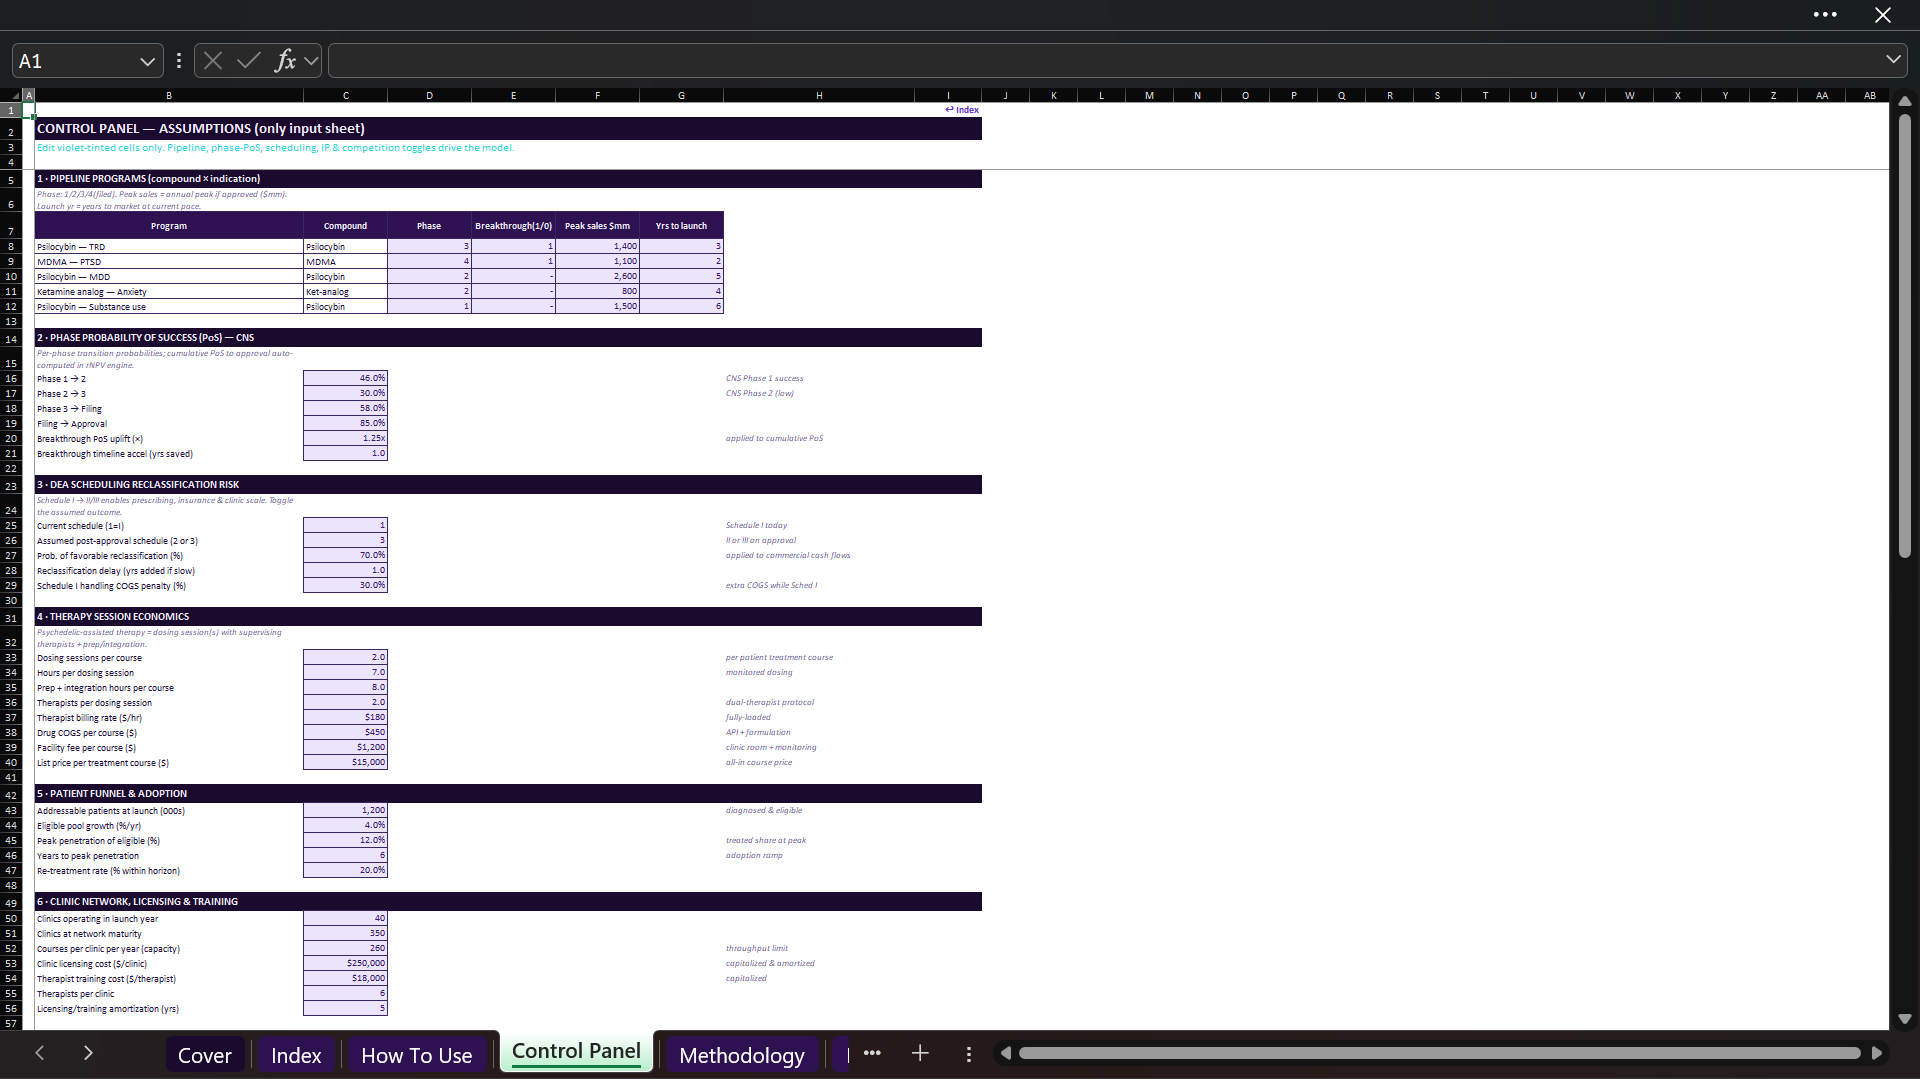
The Control Panel is the only input sheet. Violet-tinted cells identify the assumptions that may be edited, while the remaining sheets update automatically. Inputs are grouped into 11 practical sections:
• Pipeline programs by compound, indication, phase, breakthrough status, peak sales, and launch timing
• Phase-transition probabilities and breakthrough uplift
• Scheduling reclassification probability, timing, and handling-cost effect
• Therapy-session structure and cost per treatment course
• Patient eligibility, adoption, penetration, and re-treatment
• Clinic rollout, throughput, licensing, and therapist training
• Insurance reimbursement adoption and payer pricing
• Effective exclusivity, post-cliff erosion, and IP strength
• Pharmaceutical-versus-retreat competitive positioning
• Clinical-development costs, SG&A, R&D, WACC, tax, and exit multiple
• Bear, Base, and Bull scenario multipliers
Validation flags test important input boundaries, including pipeline phases, probability values, scheduling choice, reimbursement assumptions, competitive mode, penetration, and scenario selection.

🧪 FIVE-PROGRAM PIPELINE FRAMEWORK
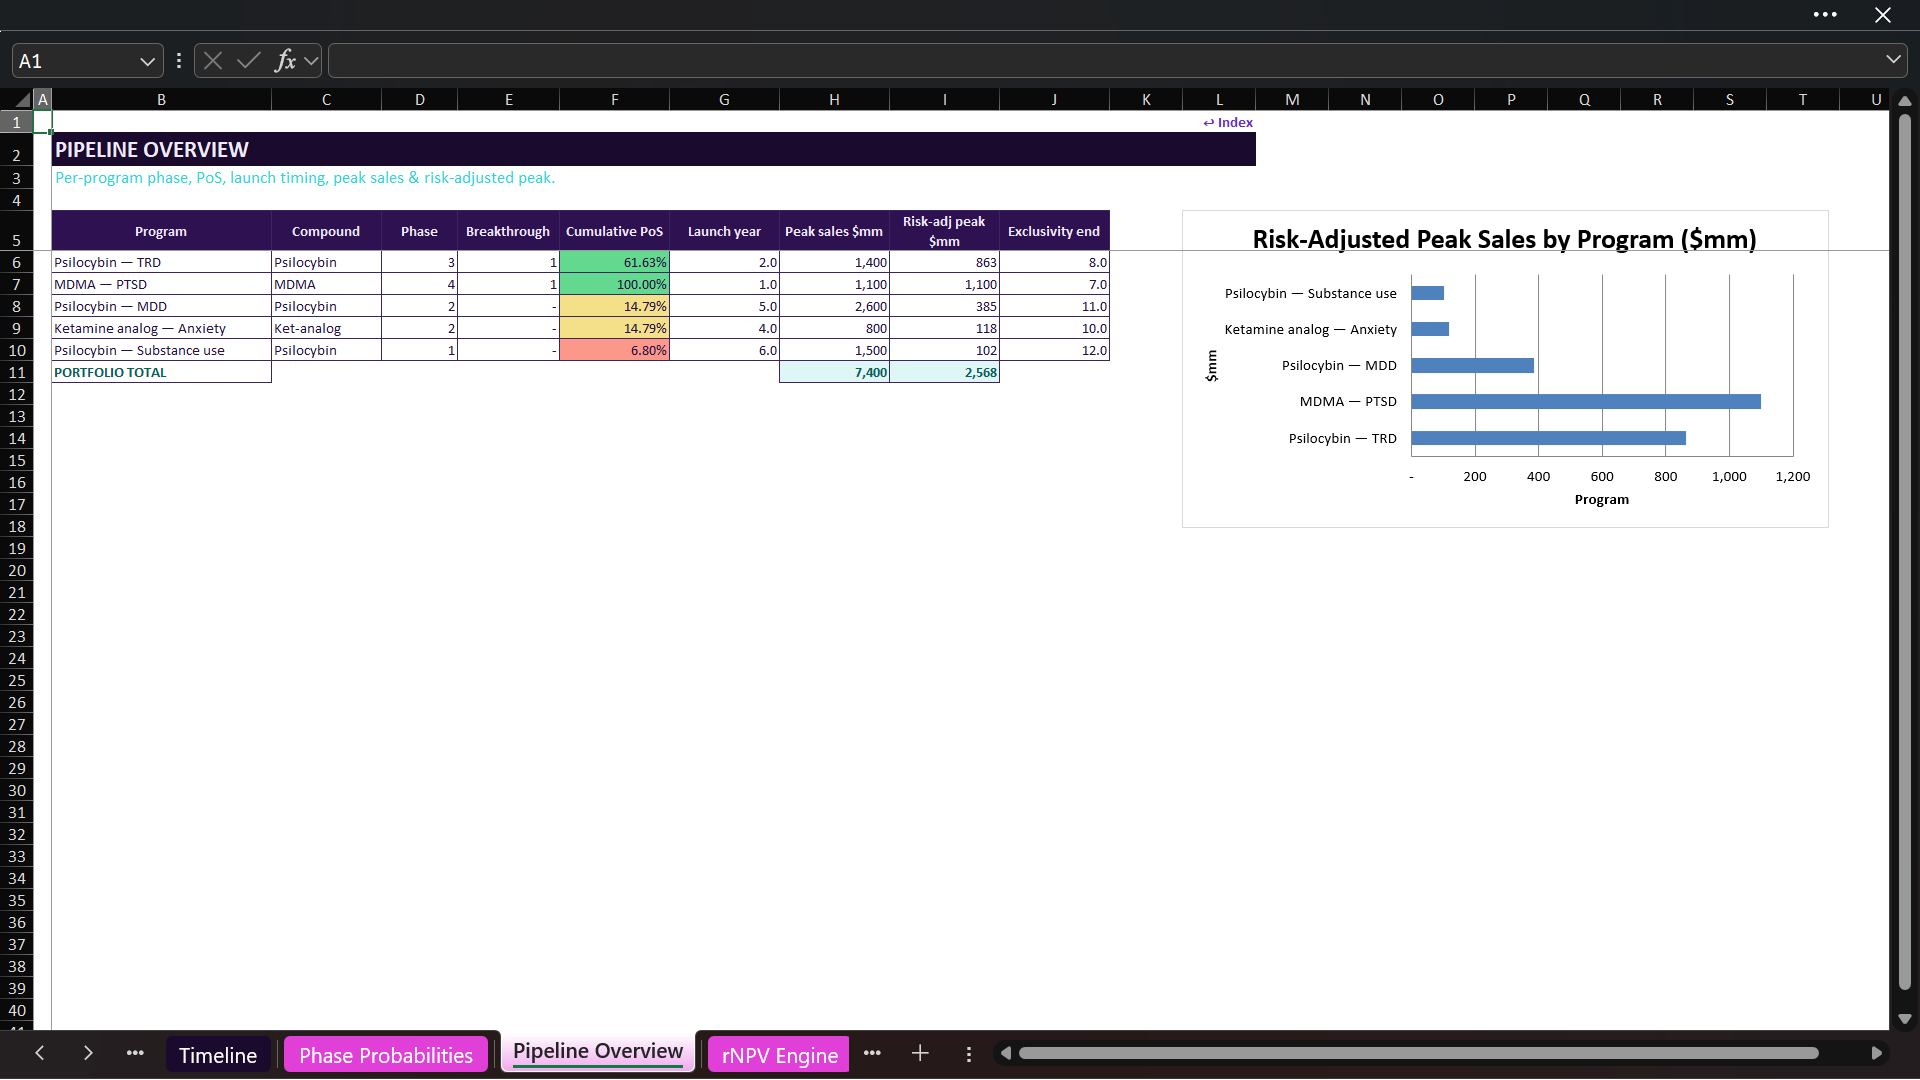
The illustrative portfolio contains five compound-and-indication programs across psilocybin, MDMA, and a ketamine analog. The editable program table accepts the current phase, breakthrough flag, success-case peak sales, and years to launch for every asset.
The Pipeline Overview converts these inputs into cumulative probability of approval, adjusted launch year, risk-adjusted peak sales, and exclusivity end. Users can replace the sample programs with their own pipeline while retaining the same calculation structure.

📊 PHASE PROBABILITY-OF-SUCCESS ENGINE
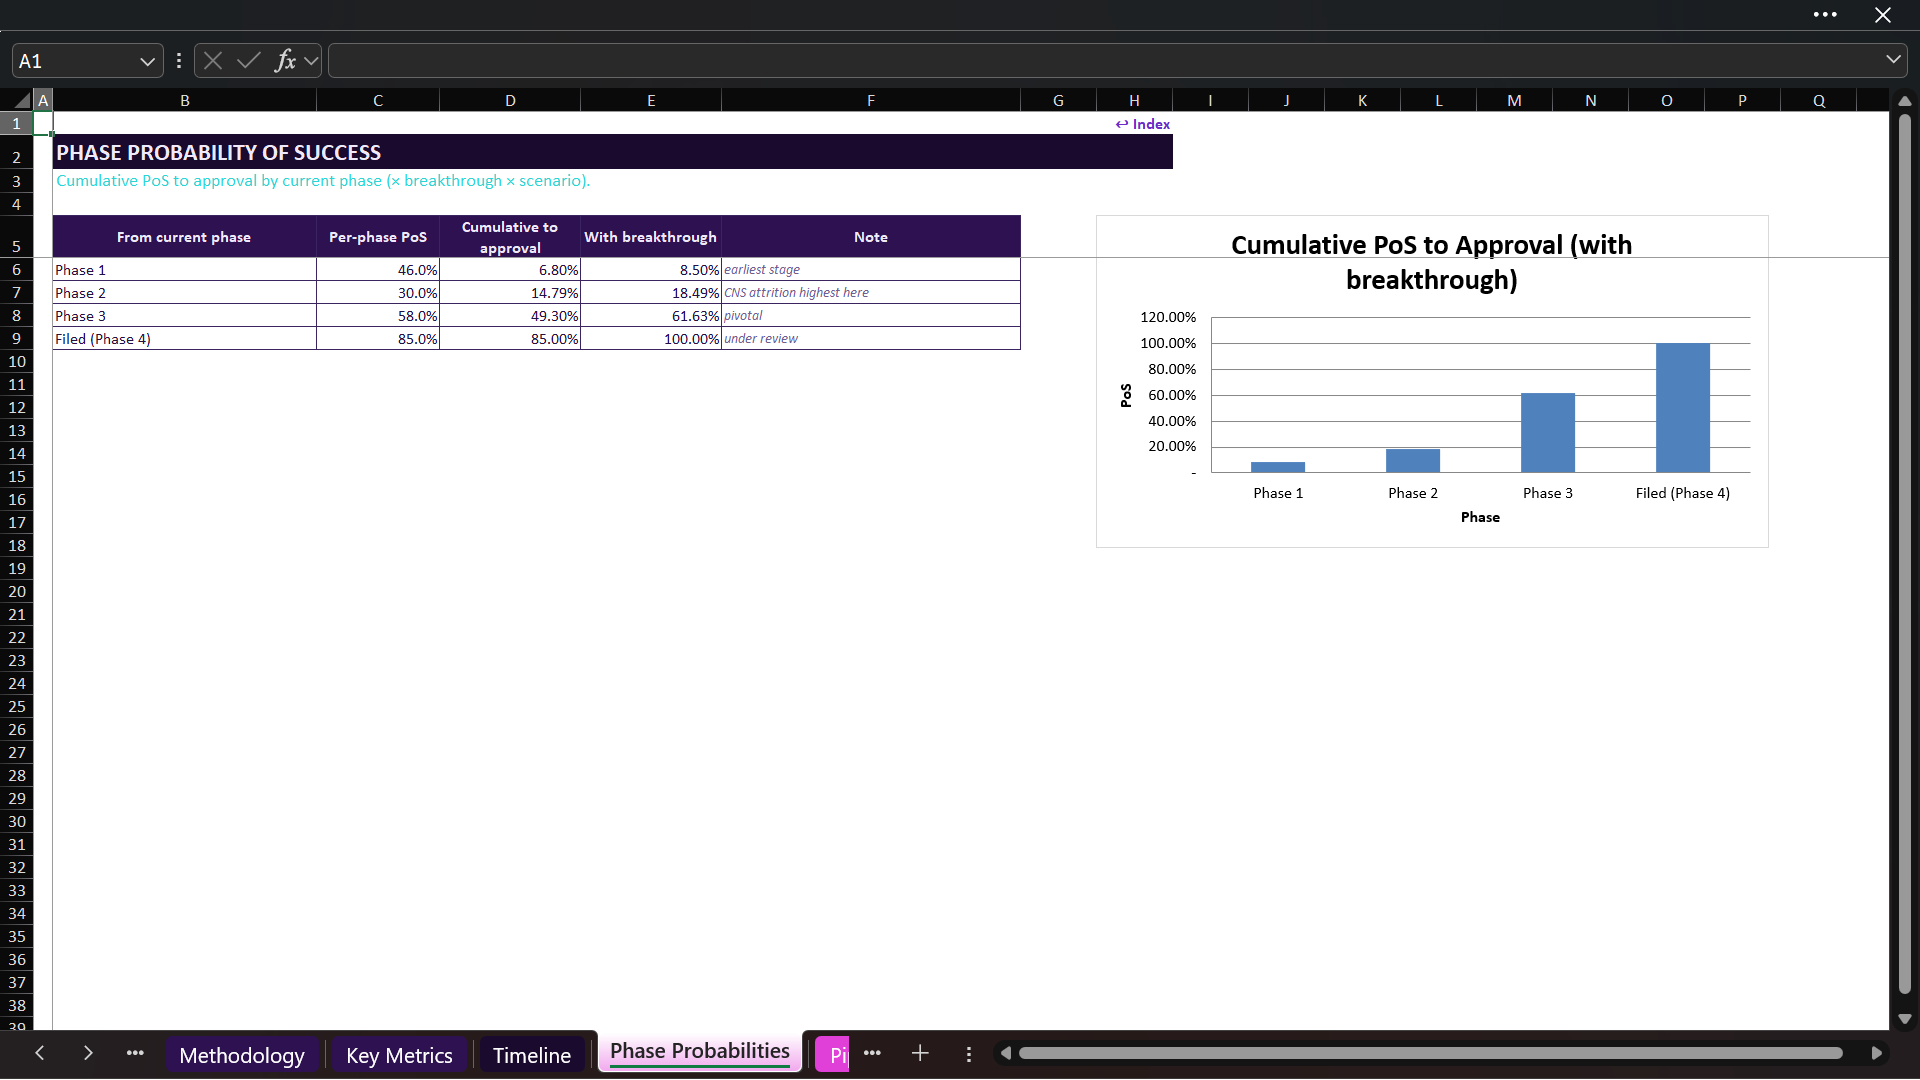
Separate Phase 1-to-2, Phase 2-to-3, Phase 3-to-filing, and filing-to-approval assumptions build cumulative probability from each program’s current phase to approval. A breakthrough multiplier can increase cumulative probability, subject to the model’s cap, and a timeline acceleration assumption can reduce years to launch.
Because phase probabilities are visible assumptions, users can apply internal benchmarks, indication-specific research, licensing diligence, or investment-committee views.

💎 PROGRAM-BY-PROGRAM rNPV ENGINE
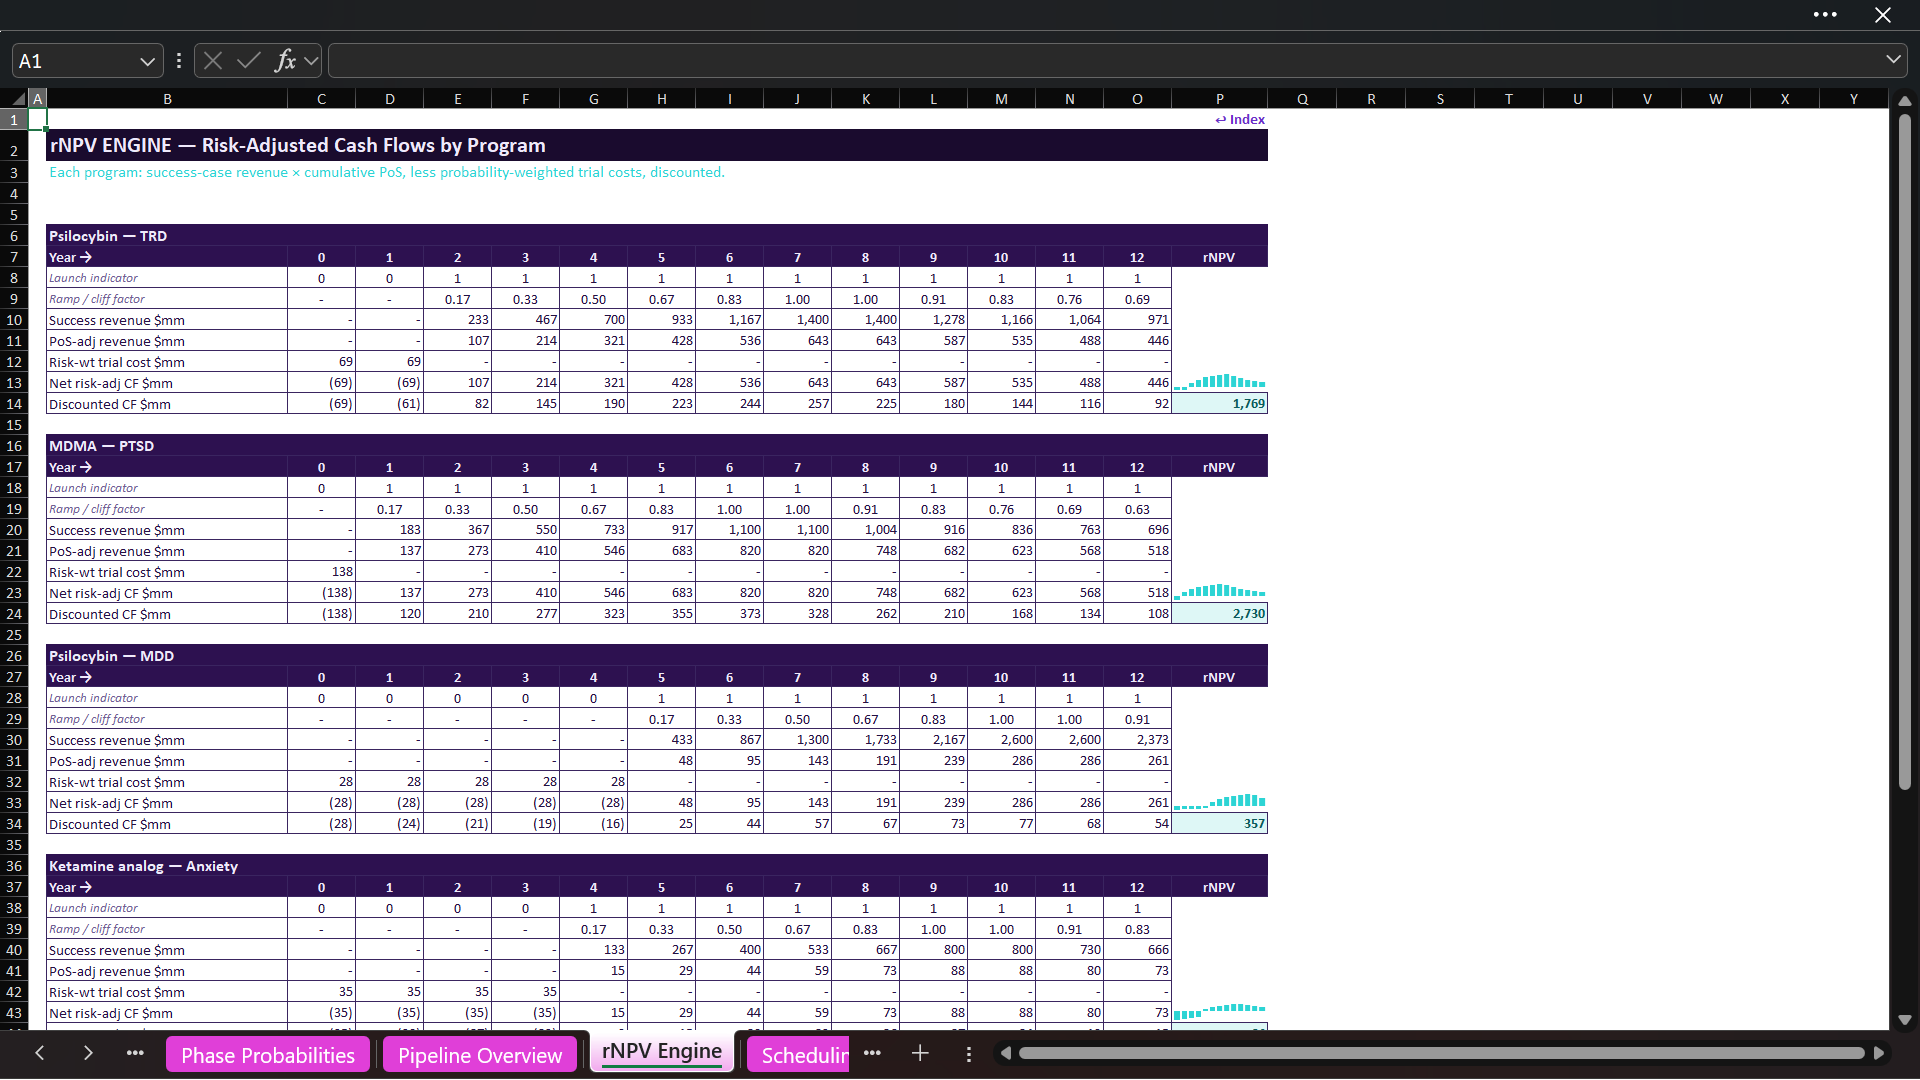
The rNPV Engine displays annual risk-adjusted cash flows for every program from Y0 through Y12. For each asset, the model calculates:
• Launch indicator and commercial ramp
• Post-exclusivity retention or erosion factor
• Success-case revenue by year
• Probability-adjusted revenue
• Development-cost cash flows
• Net risk-adjusted cash flow
• Discounted annual cash flow
• Individual program rNPV
The five program values are summed into portfolio rNPV. Buyers can see how phase, probability, time to market, peak sales, exclusivity, cost, scheduling, and discounting influence value.

⏱️ 12-YEAR TIMELINE & DISCOUNTING
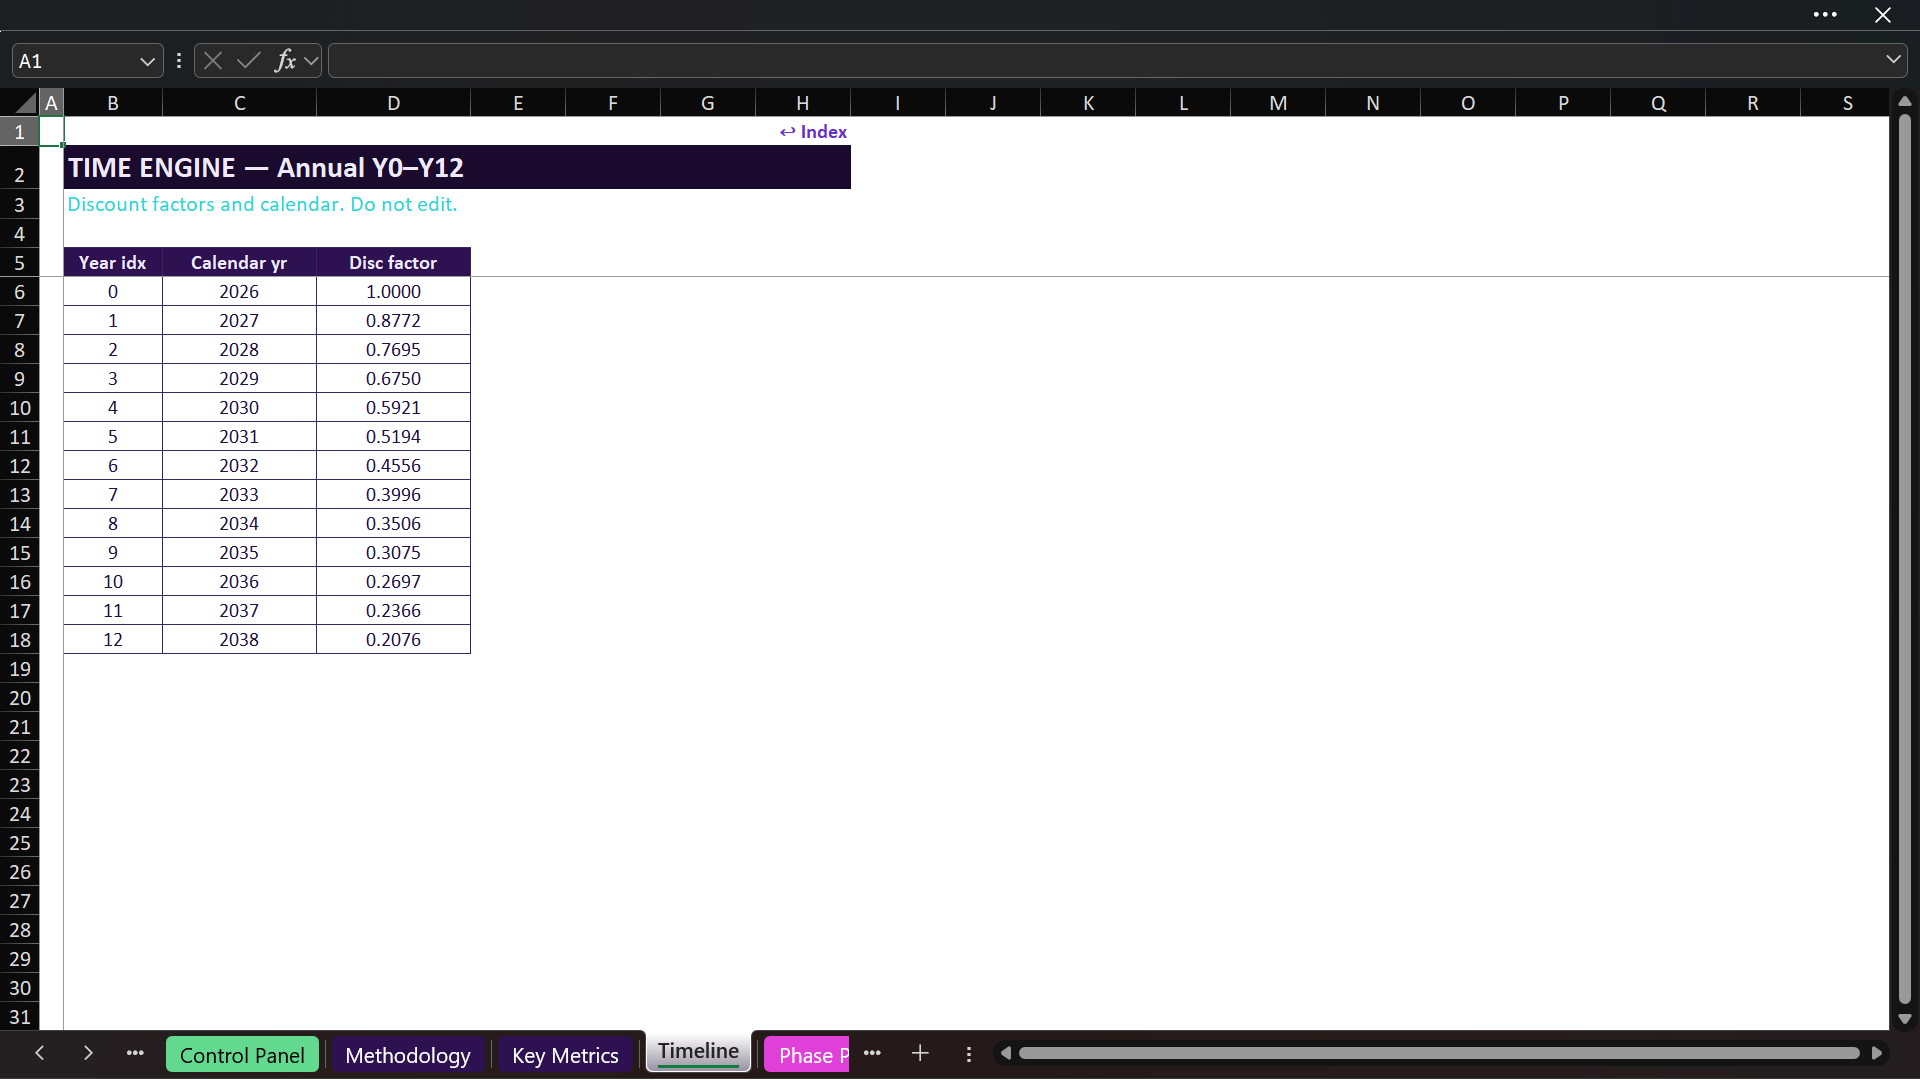
The annual timeline runs from Y0 through Y12 and includes calendar years and discount factors derived from the selected WACC. Program launch timing, breakthrough acceleration, revenue ramp, exclusivity, erosion, consolidated cash flow, terminal value, and sensitivities all use this common time axis.

⚖️ SCHEDULING & RECLASSIFICATION RISK
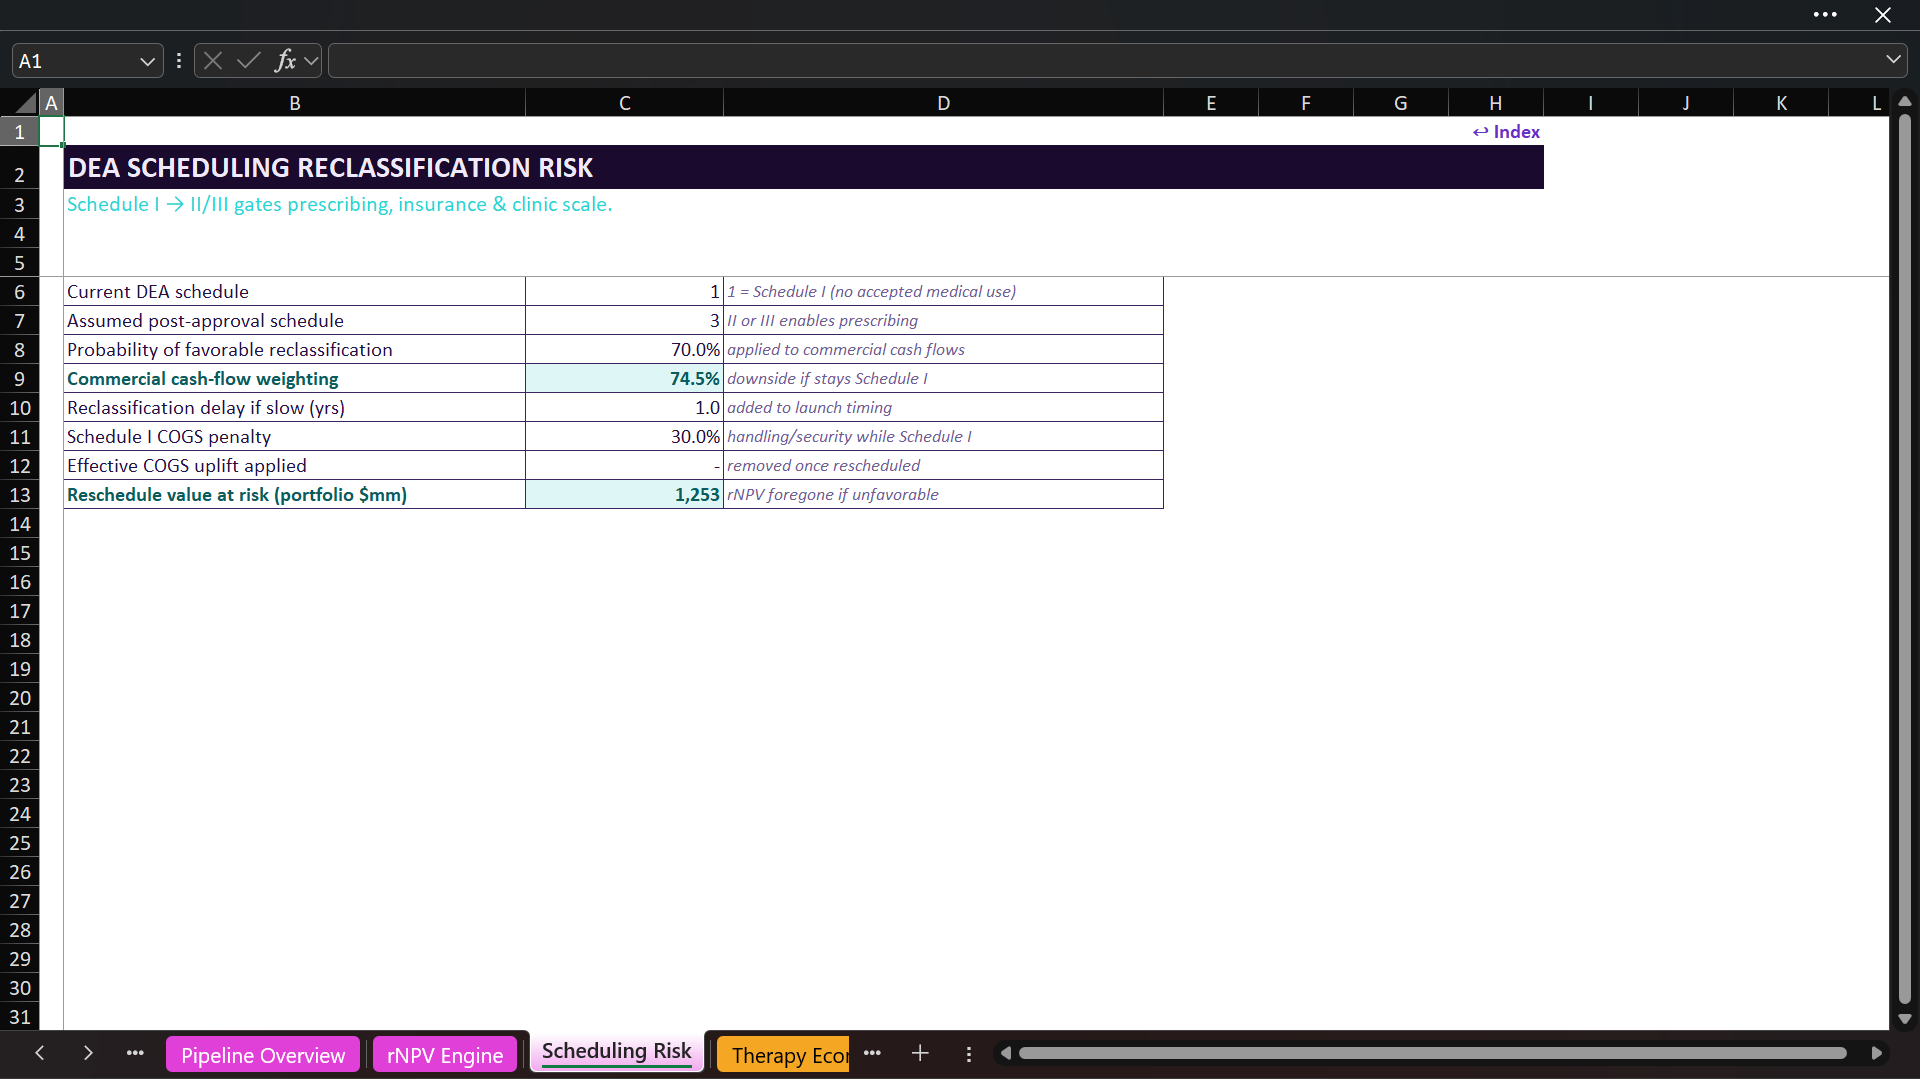
The Scheduling Risk module treats post-approval scheduling as a configurable commercial gate. Users can enter the current schedule assumption, intended post-approval schedule, probability of a favorable outcome, potential delay, and additional handling-cost burden.
The model calculates commercial cash-flow weighting and portfolio value exposed to an unfavorable outcome, making regulatory timing and access visible within the valuation. Replace all sample entries with jurisdiction- and product-specific analysis.

🩺 PSYCHEDELIC-ASSISTED THERAPY ECONOMICS
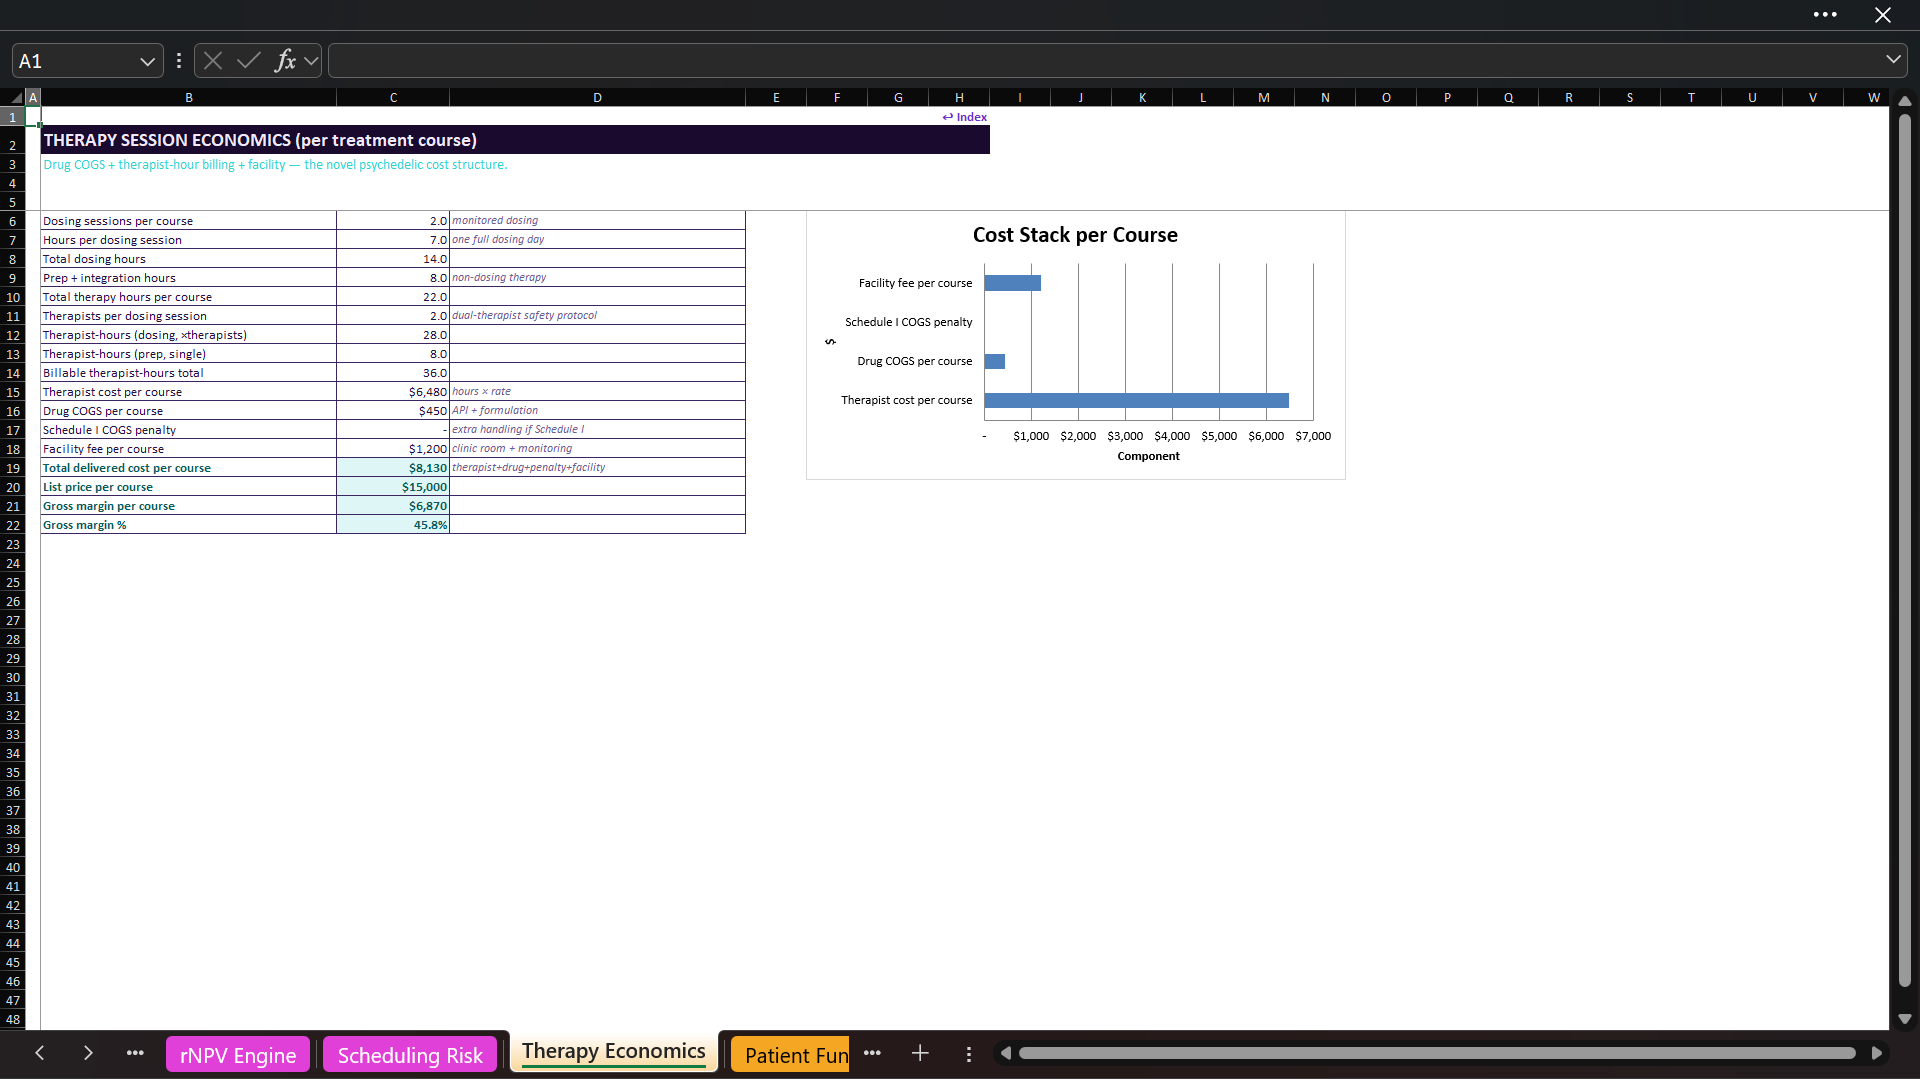
The Therapy Economics schedule builds the delivered cost of one treatment course from the operating inputs that make this care model distinctive:
• Number of dosing sessions
• Hours per monitored dosing session
• Preparation and integration hours
• Therapists required during dosing
• Therapist billing or fully loaded rate
• Drug and formulation cost
• Additional controlled-substance handling cost
• Clinic room and monitoring fee
• List price per treatment course
The model calculates dosing hours, total therapy hours, billable therapist-hours, therapist cost, delivered cost, gross profit per course, and gross margin.

👥 PATIENT FUNNEL, ADOPTION & CAPACITY
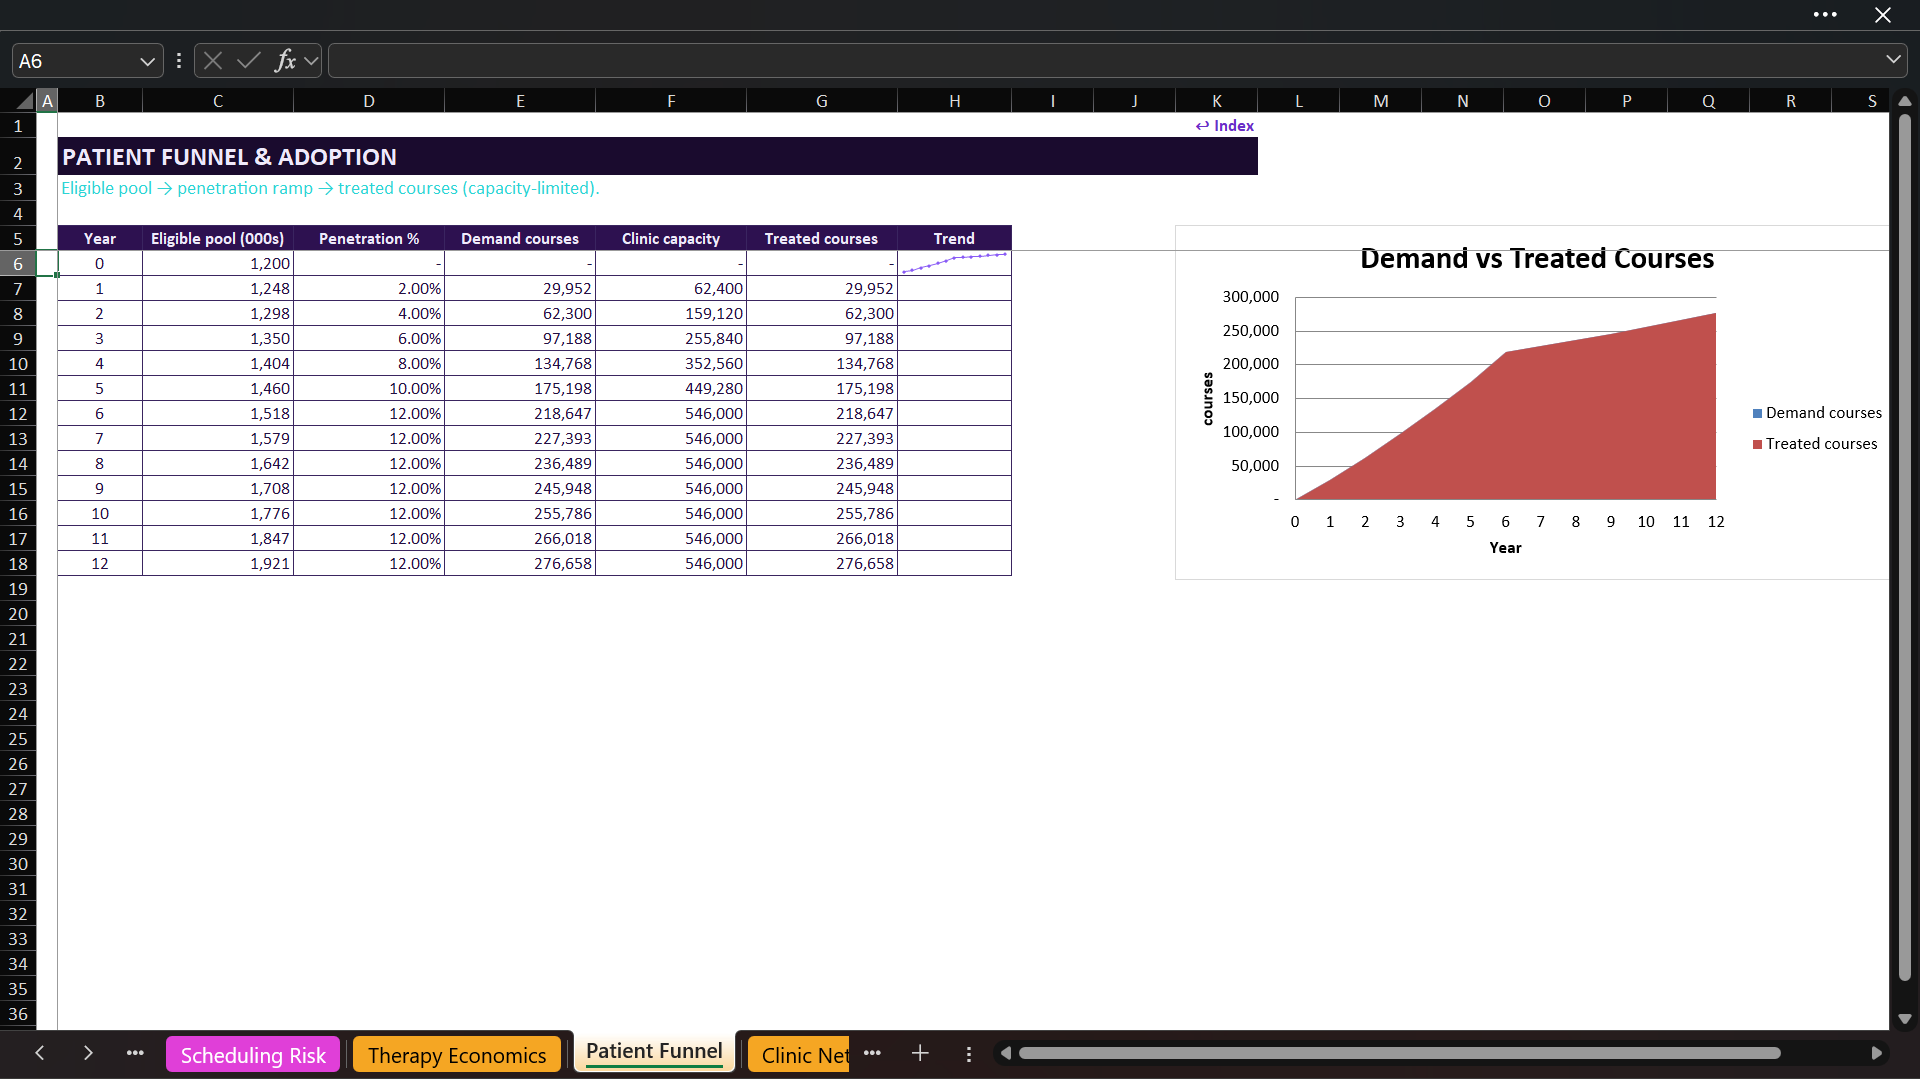
The Patient Funnel grows the eligible population, ramps penetration toward a configurable peak, incorporates re-treatment, and estimates annual demand for treatment courses. Treated volume is limited by the capacity calculated from the clinic network.
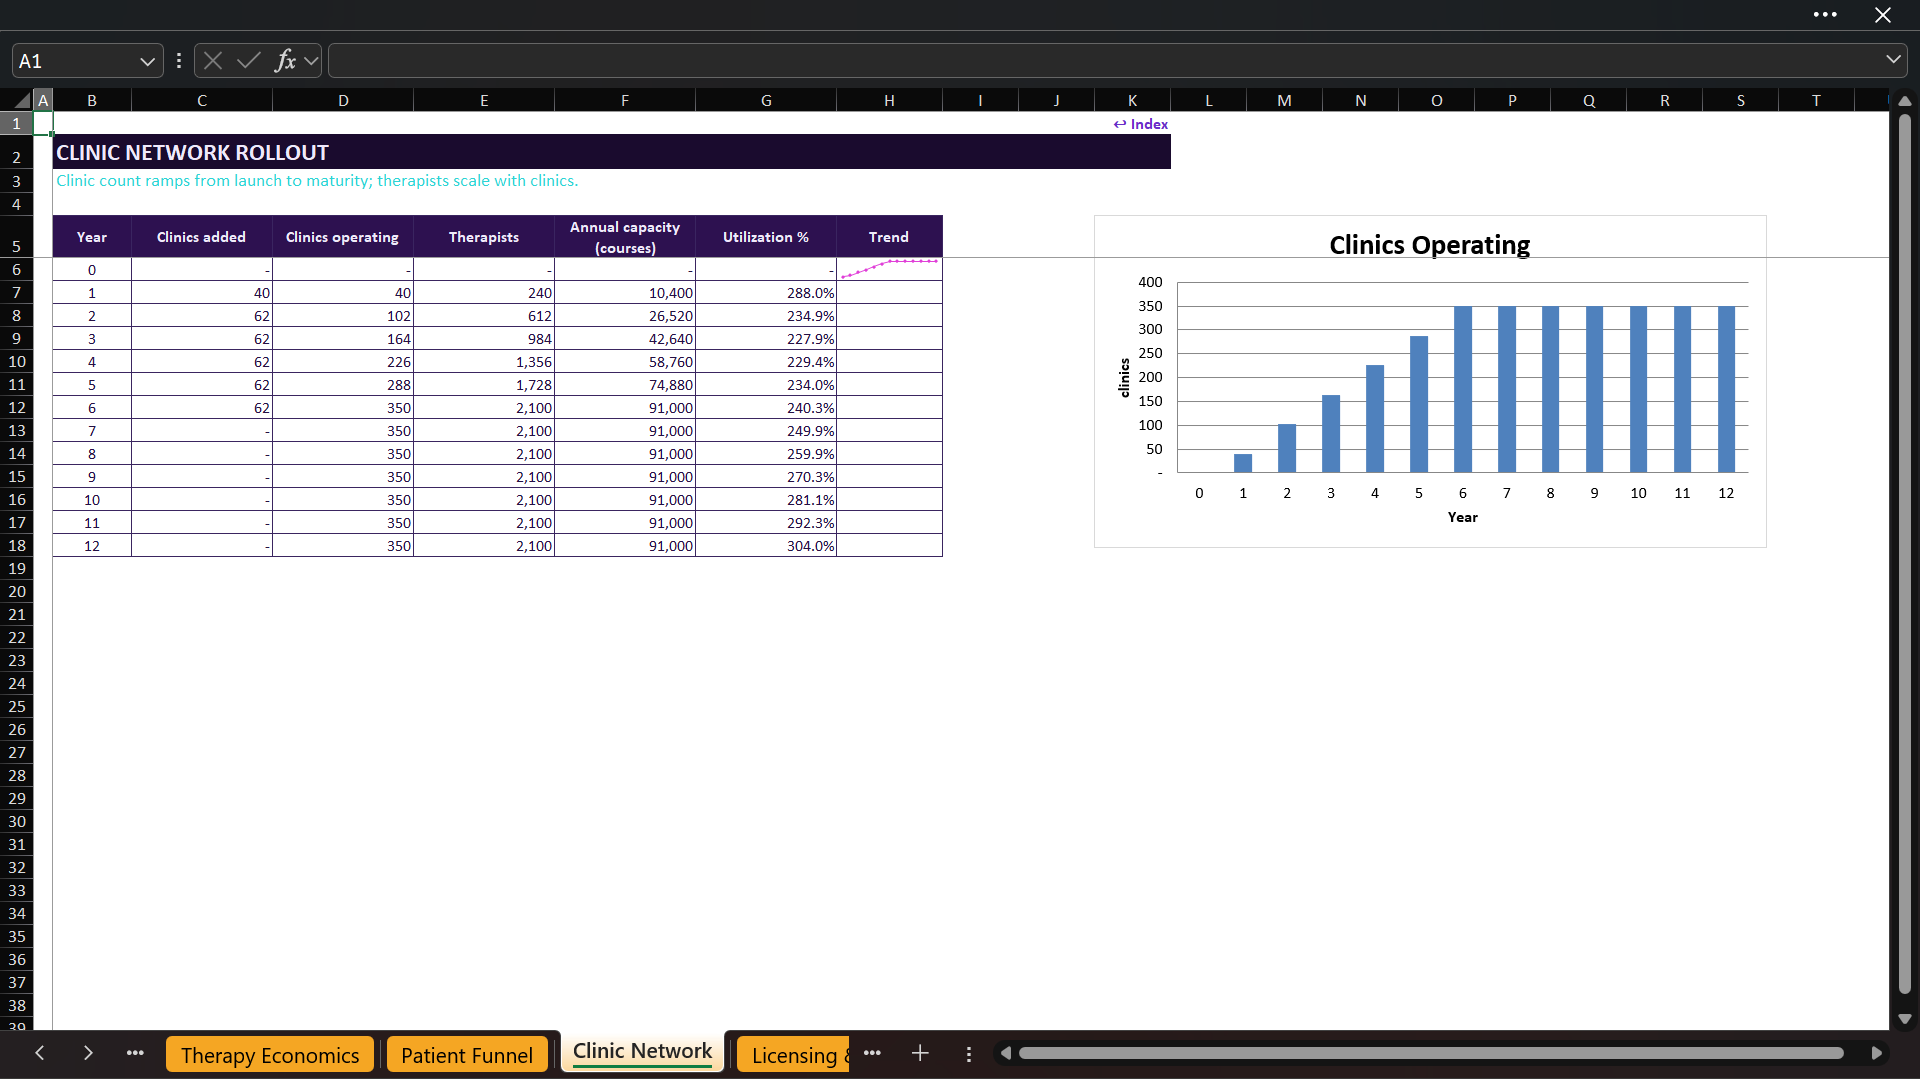
The Clinic Network schedule models clinics added, clinics operating, therapists, annual course capacity, and utilization. Users can change launch-year clinics, mature network size, courses per clinic, therapists per clinic, and rollout timing to test whether infrastructure can support demand.

🏥 LICENSING & THERAPIST TRAINING
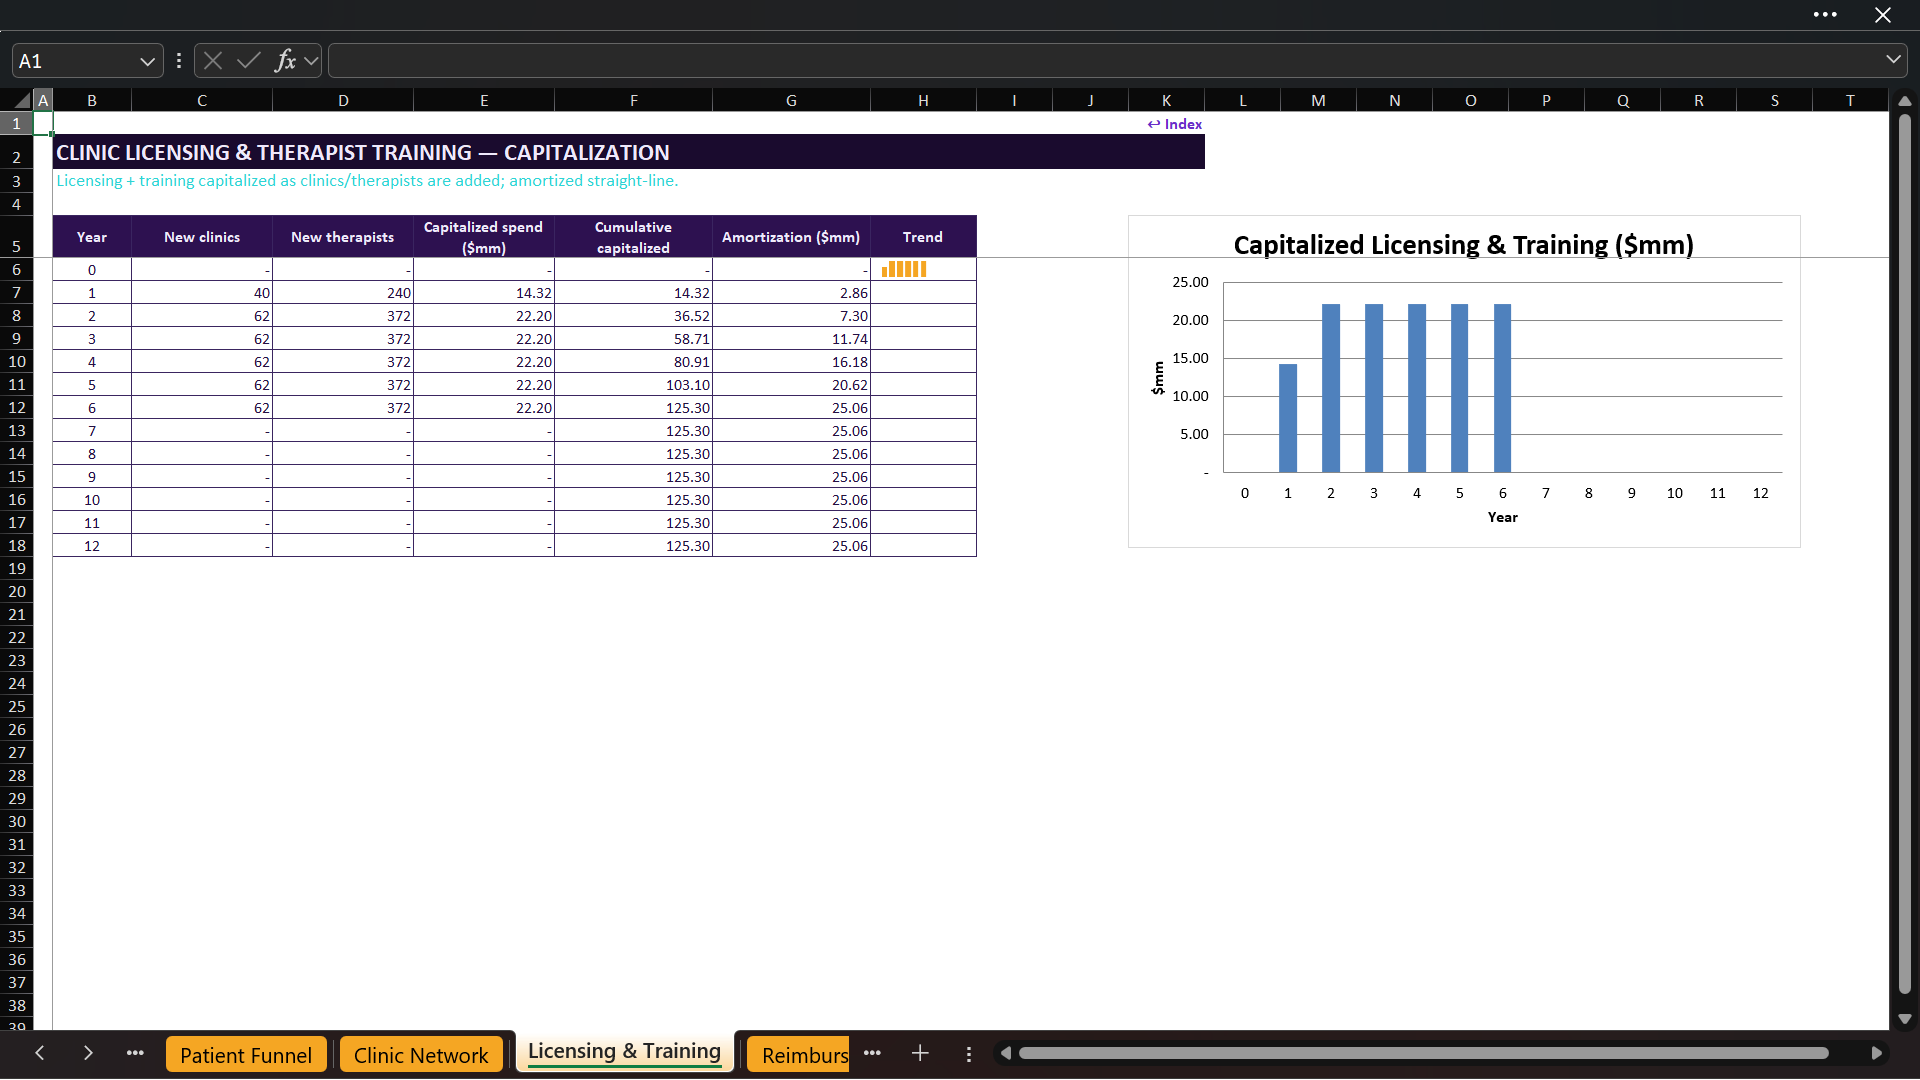
Clinic licensing and therapist training are modeled as capitalized investments linked to new clinics and therapists. The workbook calculates annual capitalized spend, cumulative capitalized investment, and straight-line amortization over a configurable useful life.

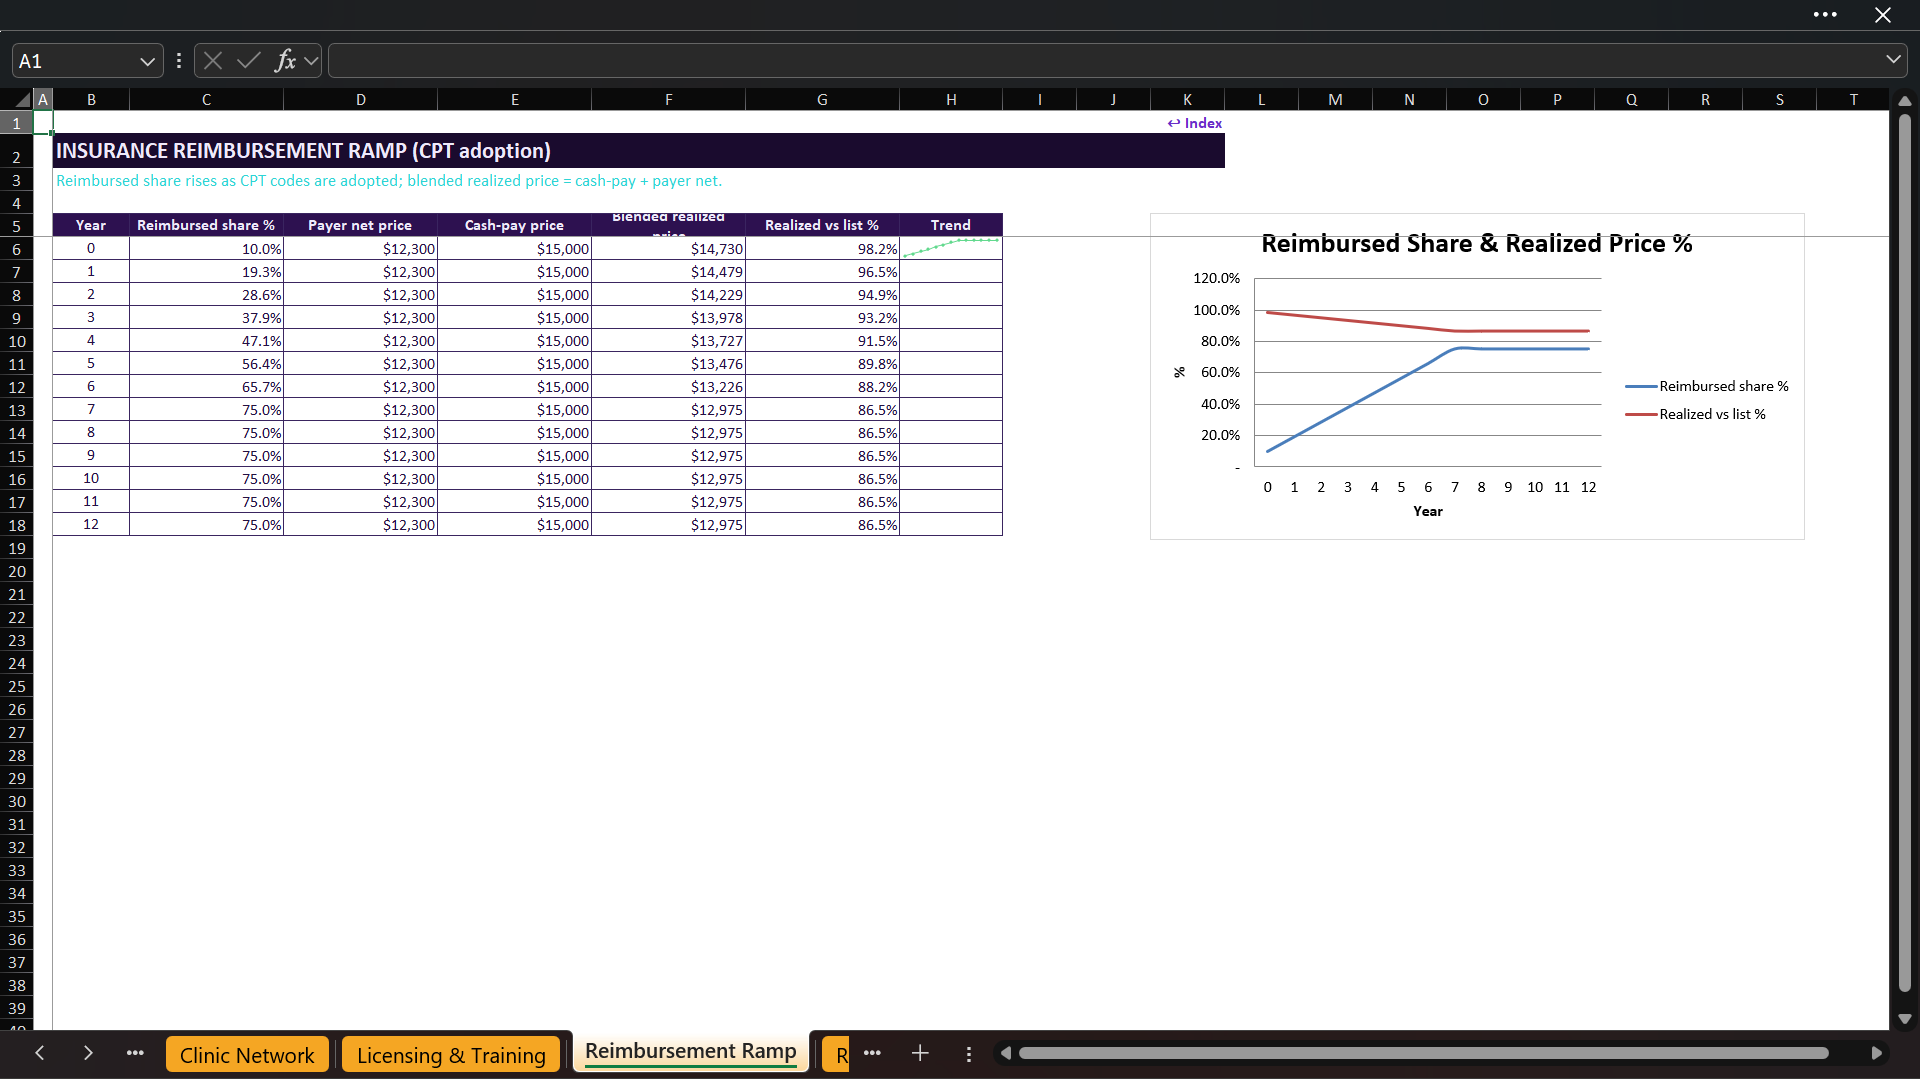
💳 REIMBURSEMENT & REALIZED PRICING
The Reimbursement Ramp models an early mix weighted toward cash-pay and a gradual increase in reimbursed courses. Users set reimbursed share at launch, terminal reimbursed share, years to maturity, and the payer haircut versus list price.
The model calculates payer-net price, cash-pay price, blended realized price, and realized price versus list, showing the trade-off between broader coverage and lower payer pricing.

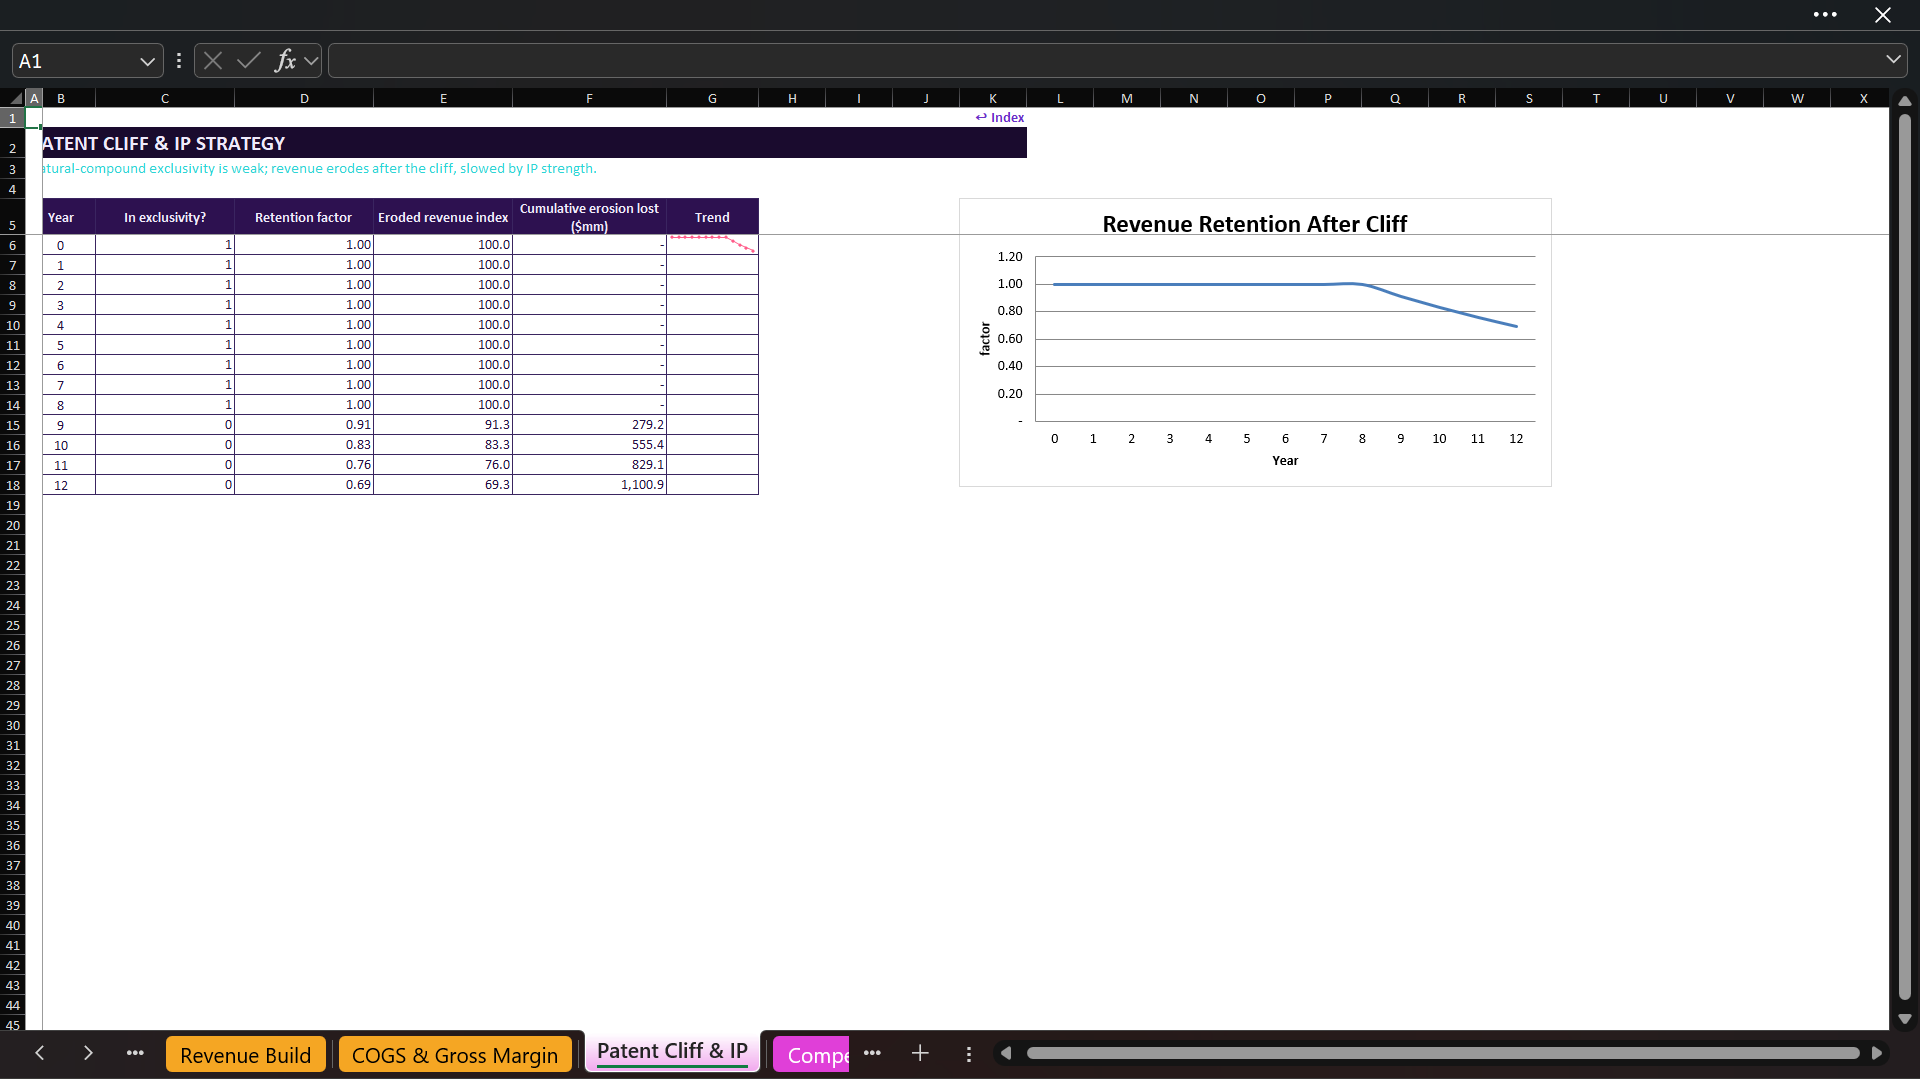
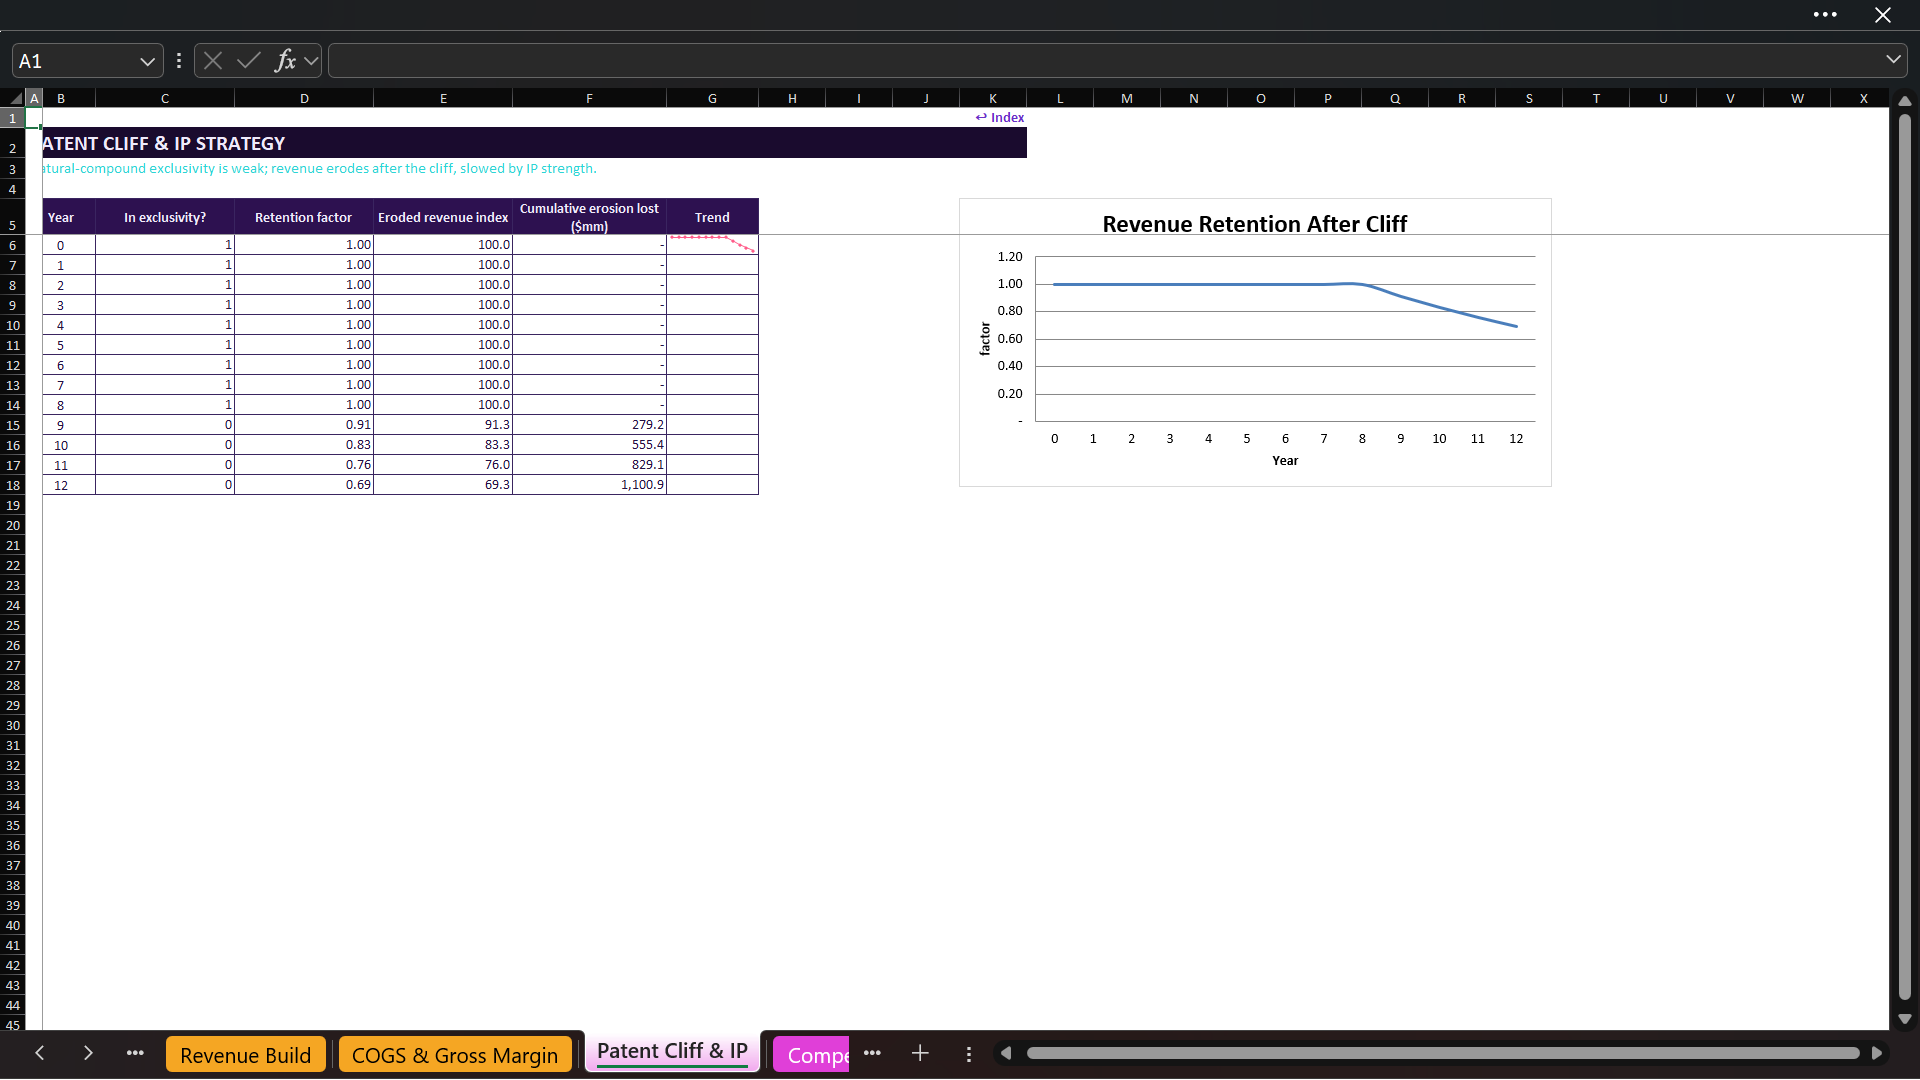
📉 PATENT CLIFF & IP STRATEGY
The IP module reflects the potential exclusivity challenges of naturally occurring compounds. Users define an effective market-exclusivity period, annual post-cliff price/volume erosion, an erosion floor, and an IP-strength factor.
The resulting retention curve flows into program revenue and rNPV, representing formulation, method-of-use, regulatory exclusivity, generic, compounded, and alternative-provider risks through editable assumptions.

🥊 COMPETITIVE SCENARIOS
The competitive selector compares three positioning environments:
• Pharma-led
• Balanced
• Retreat-pressured
Each mode changes the pharmaceutical channel’s treated-patient share and price realization without rebuilding the commercial forecast.

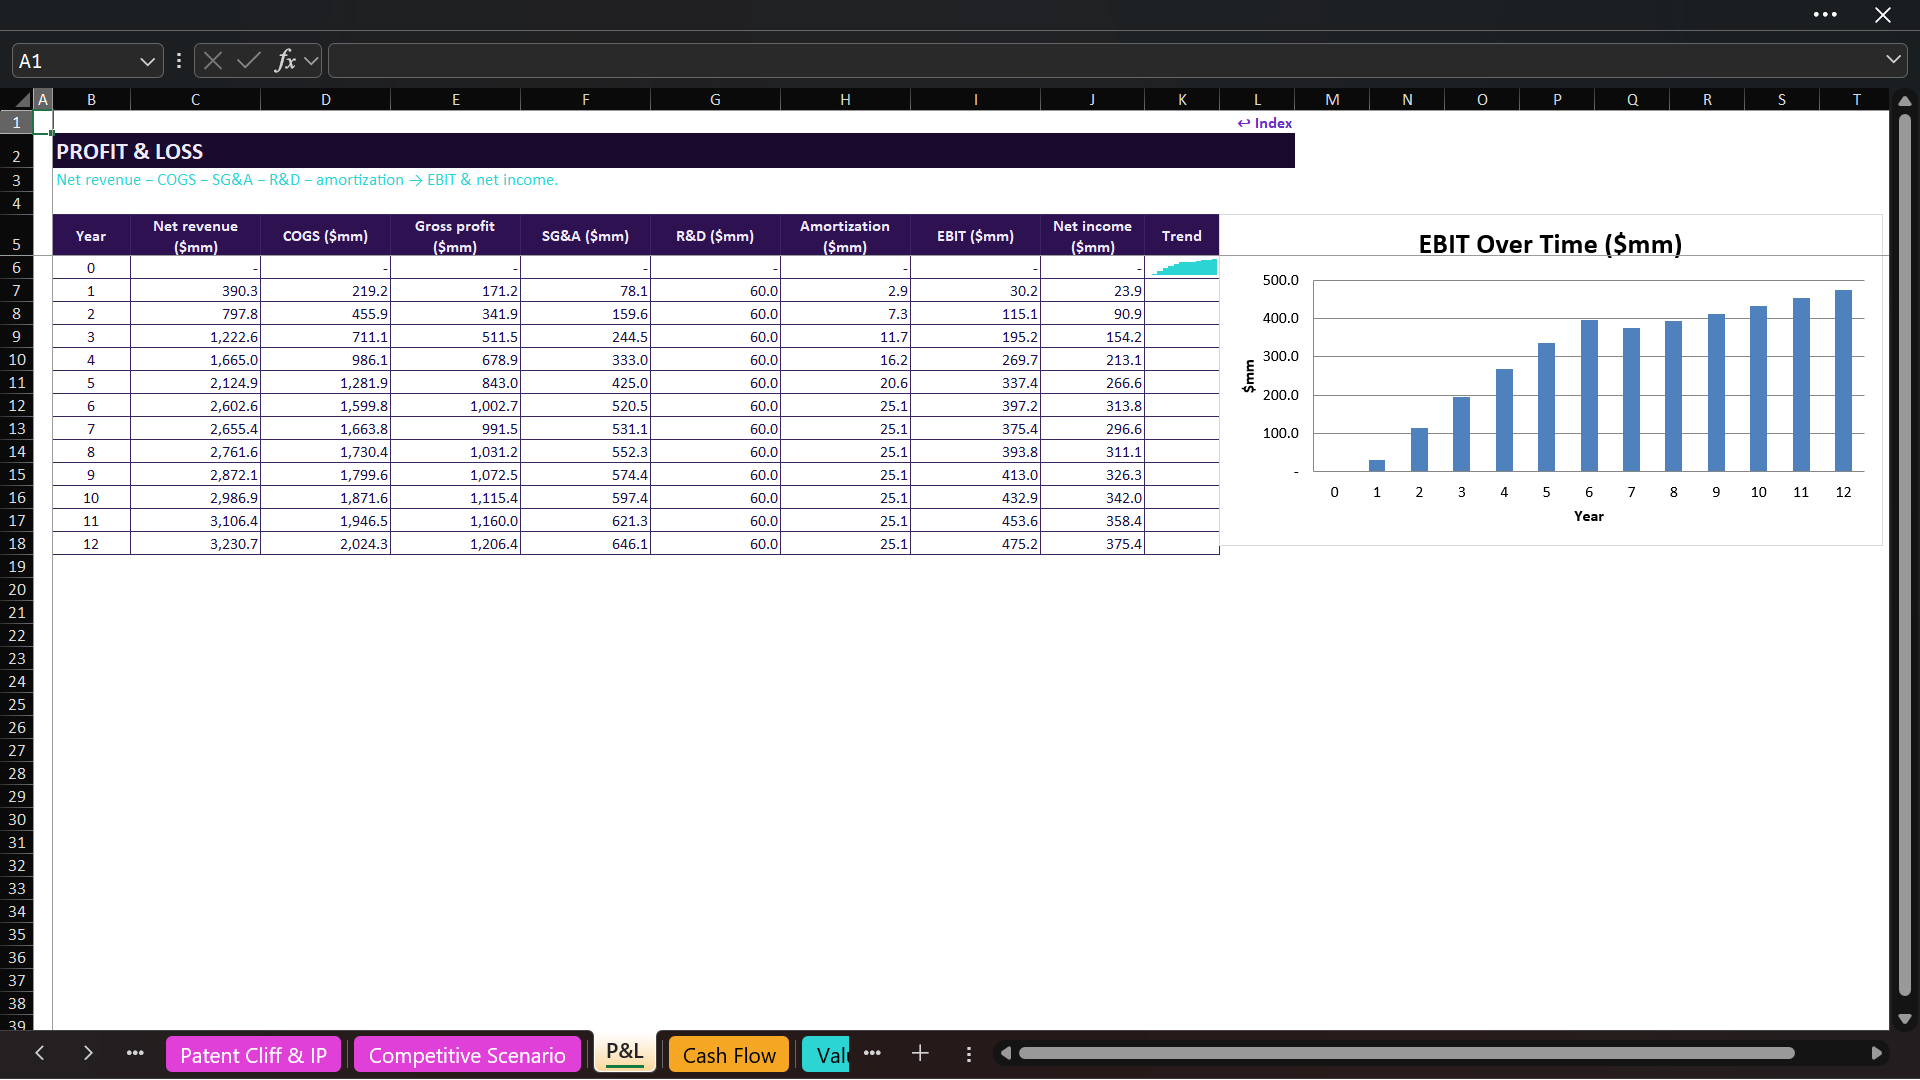
📈 REVENUE, COSTS, P&L & CASH FLOW
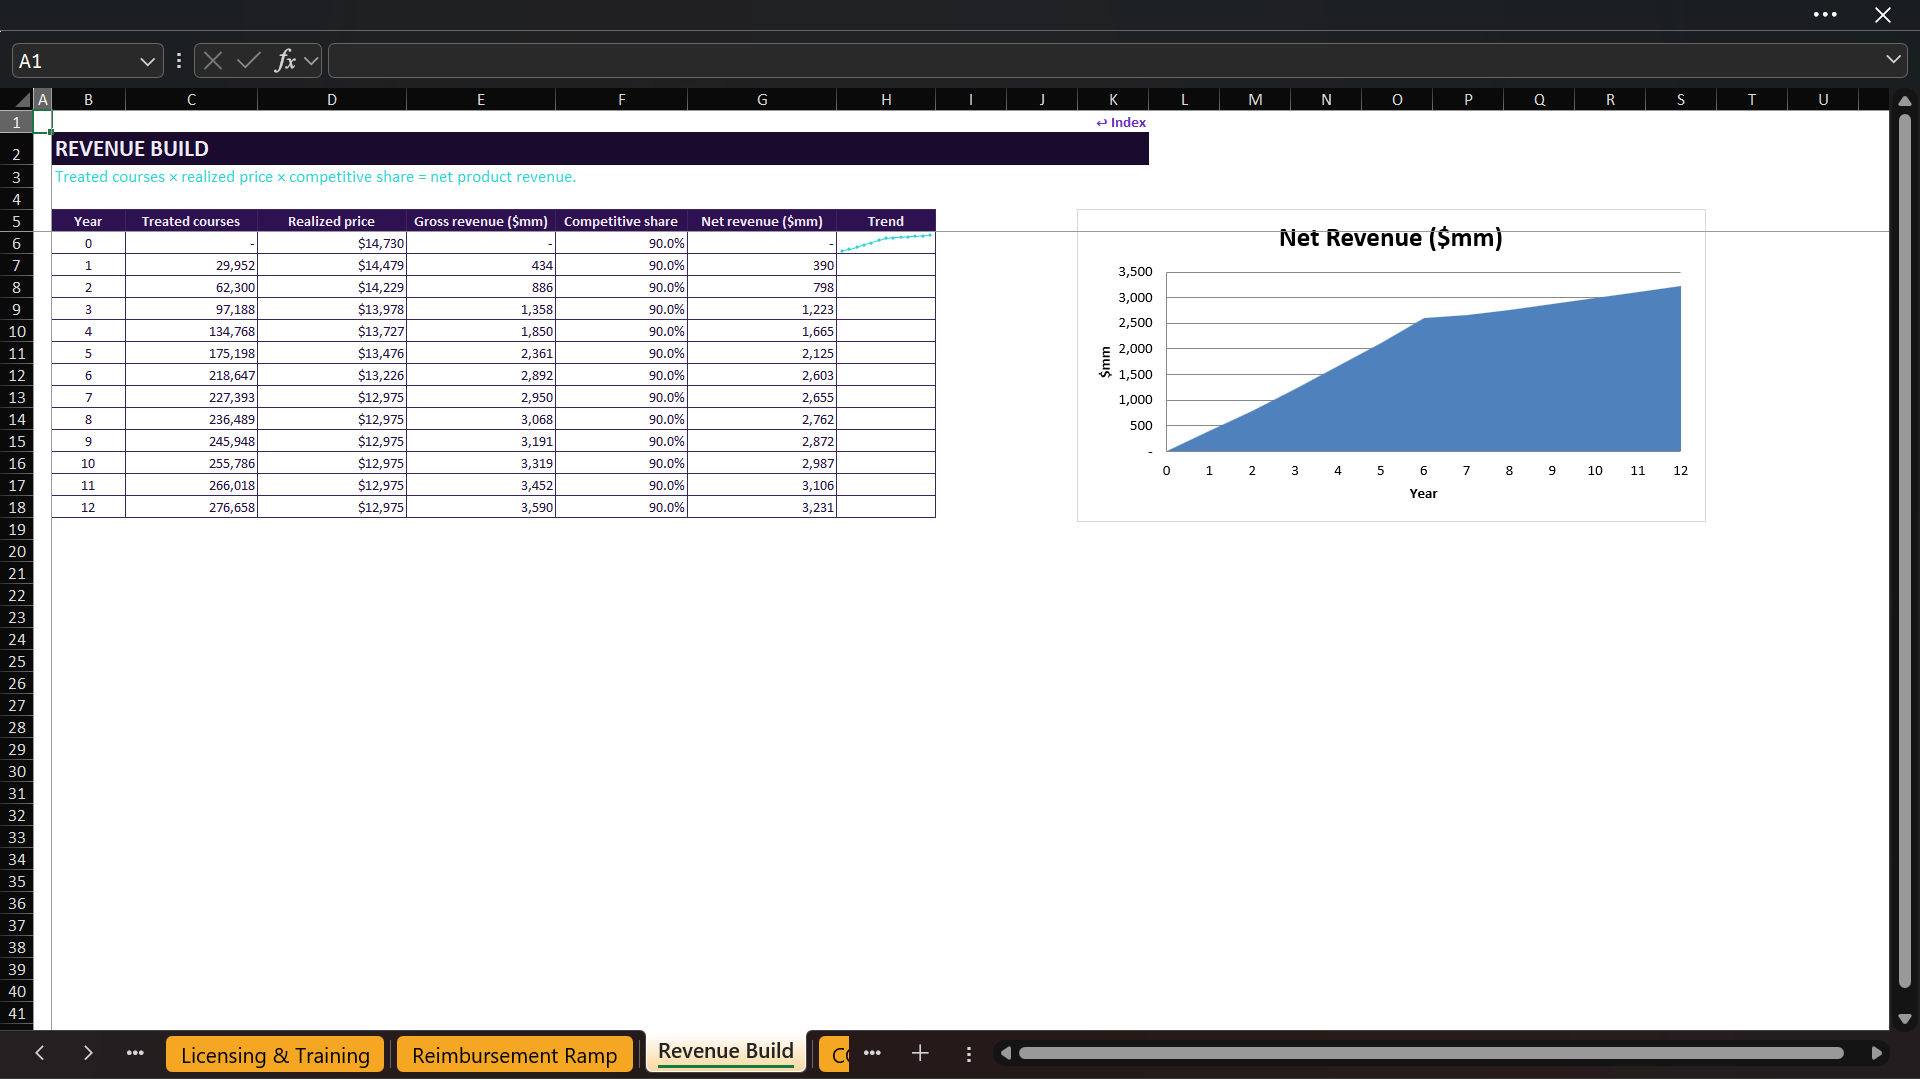
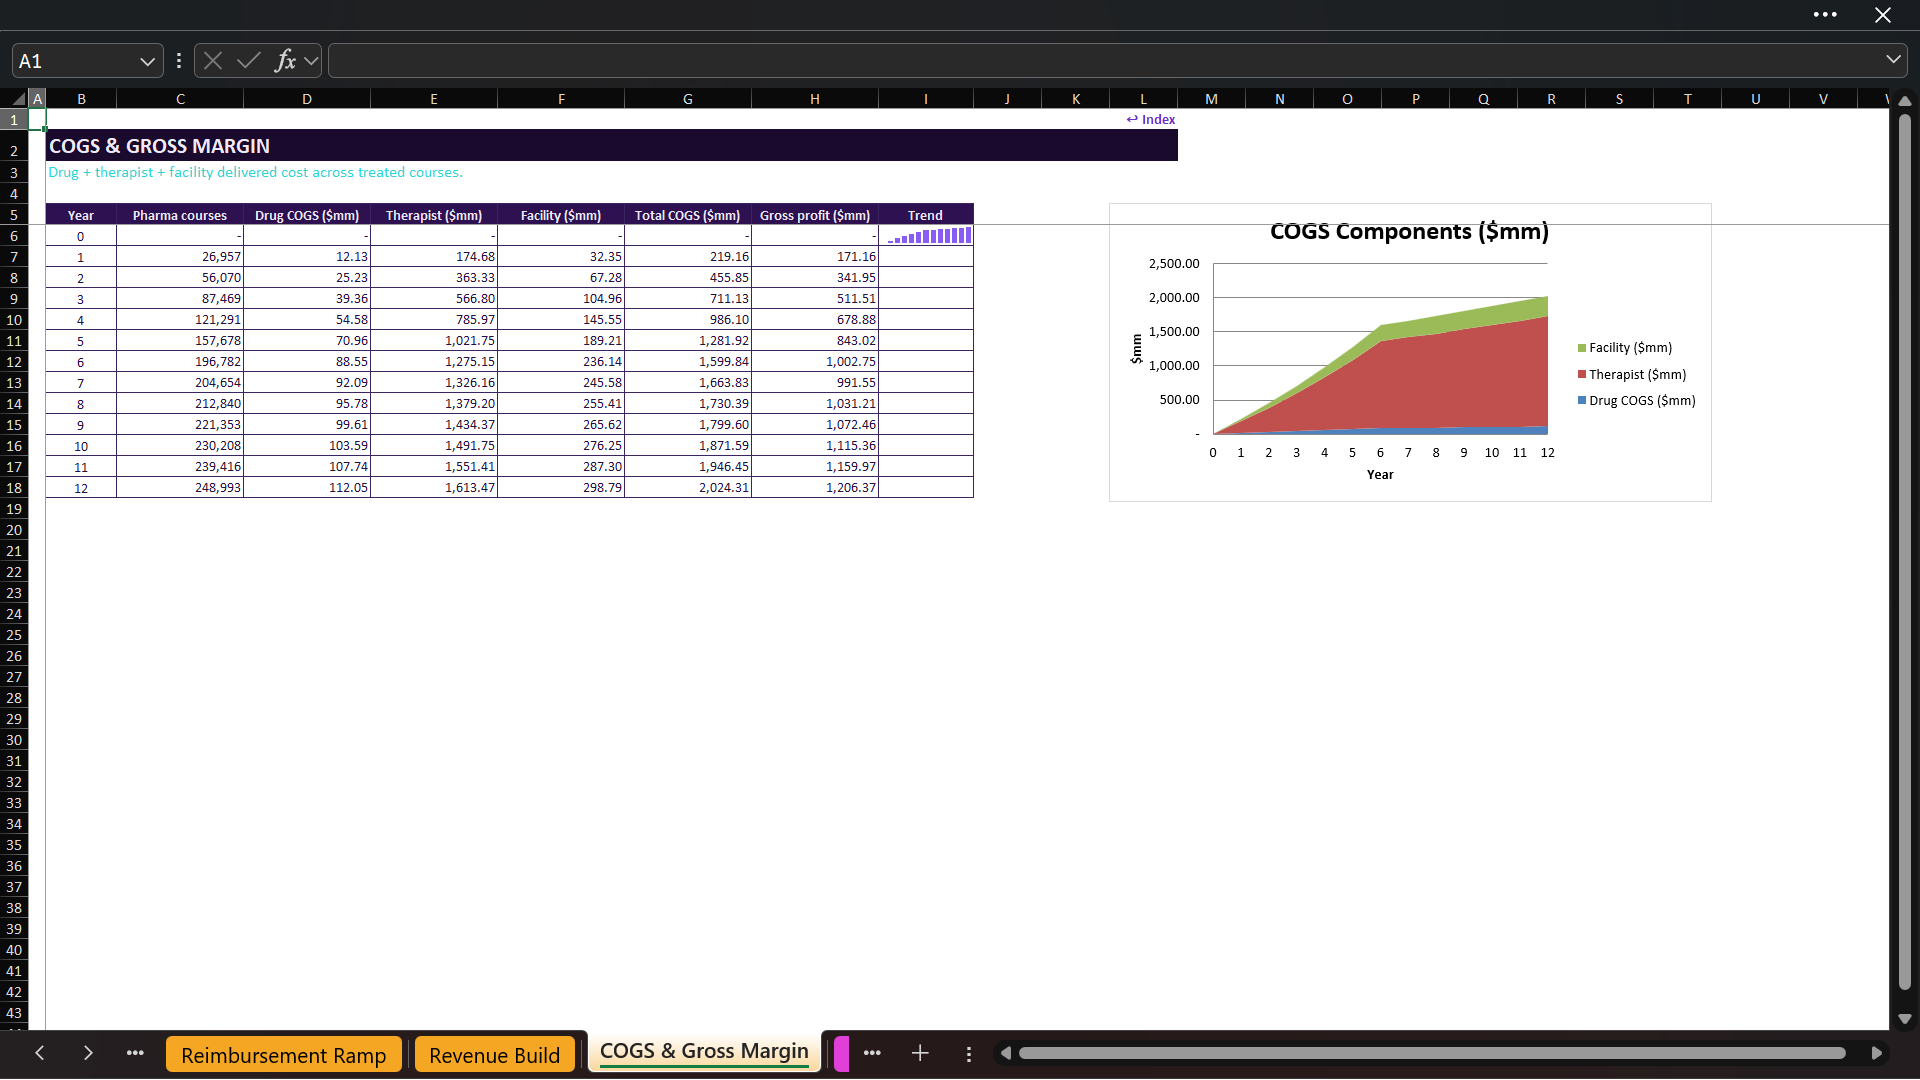
The Revenue Build multiplies treated courses by blended realized price and competitive share. The COGS schedule separates therapist cost, drug cost, controlled-substance handling, and facility cost before calculating gross profit.
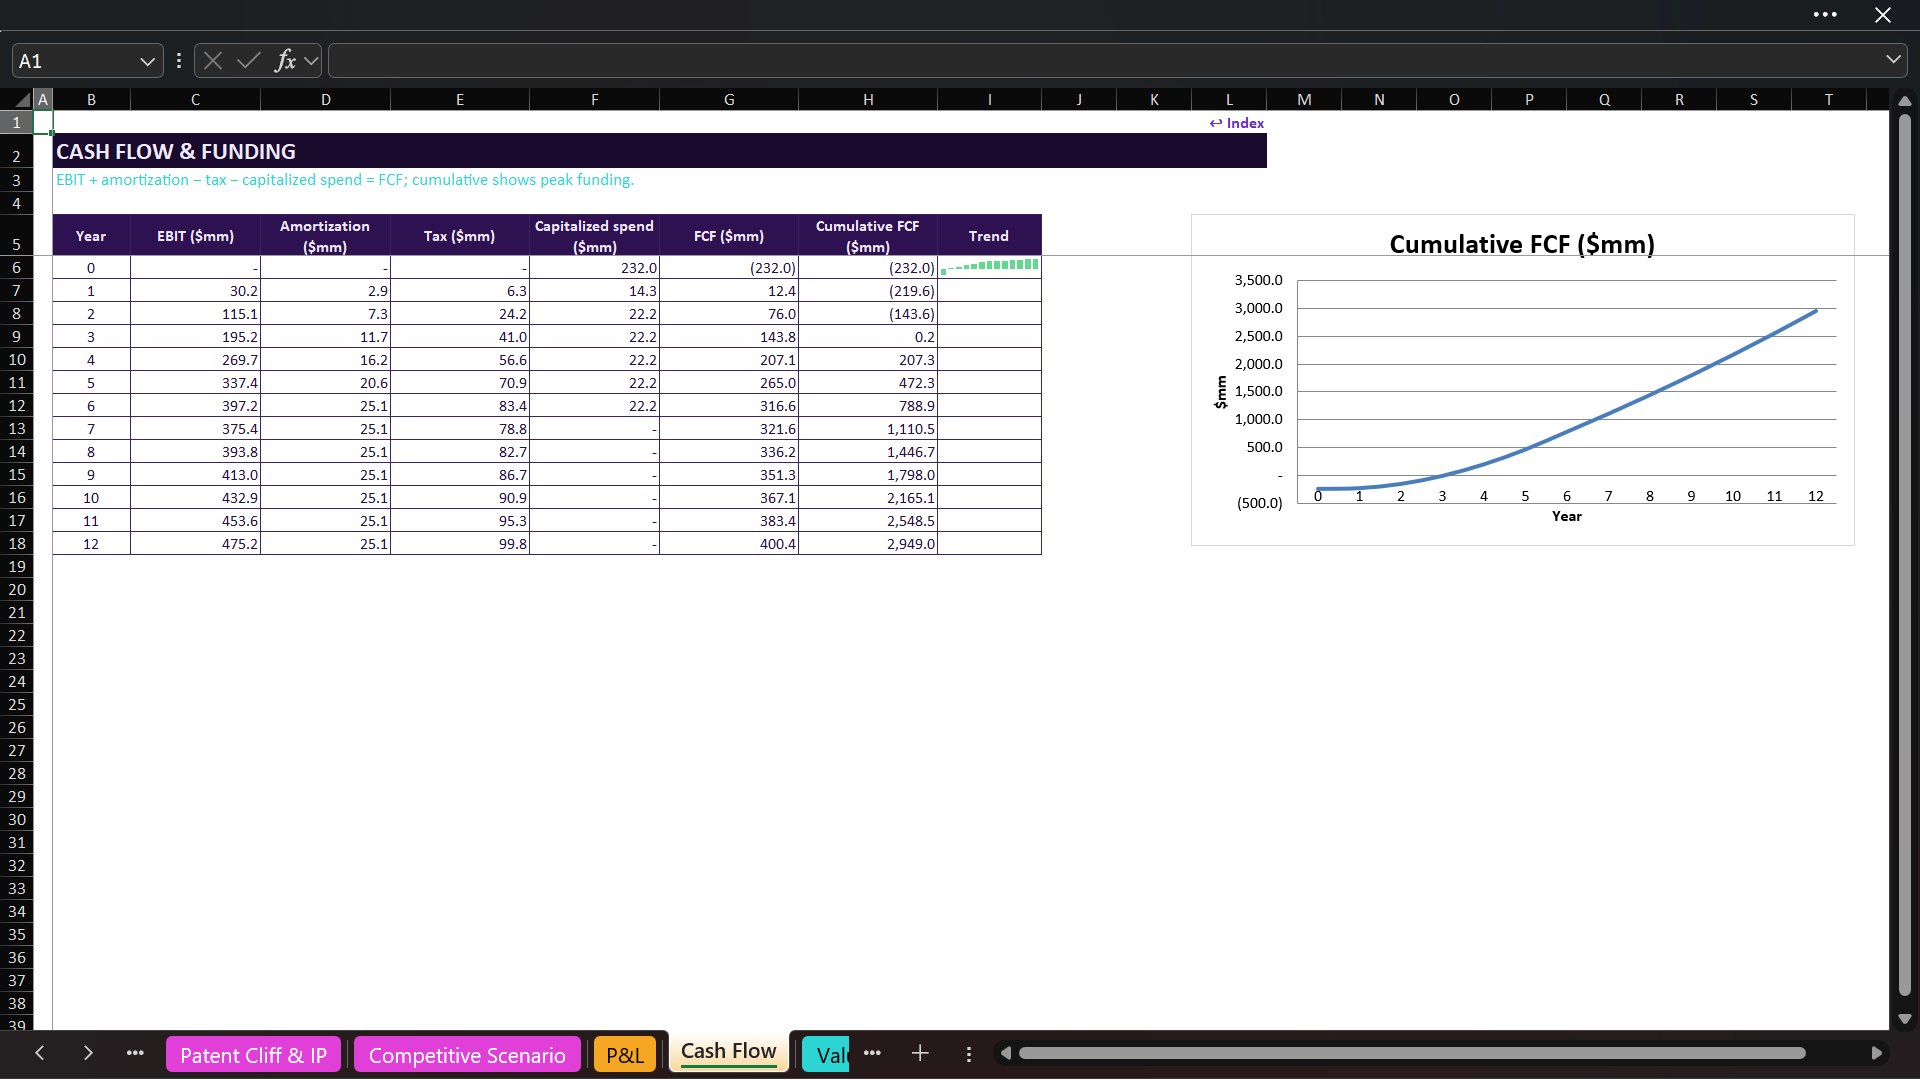
The linked P&L forecasts net revenue, COGS, gross profit, SG&A, ongoing R&D, amortization, EBIT, taxes, and net income from Y0 through Y12. The Cash Flow schedule converts operating profit into free cash flow after tax and capitalized licensing/training spend, then tracks cumulative cash flow and peak funding need.

🔀 BEAR, BASE & BULL CASES
The scenario selector changes five important drivers together:
• Probability of success
• Peak sales
• Patient penetration
• Price realization
• Reimbursement adoption
Every operating schedule and valuation output responds to the active scenario. Users may also create a custom case by changing individual assumptions.

💰 VALUATION TRIANGULATION & RETURNS
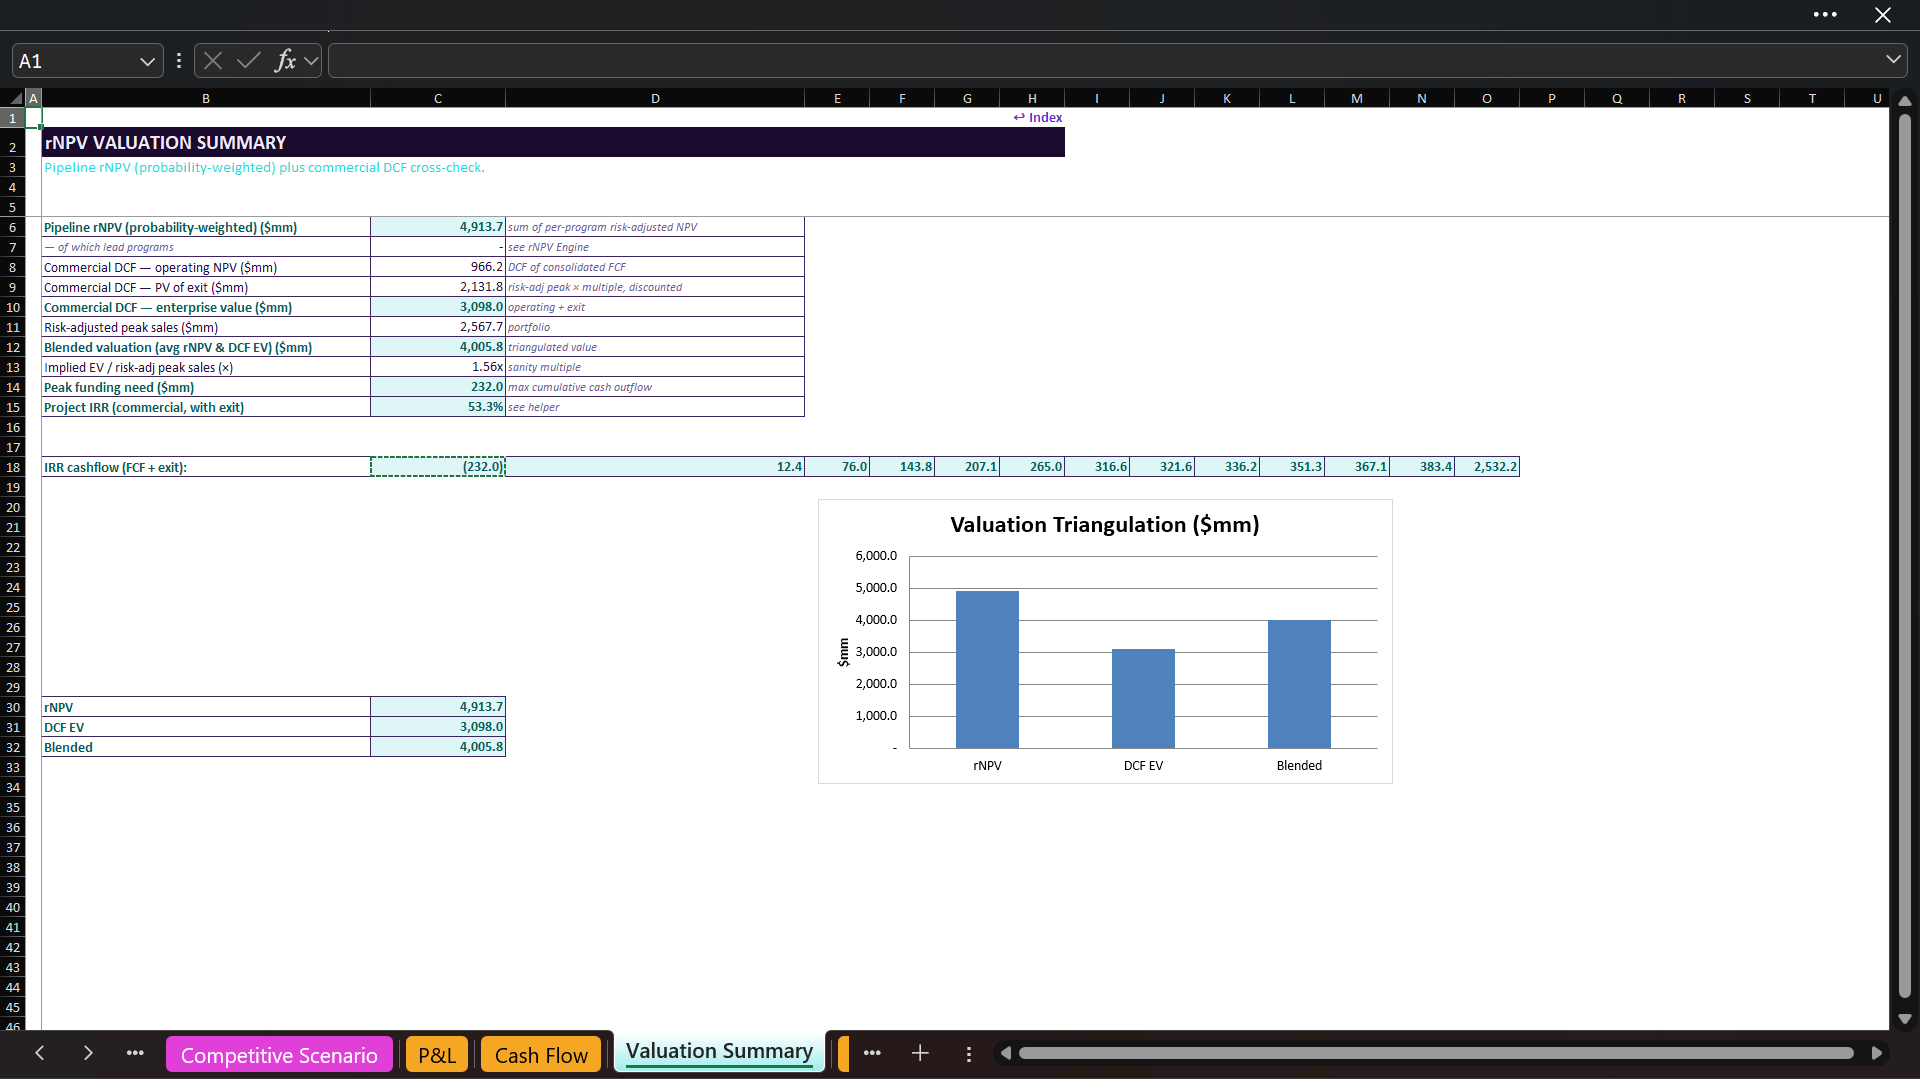
The Valuation Summary presents probability-weighted pipeline rNPV alongside a consolidated commercial DCF. The commercial DCF combines the NPV of forecast free cash flow with a discounted terminal value based on risk-adjusted peak sales and an exit multiple.
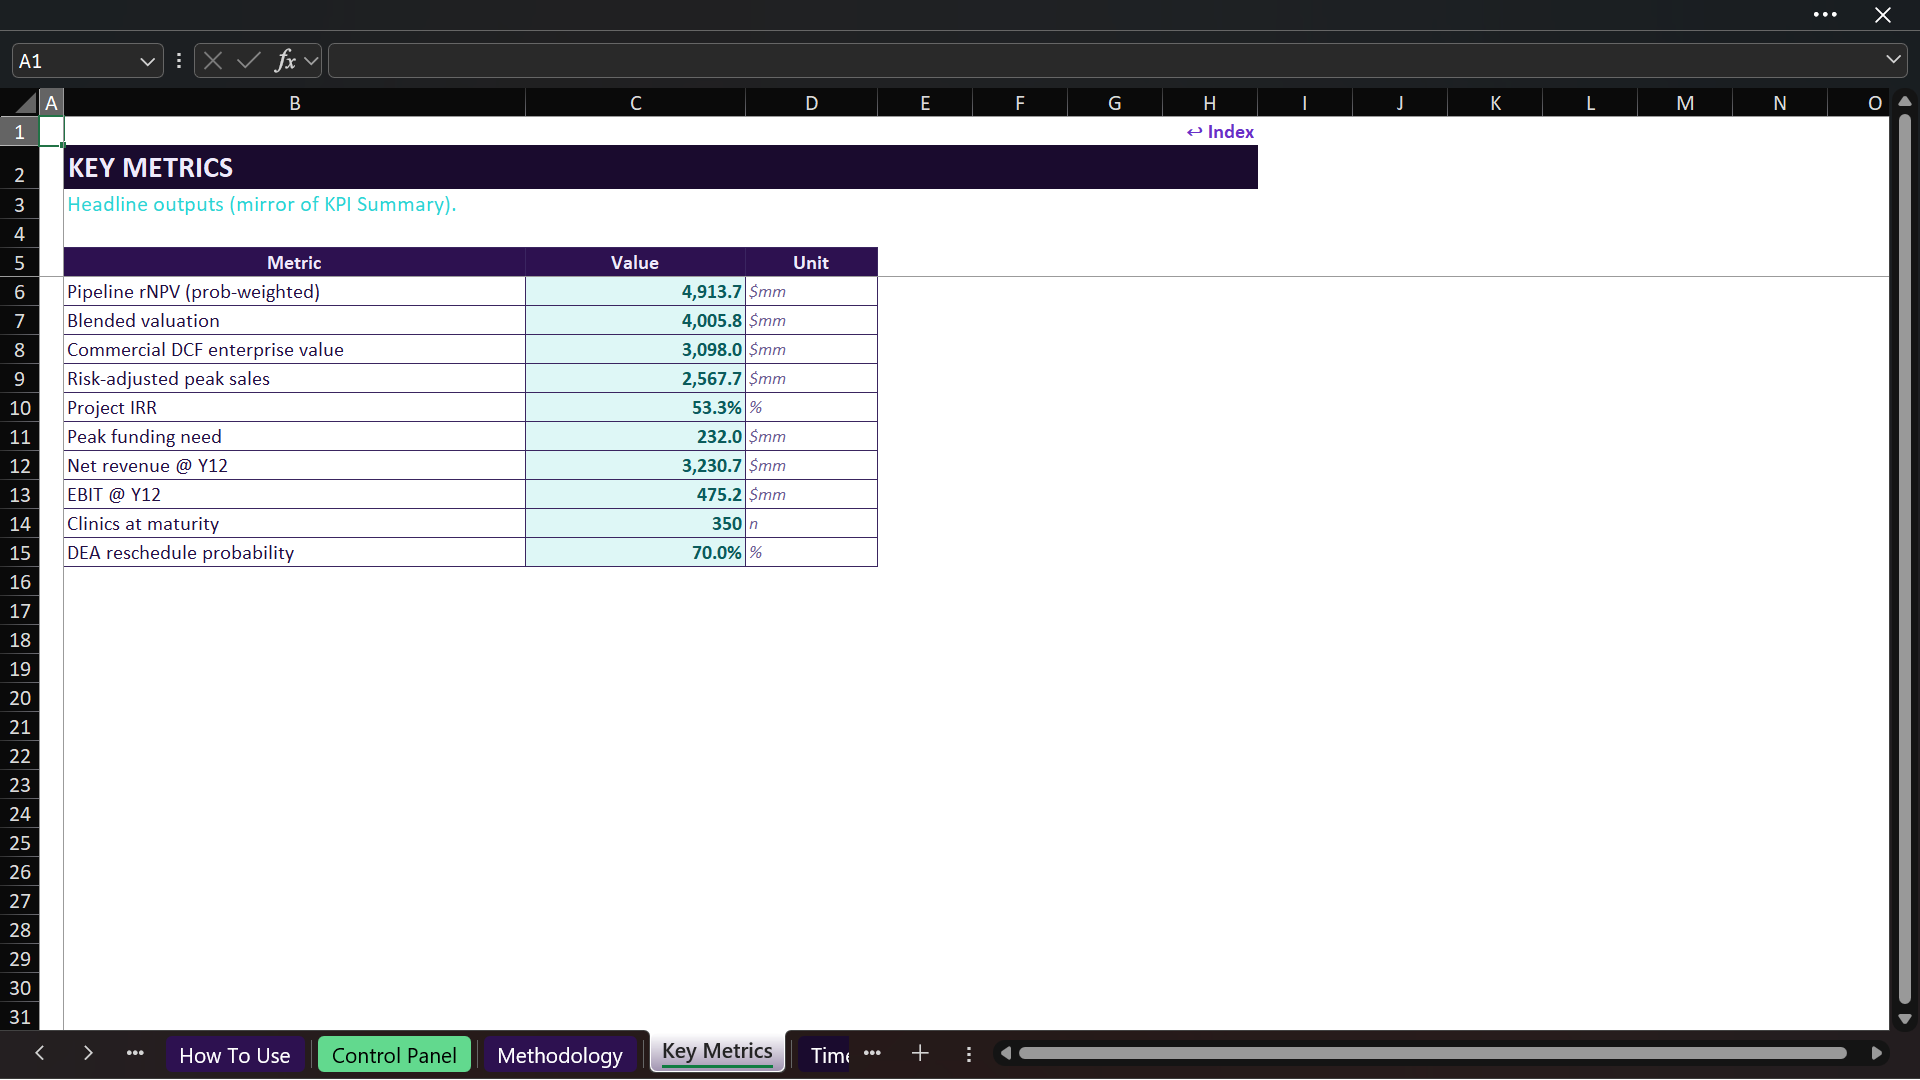
The model calculates pipeline rNPV, operating NPV, present value of the exit, commercial enterprise value, risk-adjusted peak sales, blended valuation, implied EV/peak-sales multiple, peak funding need, and commercial project IRR. The blended valuation averages the rNPV and commercial DCF views.

🌡️ SENSITIVITY TABLES & TORNADO ANALYSIS
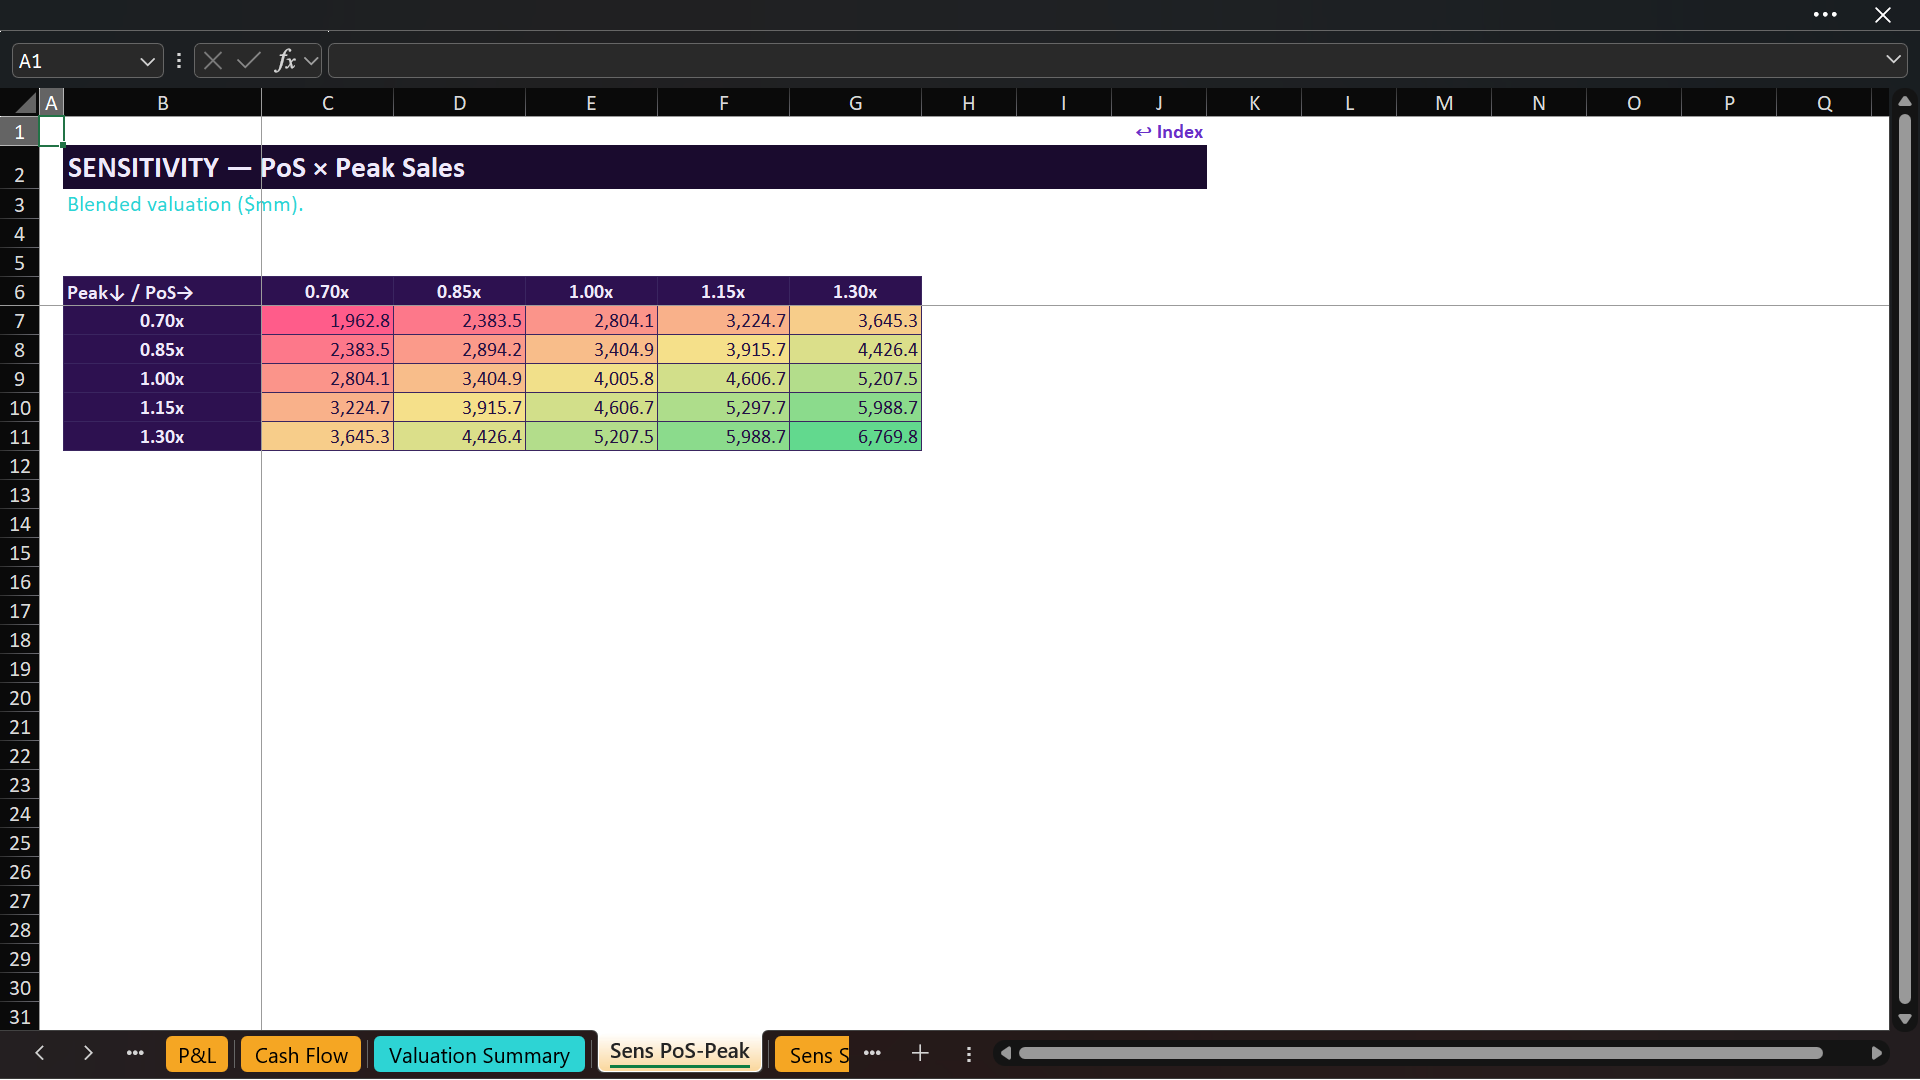
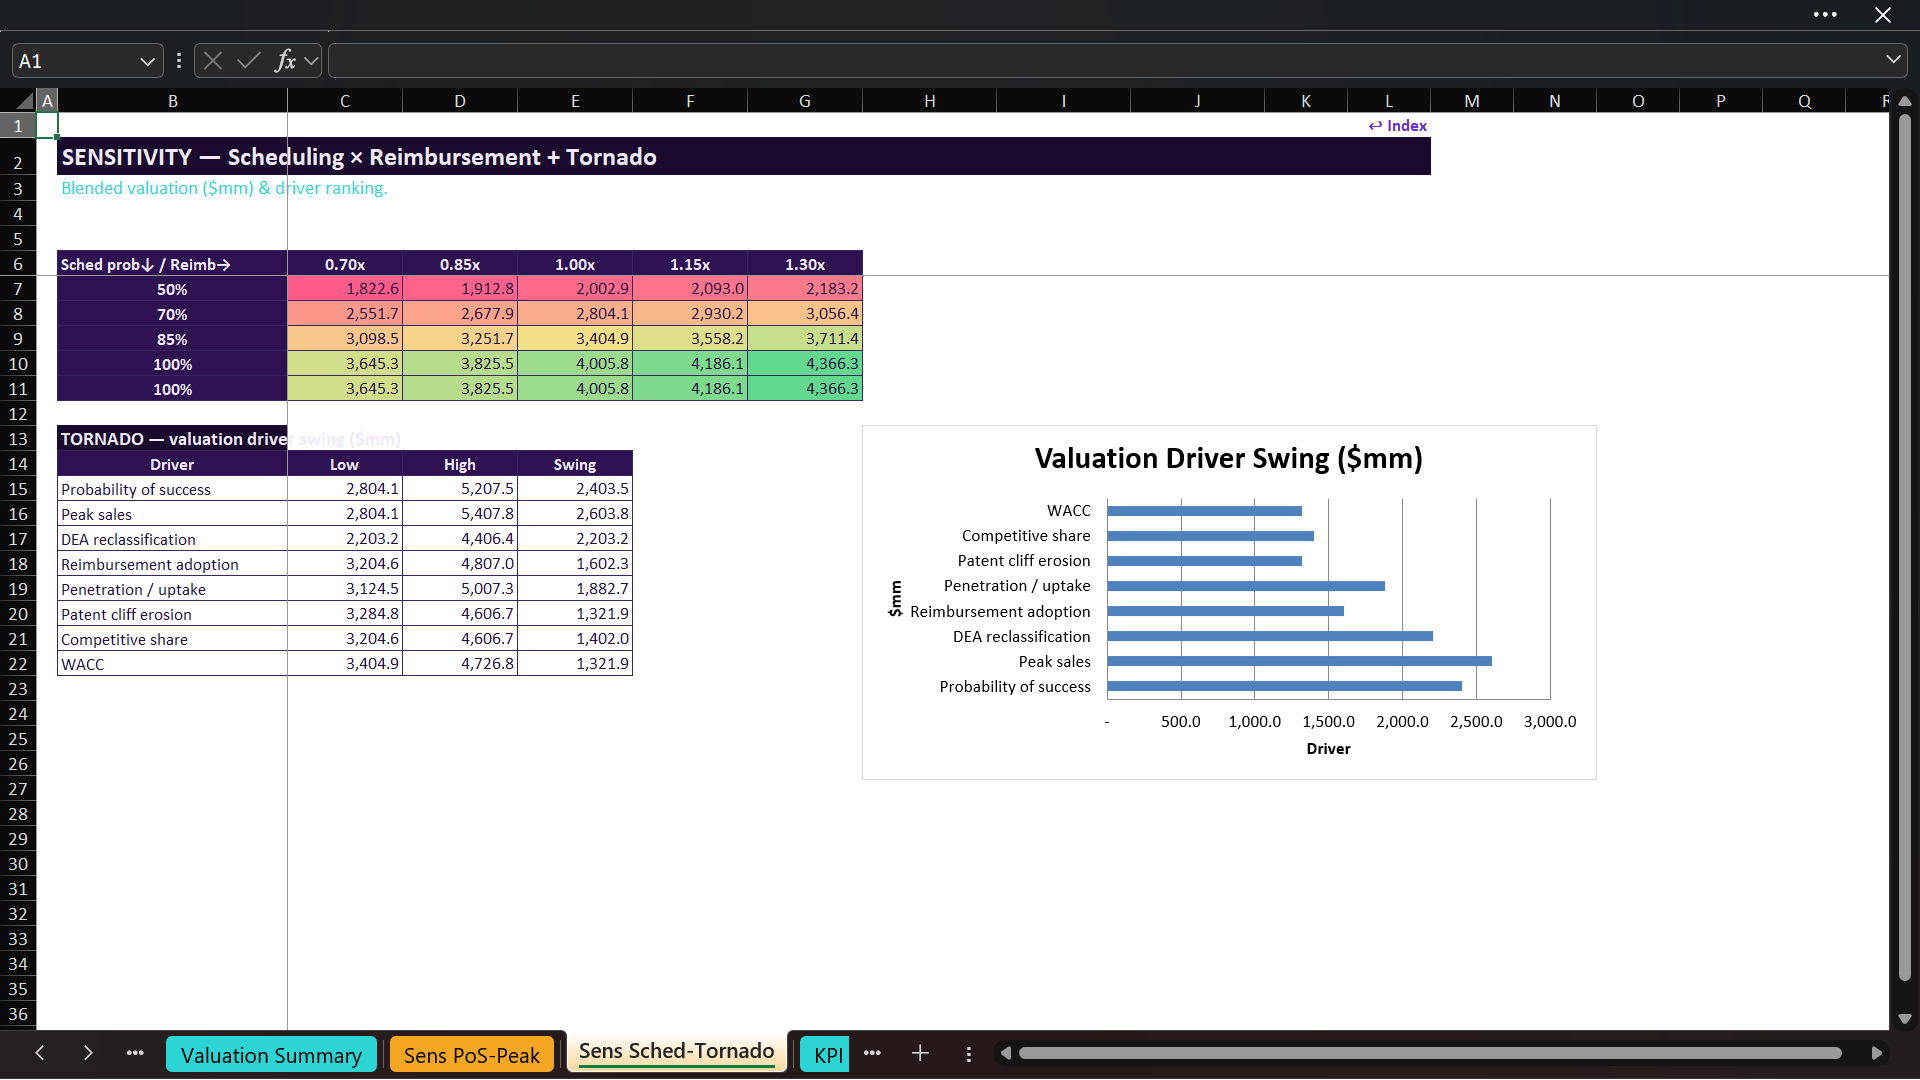
The workbook includes a probability-of-success versus peak-sales sensitivity grid and a scheduling-probability versus reimbursement sensitivity grid. A tornado analysis compares valuation changes driven by probability of success, peak sales, scheduling, reimbursement, penetration, patent erosion, competitive share, and WACC.

📊 TWO DASHBOARDS, KPI SUMMARY & 22 CHECKS
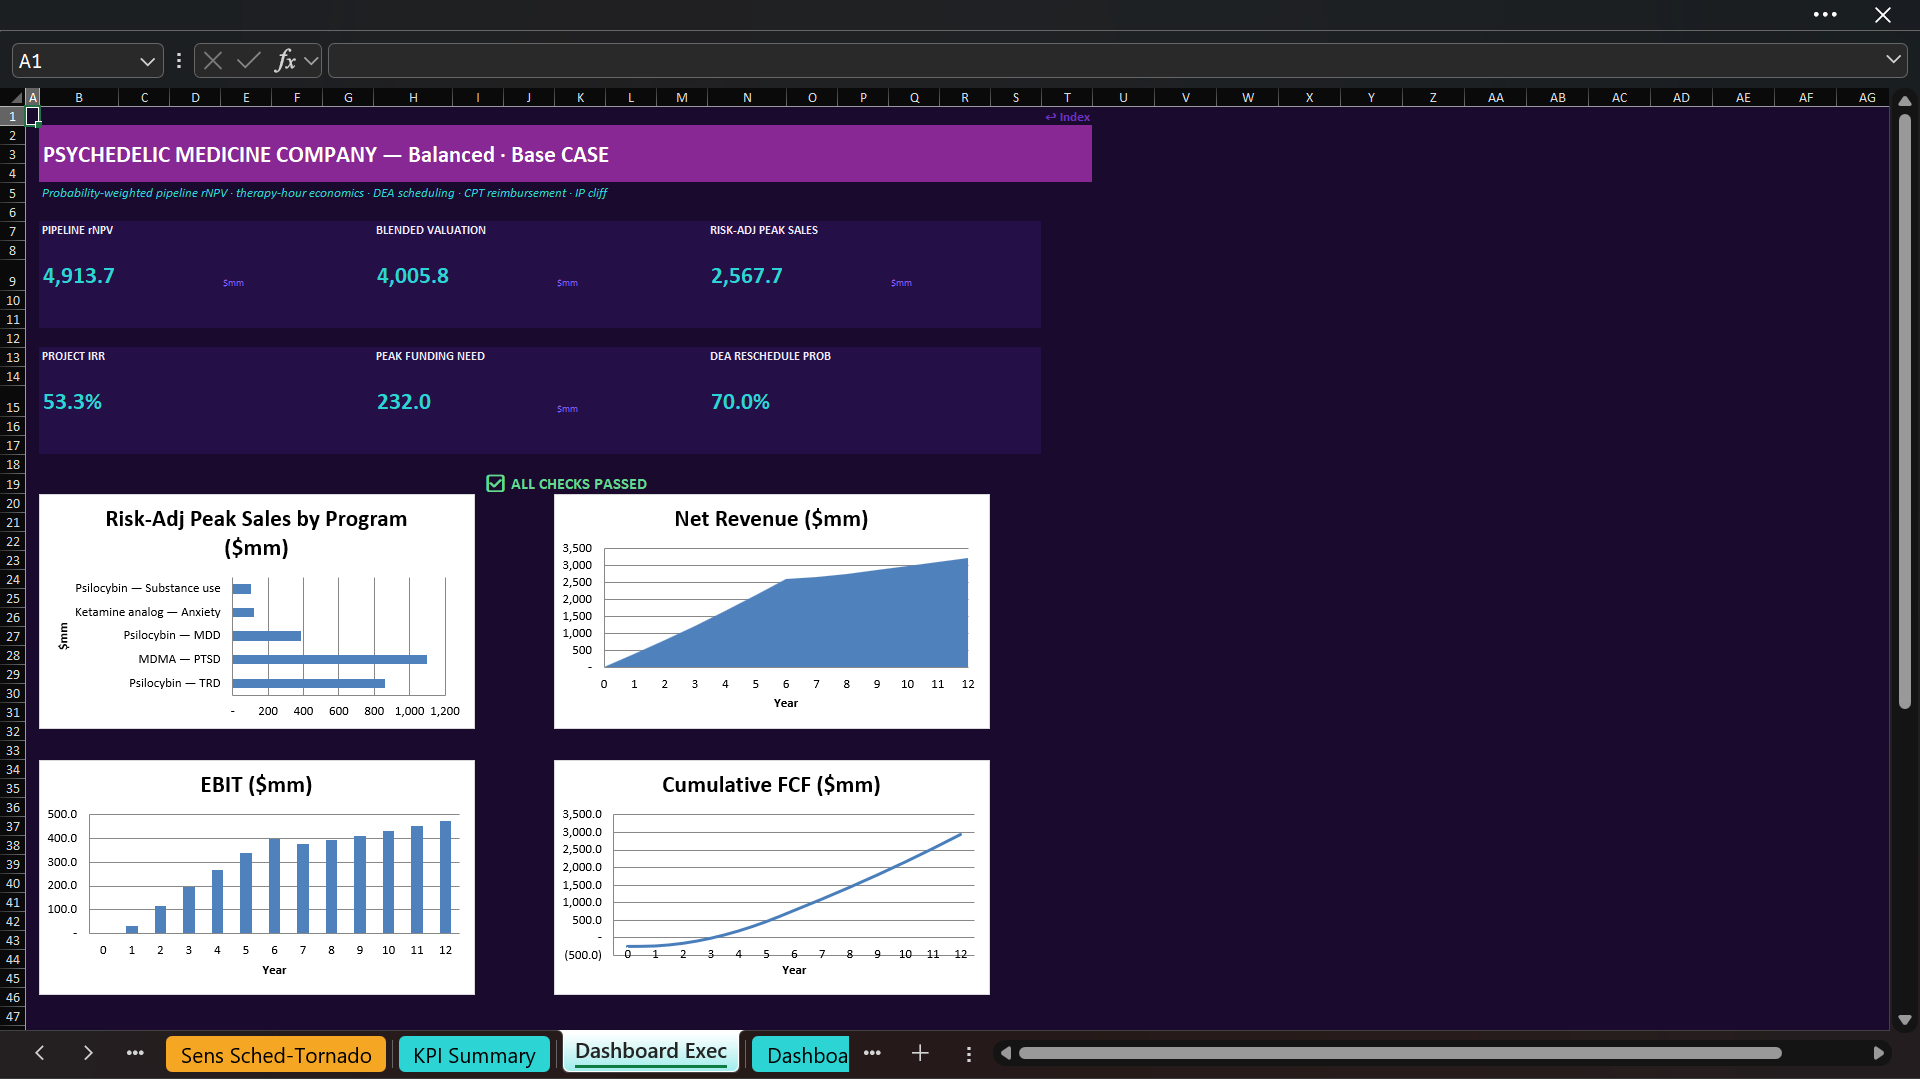
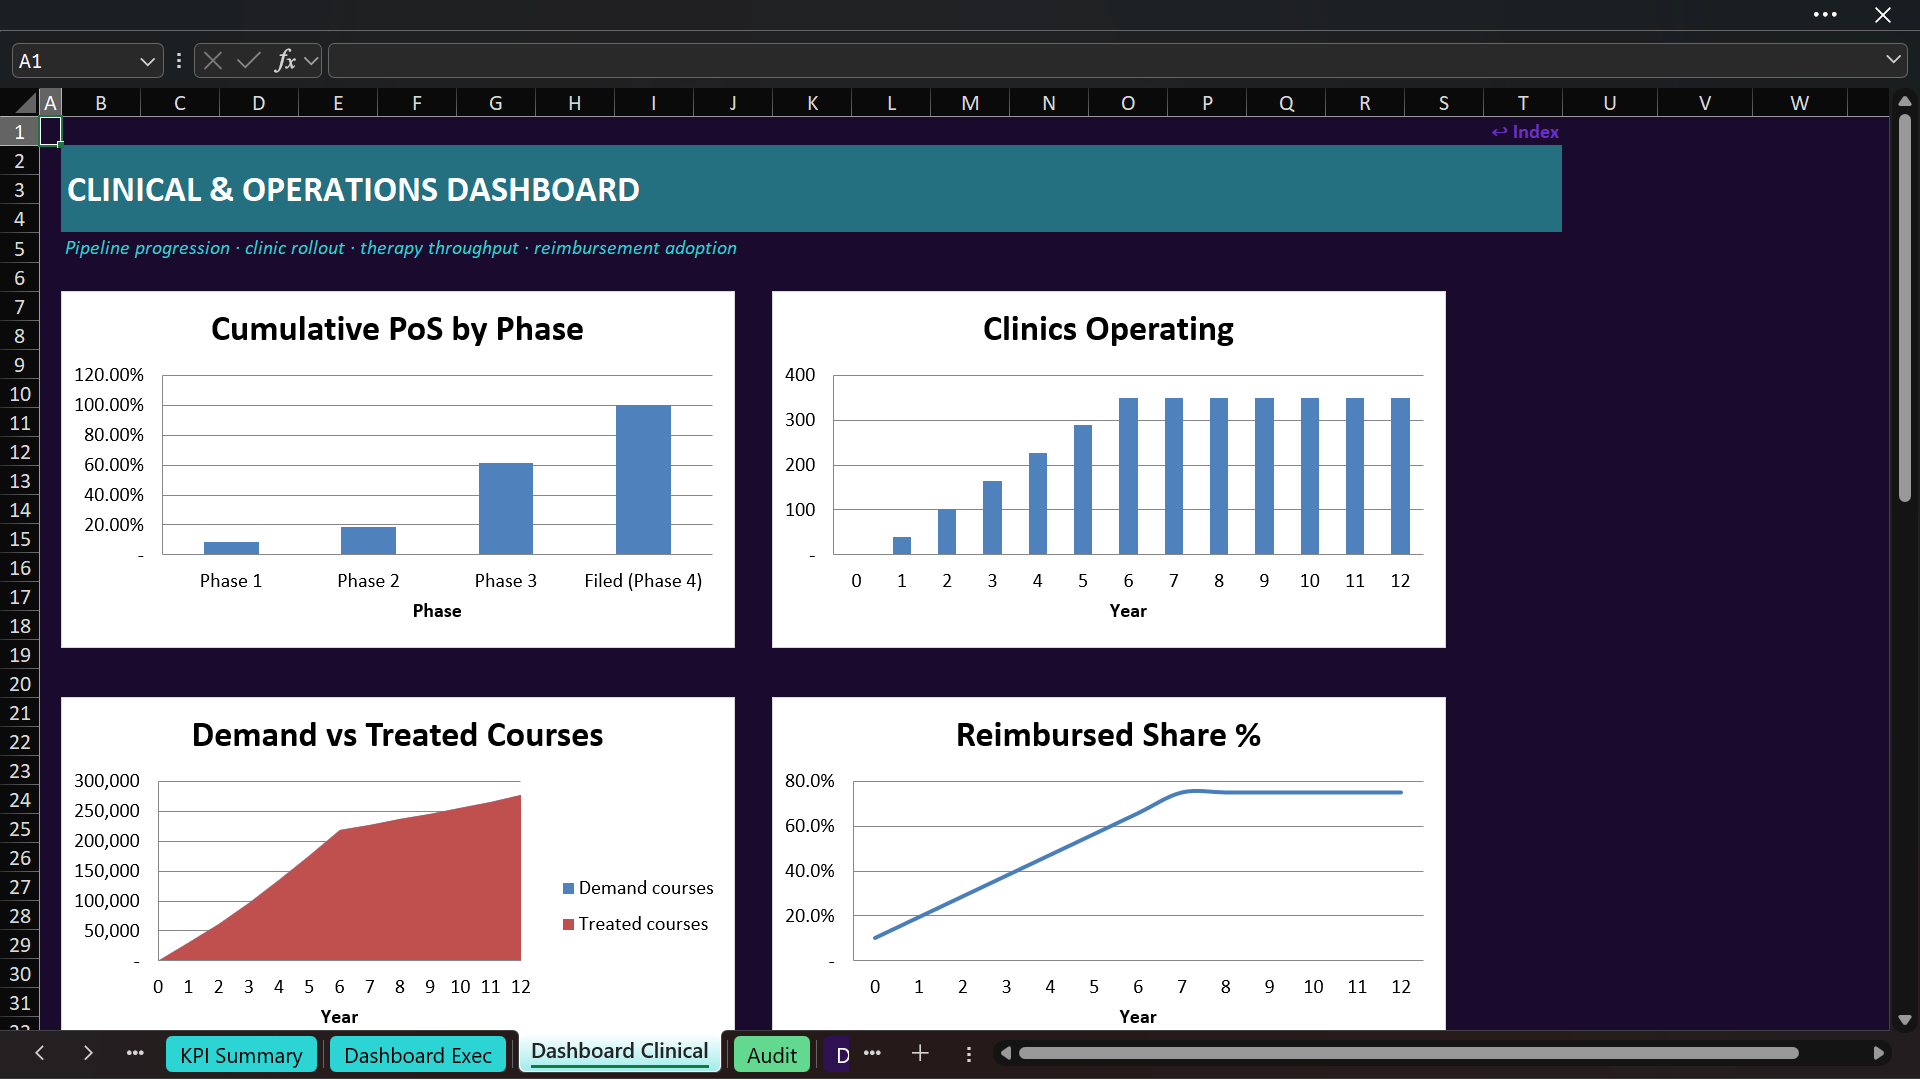
The Executive Dashboard presents headline valuation, commercial performance, pipeline value, revenue, EBIT, and cumulative cash flow. The Clinical & Operations Dashboard focuses on phase probability, clinic rollout, patient demand, treated courses, and reimbursement.
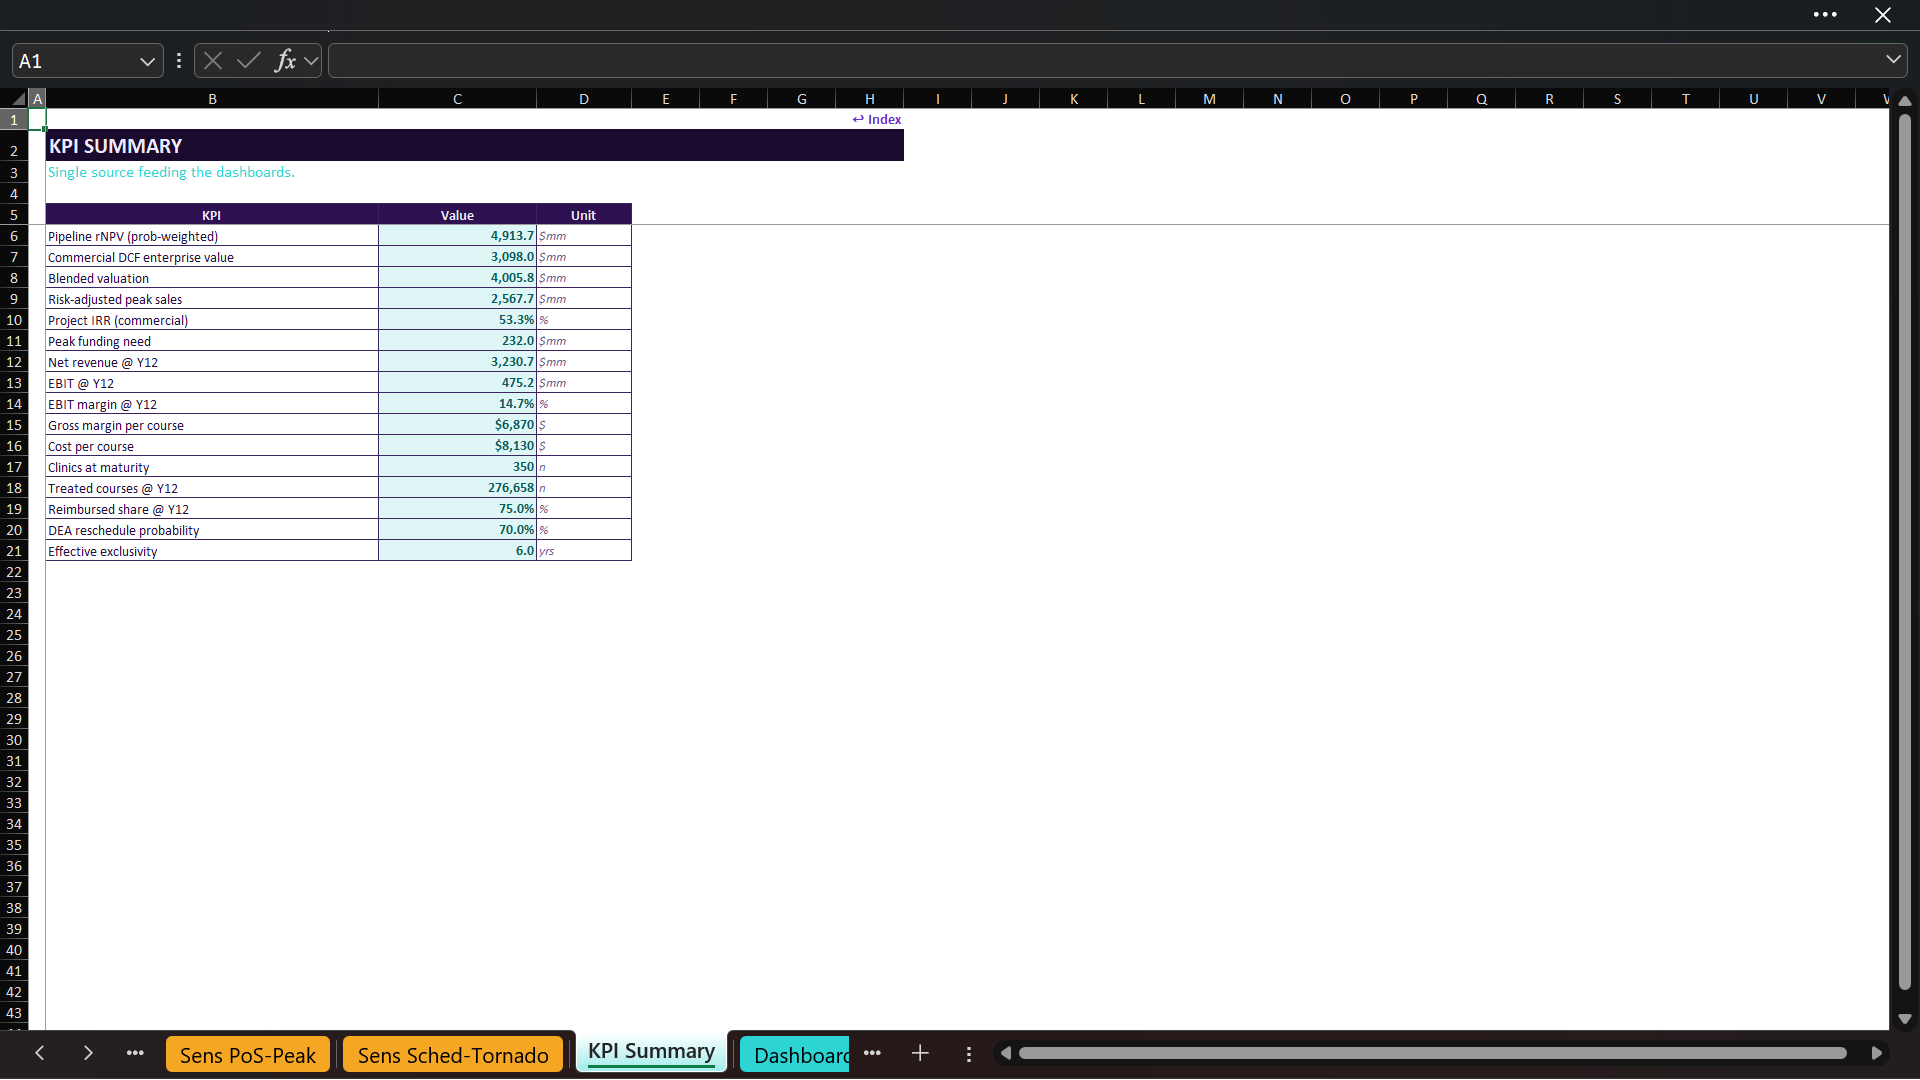
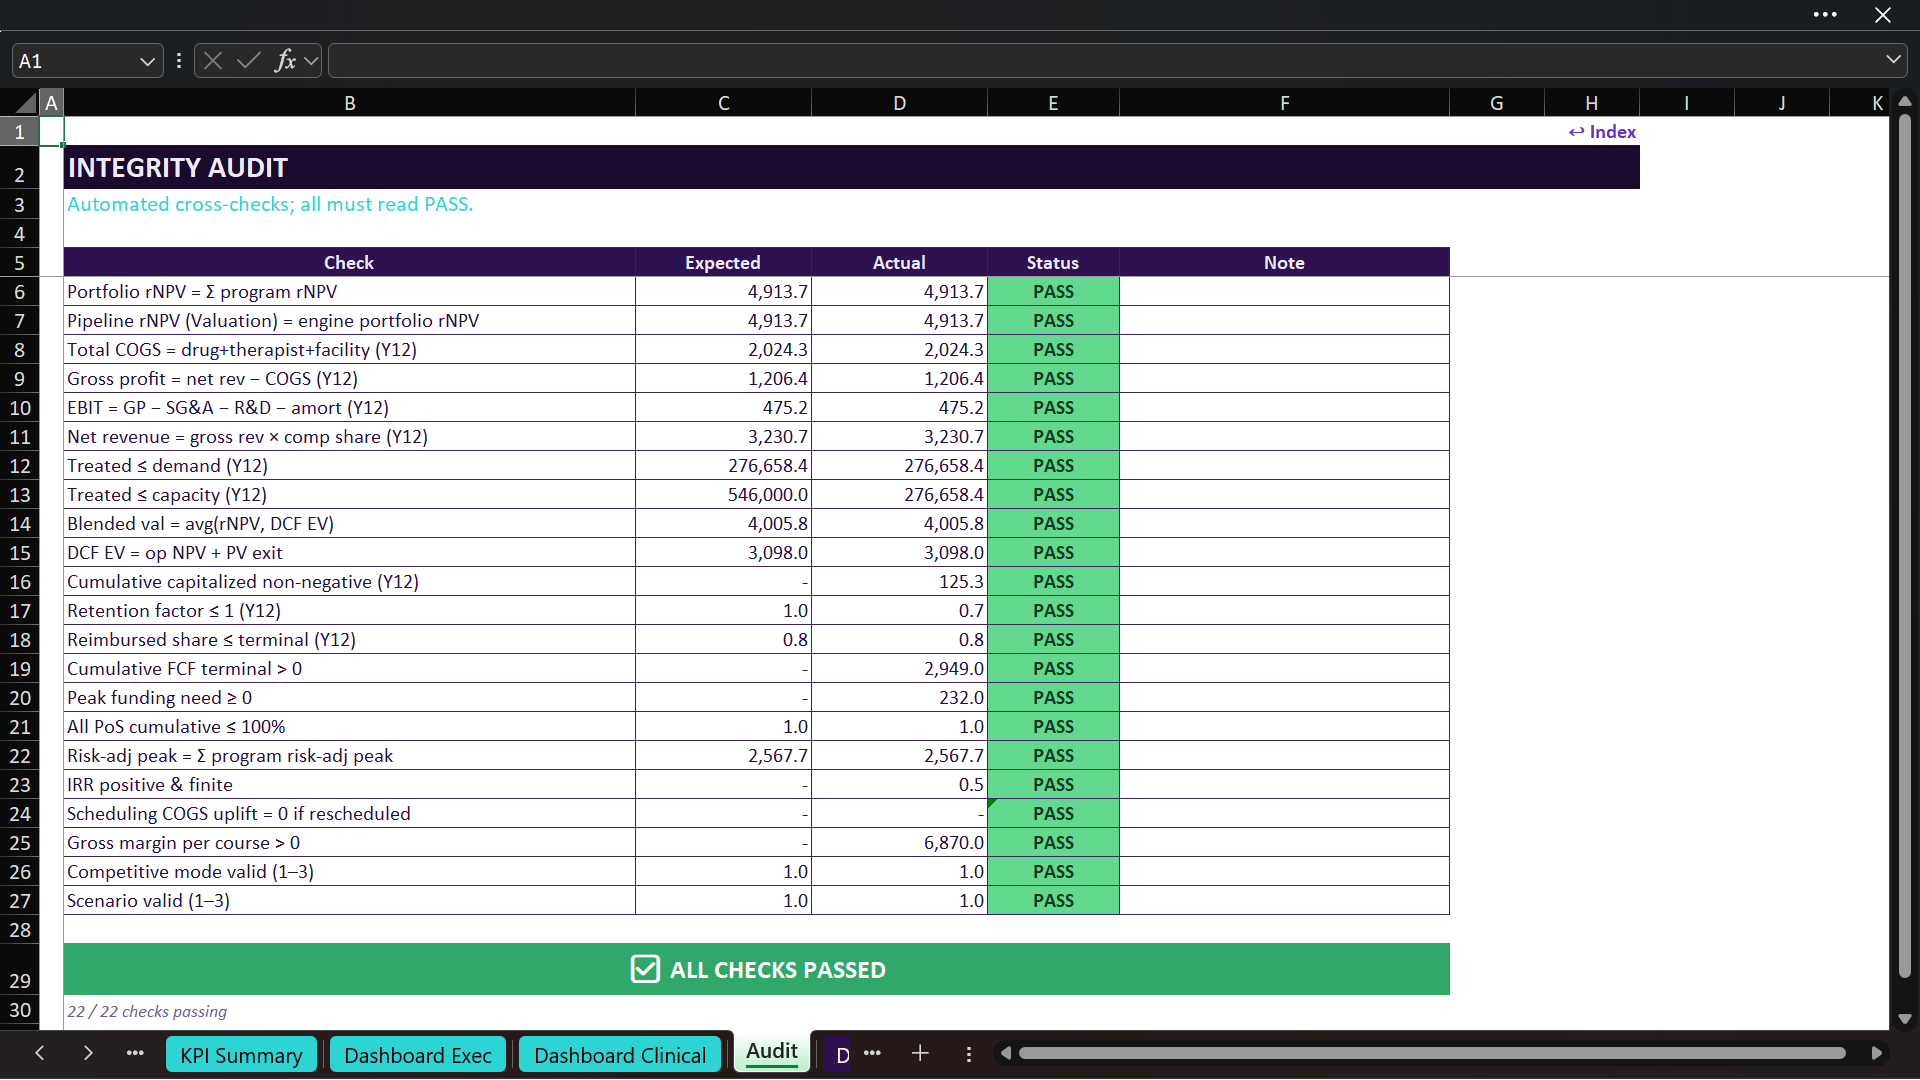
A KPI Summary consolidates the major outputs, while the Audit sheet performs 22 automated checks covering rNPV, valuation links, COGS, earnings, revenue, demand, capacity, DCF construction, capitalized spend, retention, reimbursement, cash flow, funding, probabilities, peak sales, IRR, scheduling cost, gross margin, competition, and scenario validity.

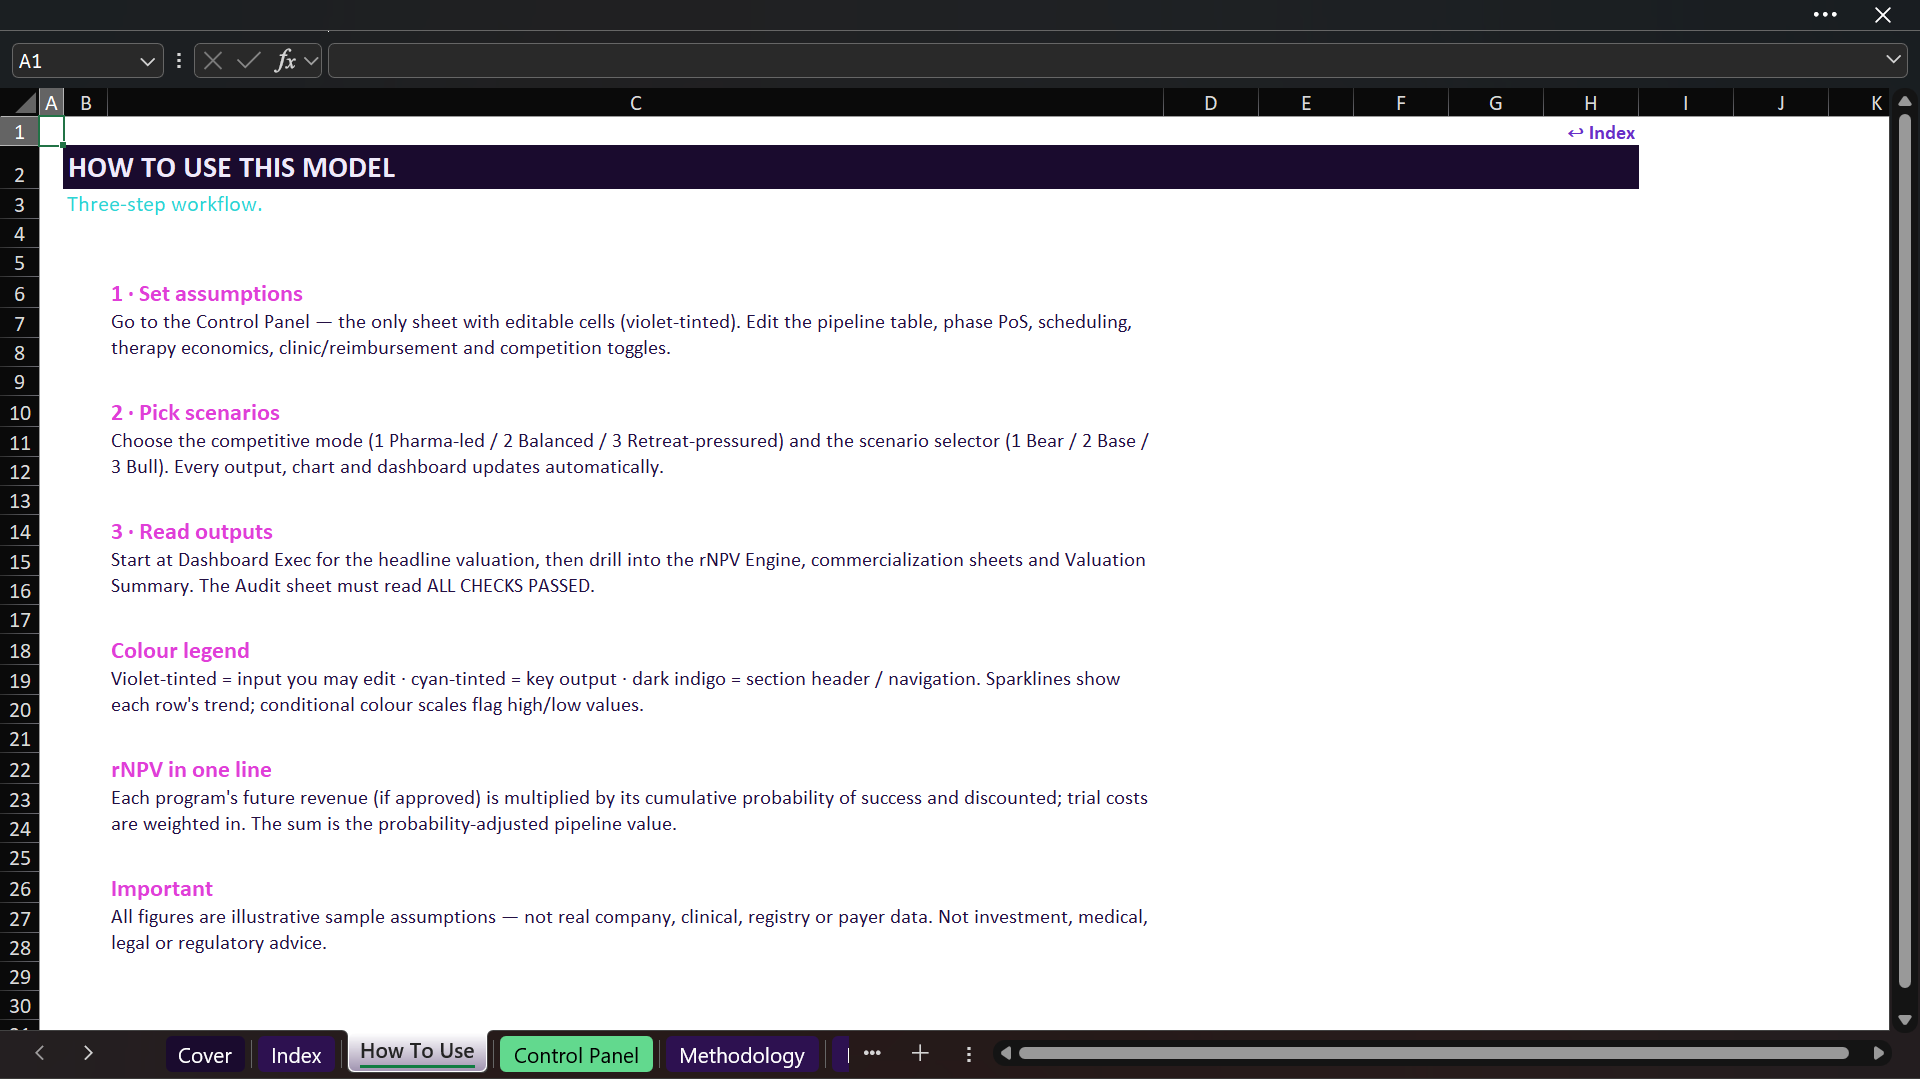
⚙️ HOW TO USE THE MODEL

  1. Save an untouched master copy and open a working version in Microsoft Excel.
  2. Go to the Control Panel and edit only the violet-tinted cells.
  3. Replace the illustrative pipeline, phase probabilities, launch timing, sales, scheduling, therapy, patient, clinic, reimbursement, IP, competition, cost, and valuation assumptions.
  4. Select Bear, Base, or Bull, or adjust individual inputs to create a custom case.
  5. Review the Pipeline Overview and rNPV Engine to understand asset-level value.
  6. Review the therapy, patient, clinic, reimbursement, IP, competition, P&L, cash-flow, and valuation schedules.
  7. Use the dashboards, KPI Summary, sensitivities, and tornado analysis for presentation and decision support.
  8. Confirm that the Control Panel validation flags and Audit checks remain clear.

📦 WHAT THE BUYER RECEIVES
• One fully editable Microsoft Excel workbook
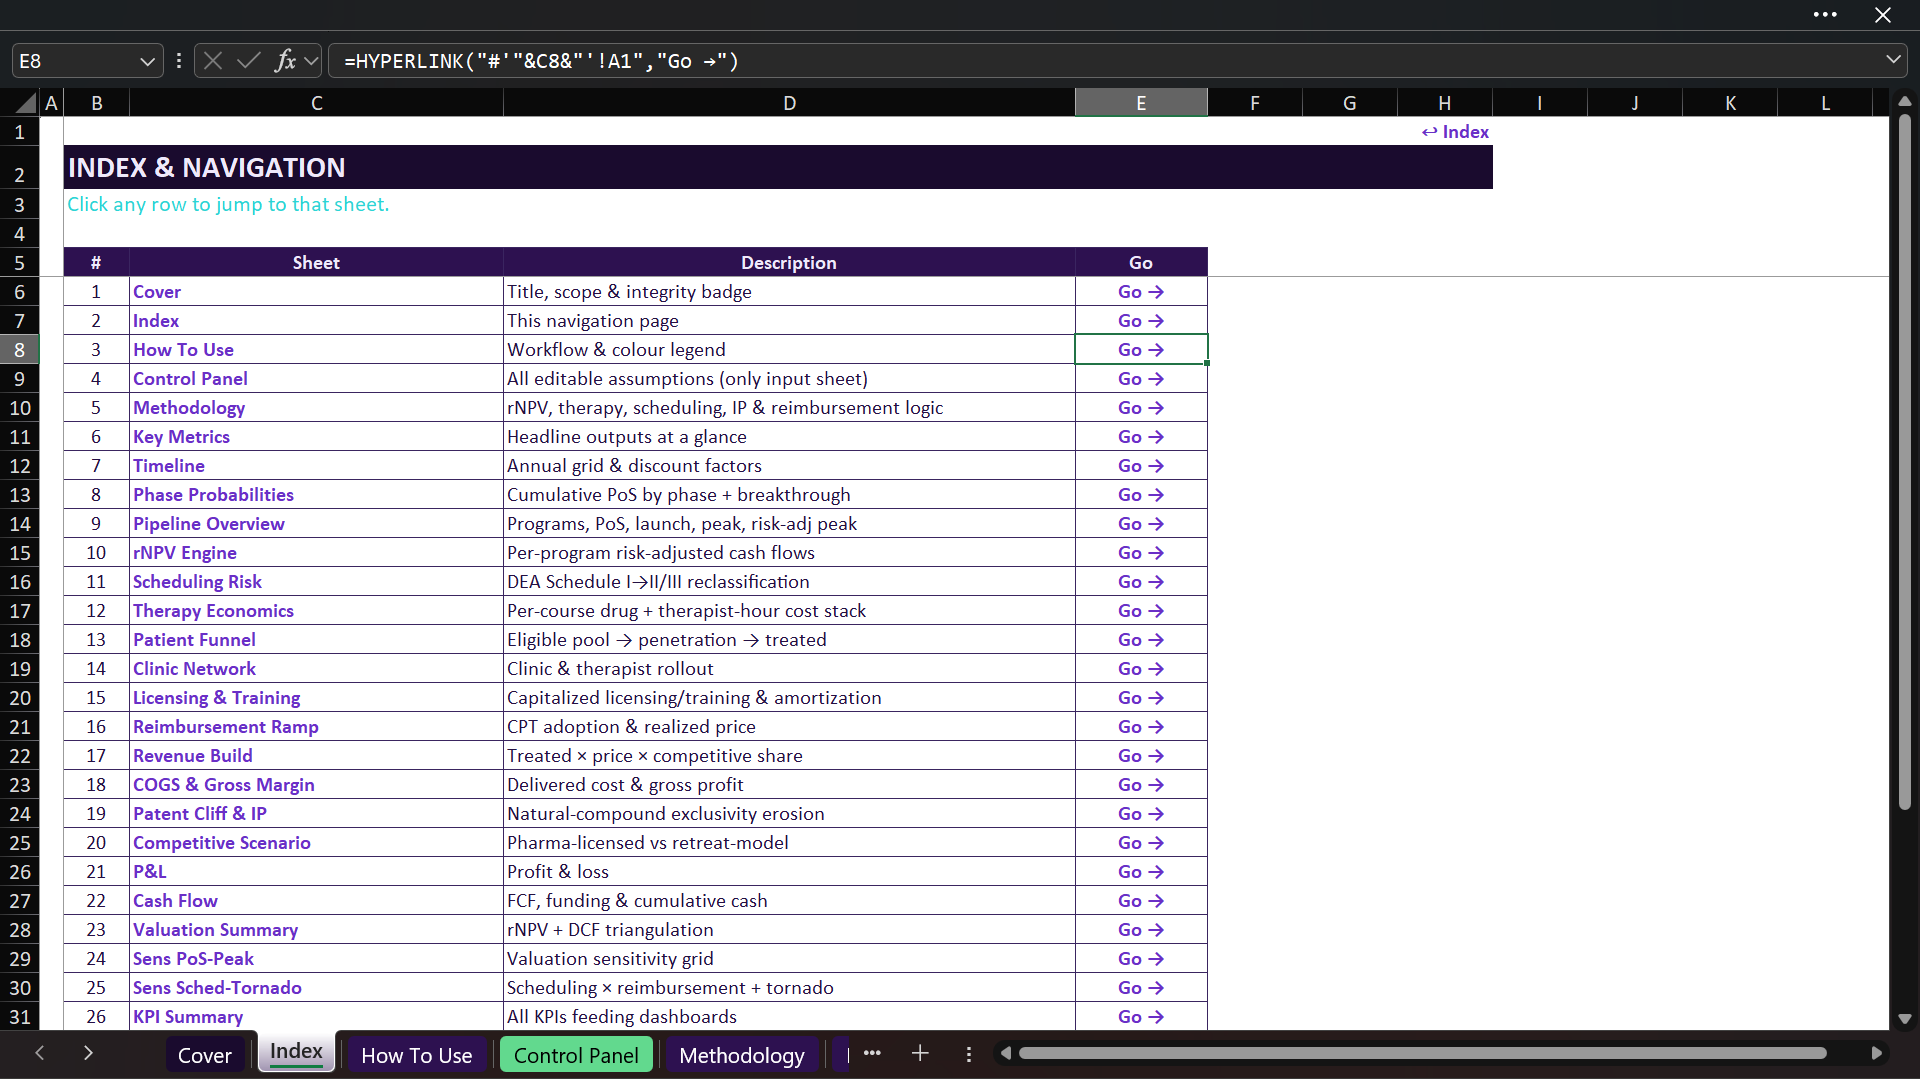
• 32 organized worksheets with navigation and instructions
• A 12-year forecast from Y0 through Y12
• Five editable illustrative pipeline programs
• Program-level rNPV and consolidated commercial DCF
• Bear, Base, and Bull scenario controls
• 22 embedded charts, two dashboards, and 22 automated checks
• A macro-free, self-contained workbook with no external file links
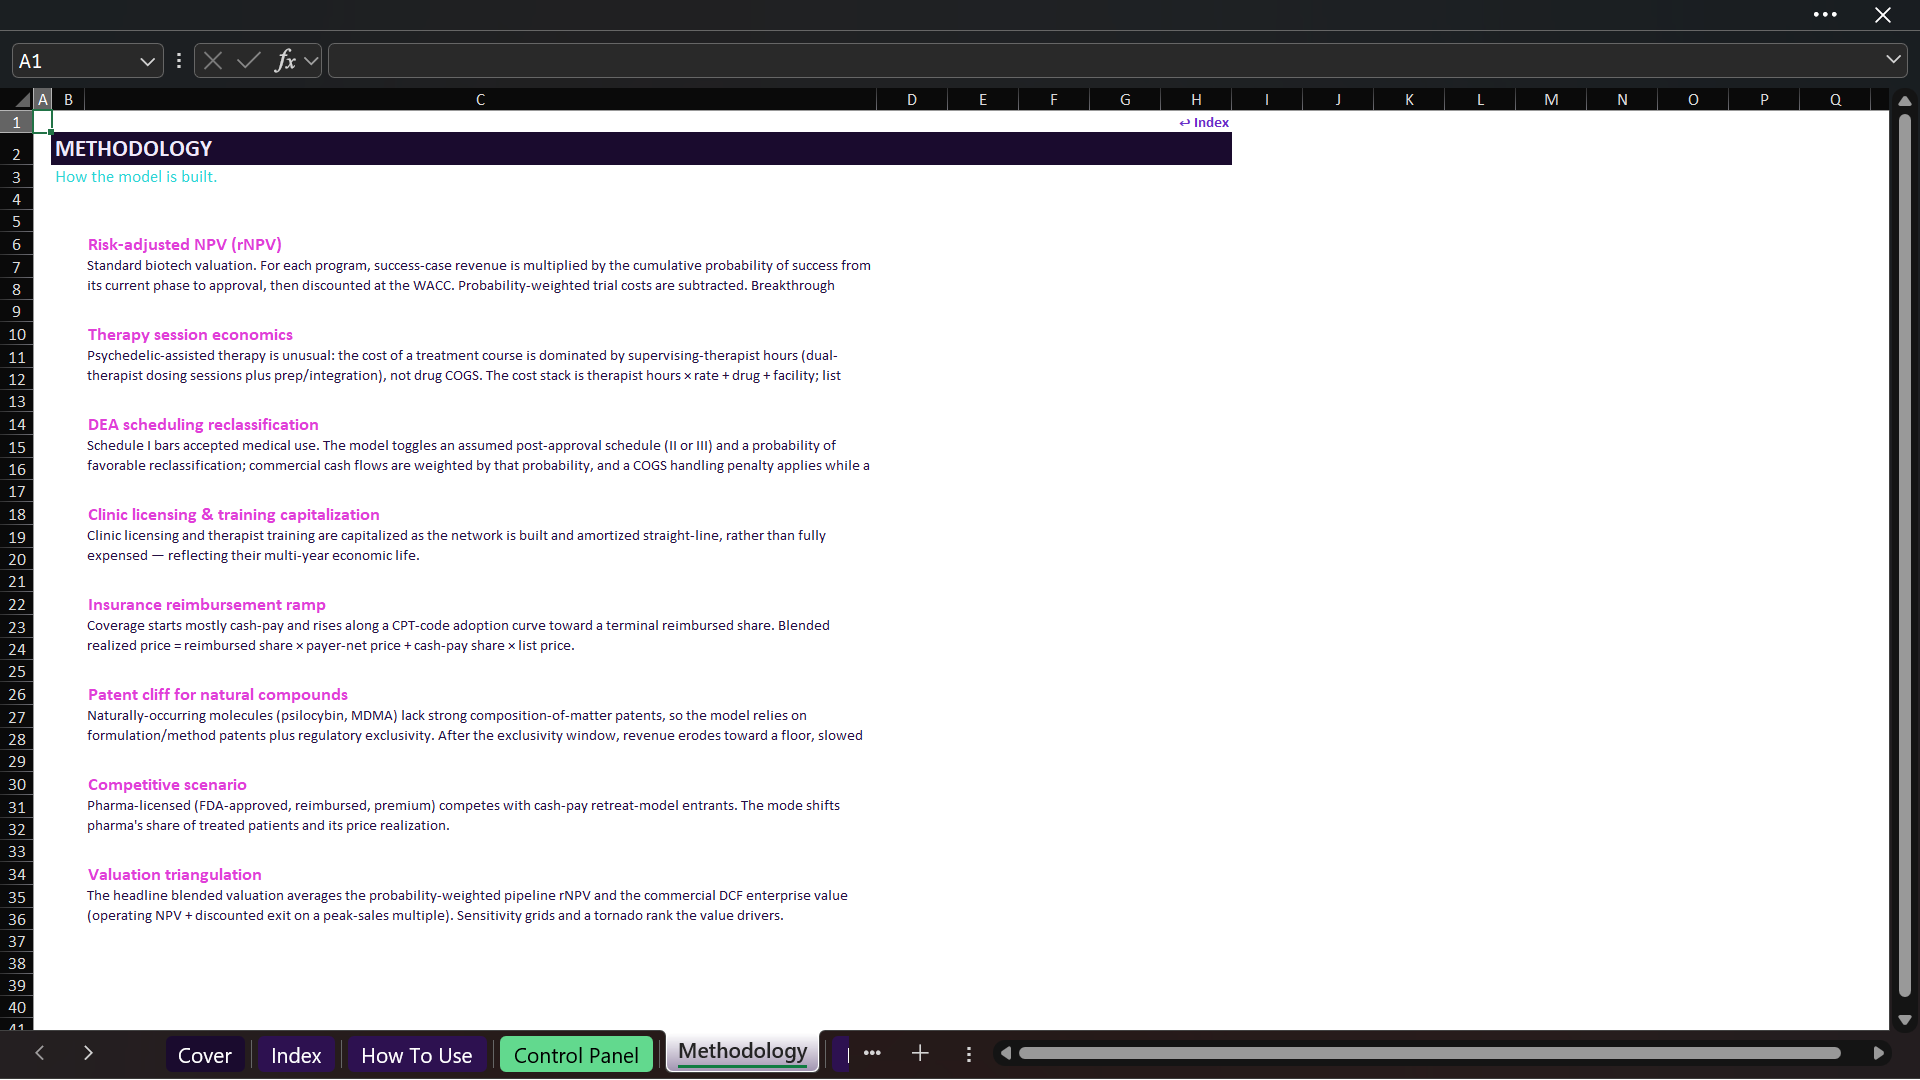
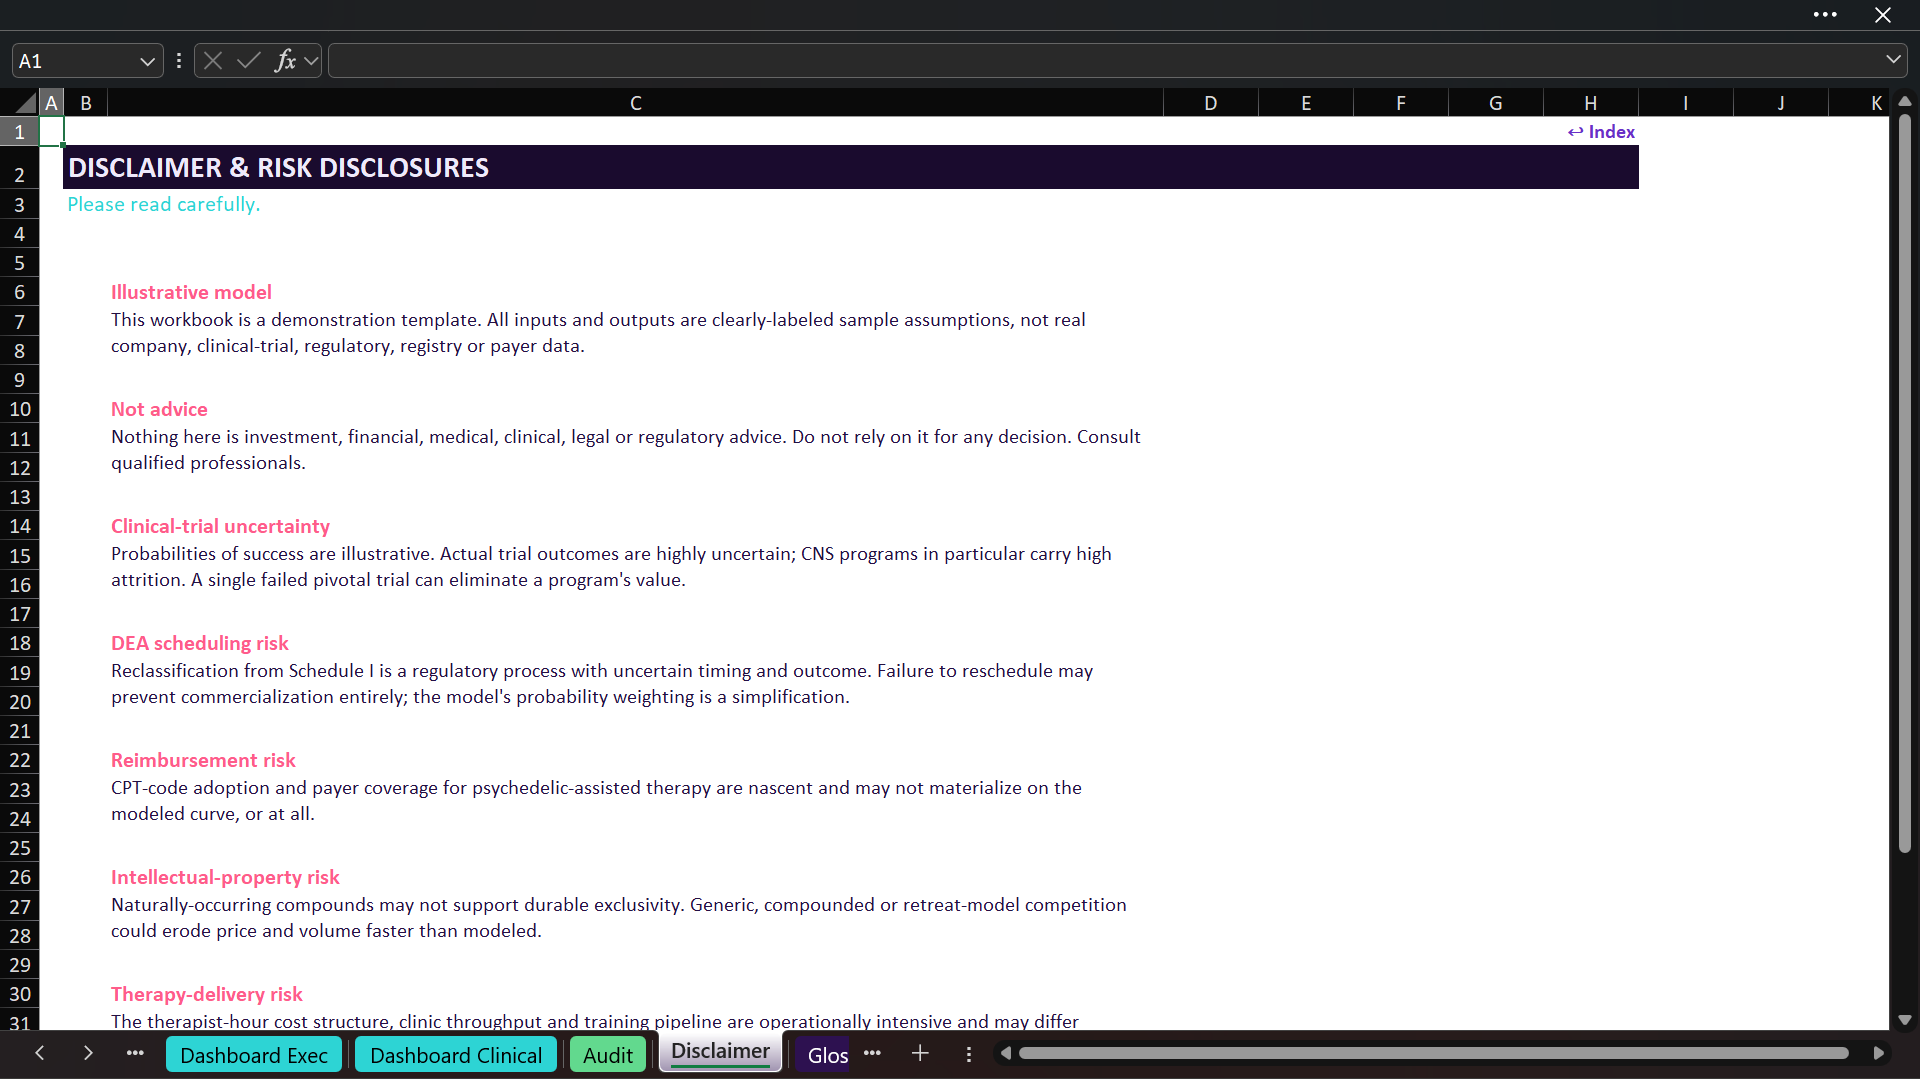
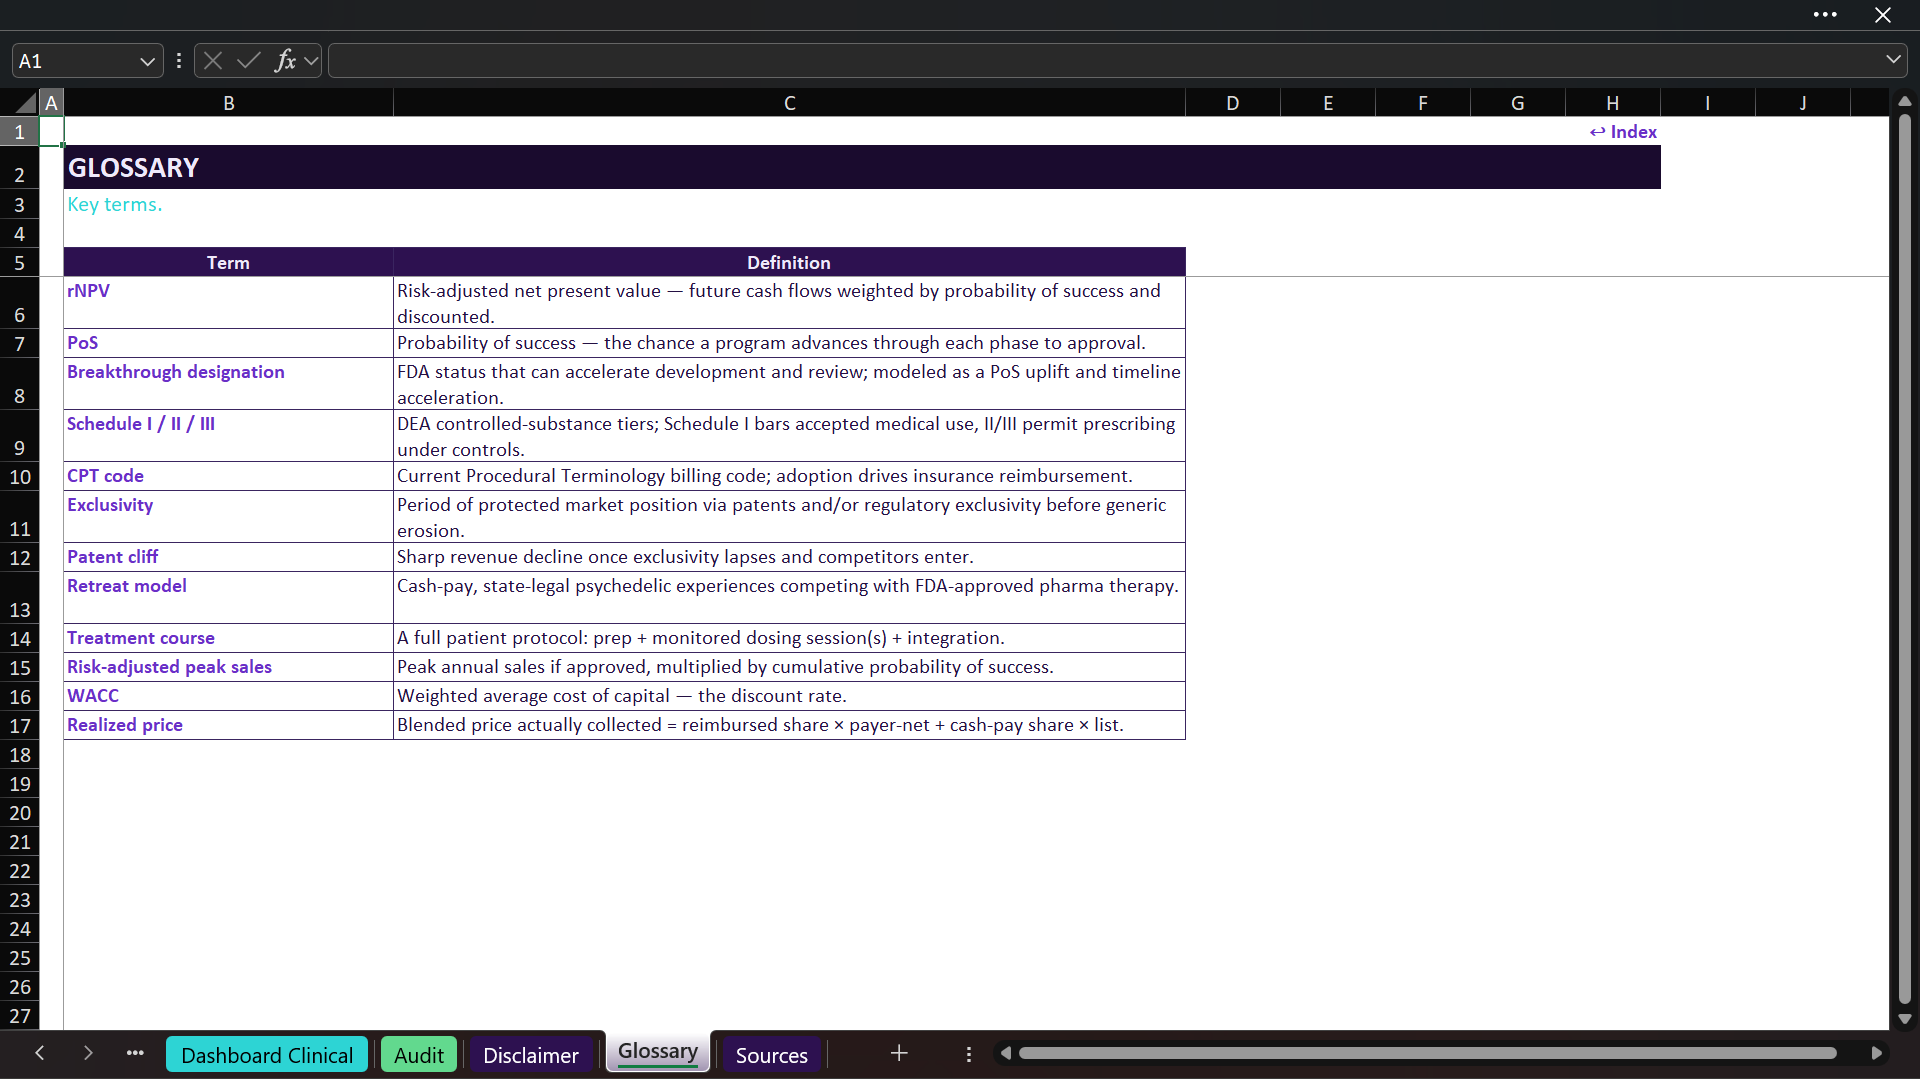
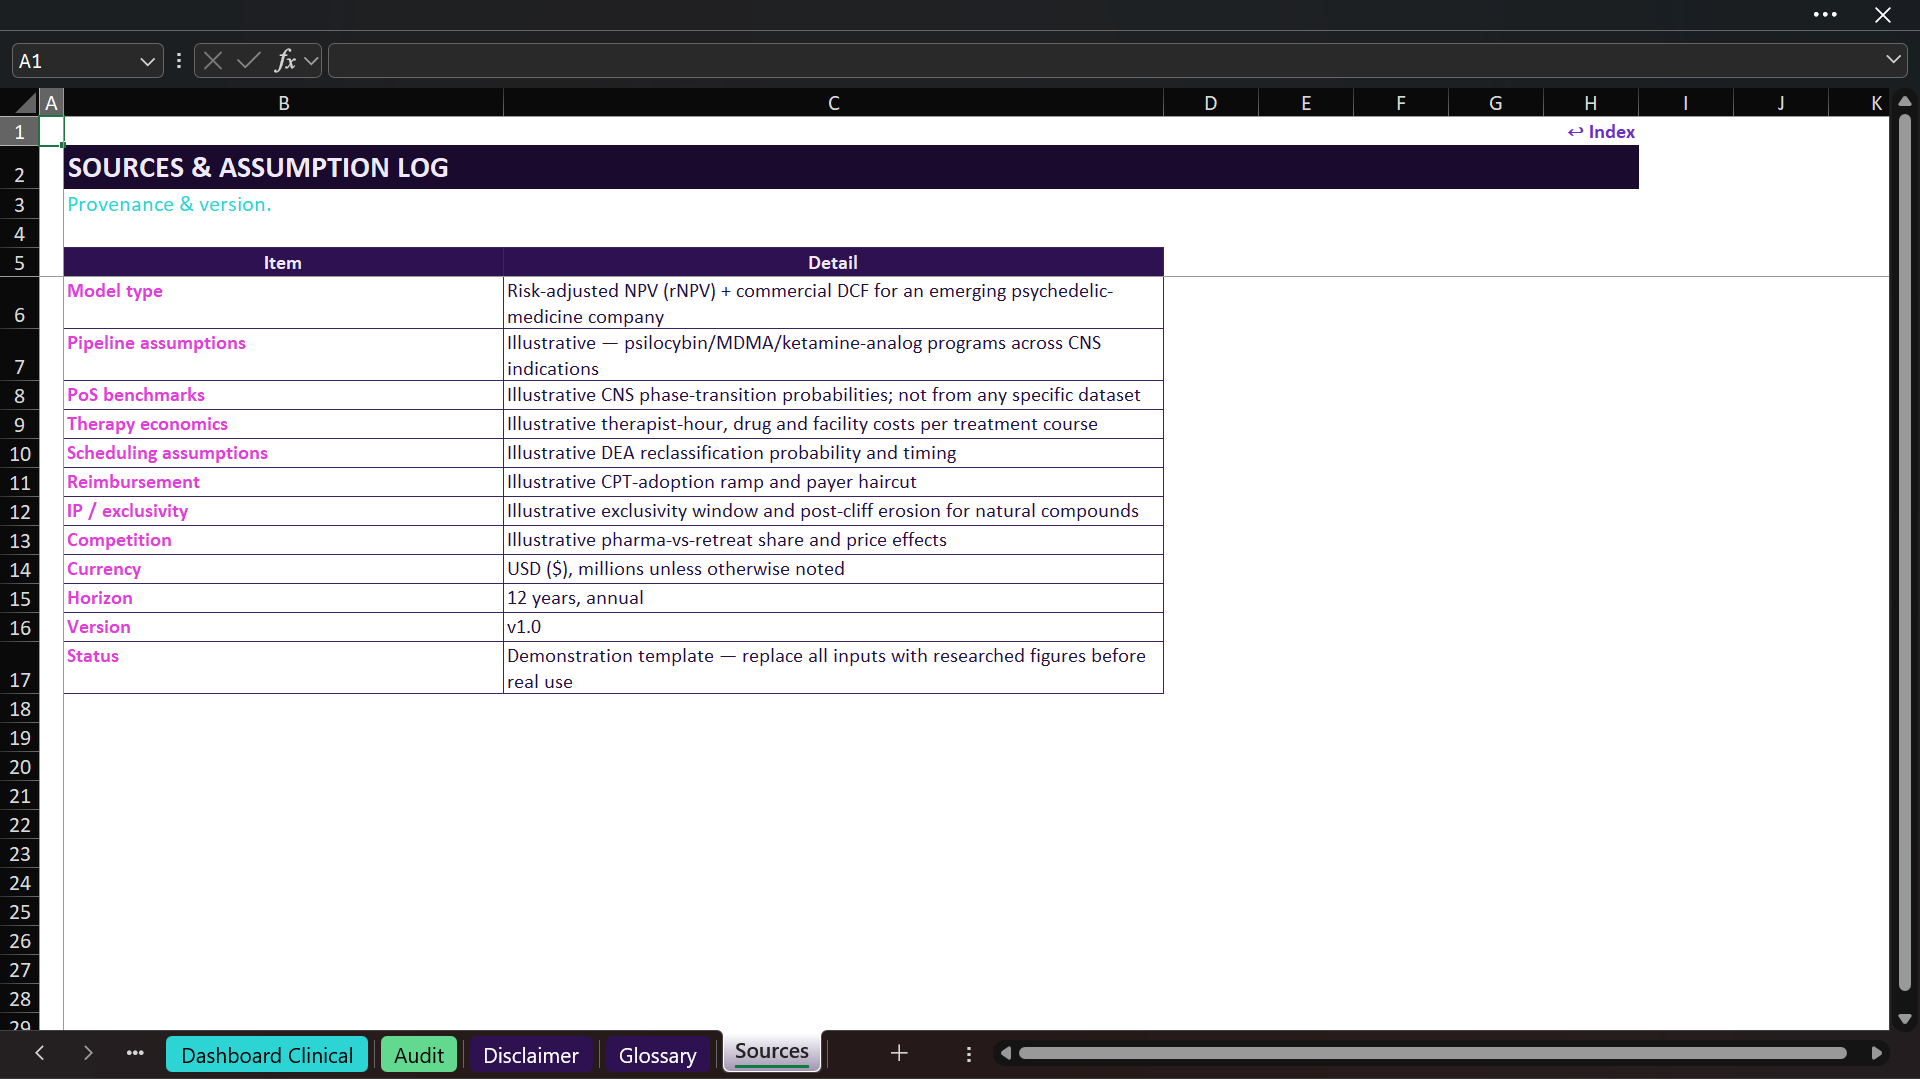
• Methodology, glossary, source/assumption log, and detailed risk disclosures

This Best Practice includes
1 Fully Editable Excel Model

Acquire business license for $95.00

Add to cart

Add to bookmarks

Discuss

Further information

• Estimate program and portfolio value using probability-adjusted, discounted clinical-development cash flows.
• Connect phase-transition probability, breakthrough status, launch timing, peak sales, and development cost to rNPV.
• Quantify scheduling and commercial-access risk rather than burying it entirely in the discount rate.
• Translate psychedelic-assisted therapy protocols into delivered cost and course-level gross margin.
• Forecast patient adoption, clinic rollout, therapist requirements, reimbursement, and realized pricing.
• Model exclusivity loss, post-cliff erosion, and competition from alternative delivery channels.
• Forecast revenue, earnings, free cash flow, and peak funding need.
• Compare pipeline rNPV with a commercial DCF and calculate a blended valuation.
• Test downside and upside cases through scenarios, sensitivity tables, and tornado analysis.
• Create decision-ready outputs for fundraising, licensing, portfolio review, and investment analysis.

• Evaluating a clinical-stage psychedelic-medicine company or related CNS drug-development portfolio.
• Preparing an investor case, fundraising plan, licensing analysis, corporate-development review, or feasibility study.
• Comparing multiple compounds and indications at different clinical stages.
• Testing how probability of success, peak sales, launch timing, scheduling, reimbursement, and exclusivity affect value.
• Assessing therapy-delivery economics that depend heavily on therapist hours, clinic capacity, and patient throughput.
• Building a long-range commercial forecast that connects pipeline risk to P&L, cash flow, funding, and valuation.
• Creating a structured starting point that can be customized with company-specific research.

• Patient-level clinical data, adverse-event monitoring, efficacy statistics, or trial-site operations must be analyzed.
• A pharmacokinetic, pharmacodynamic, dose-response, protocol-design, or clinical-trial simulation is required.
• A single approved pharmaceutical product needs a conventional prescription-volume model without therapy delivery or pipeline risk.
• Monthly or quarterly forecasting is essential; the workbook uses annual periods from Y0 through Y12.
• Regulatory, medical, reimbursement, tax, legal, or patent advice is required.
• The illustrative assumptions have not been replaced and validated for the specific programs, jurisdictions, and treatment protocols being evaluated.
• A user expects guaranteed approval, commercialization, reimbursement, or investment outcomes.


0.0 / 5 (0 votes)

please wait...