
Publication number: ELQ-10729-1
View all versions & Certificate

Excel Project Tracking Dashboard Template | Multi-Step Task Manager
Excel multi-step project tracking dashboard with automated progress, task control, and visual reports. Perfect for managing structured projects efficiently.
Business Planning and Project Management Professional | Top Rated Freelancer at Fiverr | CERT 5 at PeopleperhourFollow 17
Take full control of your projects with a structured, visual, and automated Excel dashboard designed for multi-step workflows. This template helps teams and individuals manage complex projects with clarity, consistency, and zero guesswork.
Whether you manage IT projects, construction phases, business operations, or personal workflows, this tracker adapts to your structure and scales easily.
π Key Features
β 10 structured project steps with 10 tasks each β Automated progress tracking per step β Dynamic dashboard charts β Color-coded status system β Built-in conditional formatting β Clean professional layout β Ready-to-brand with your logo β No macros required β Fully editable and expandable
Everything updates automatically as you enter task progress.
π Dashboard & Graphs
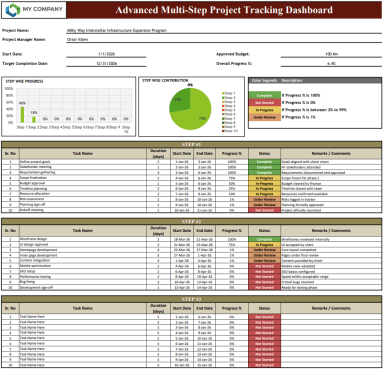
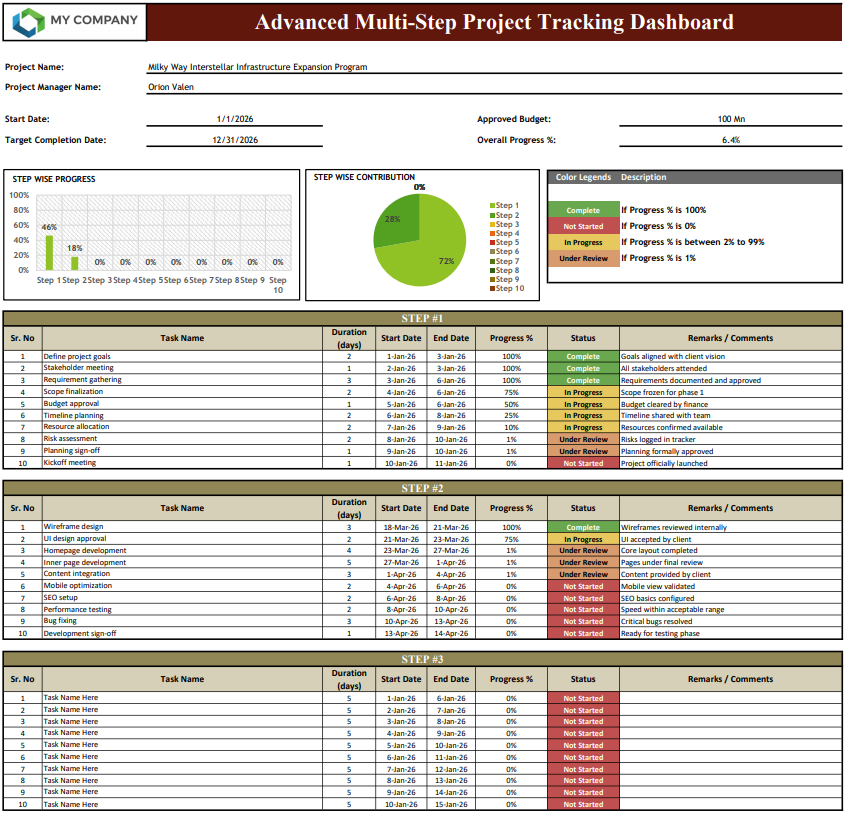
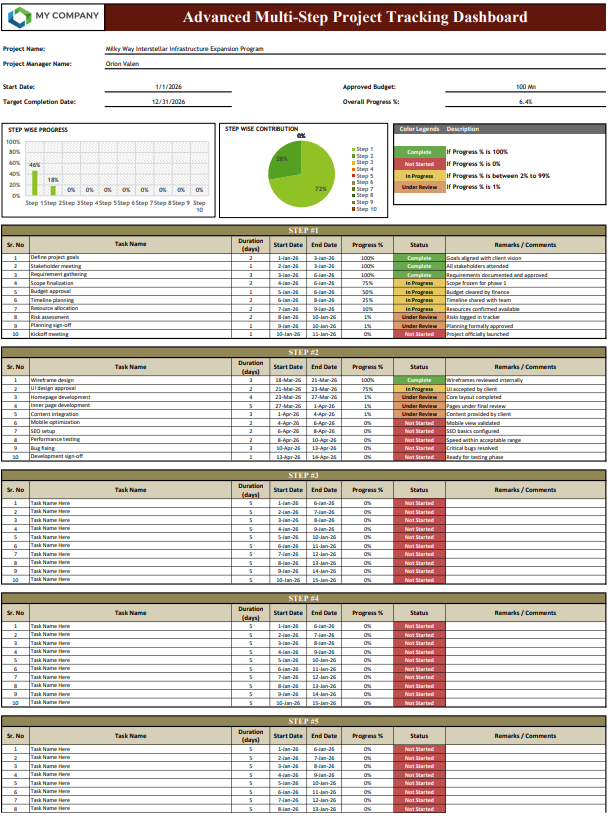
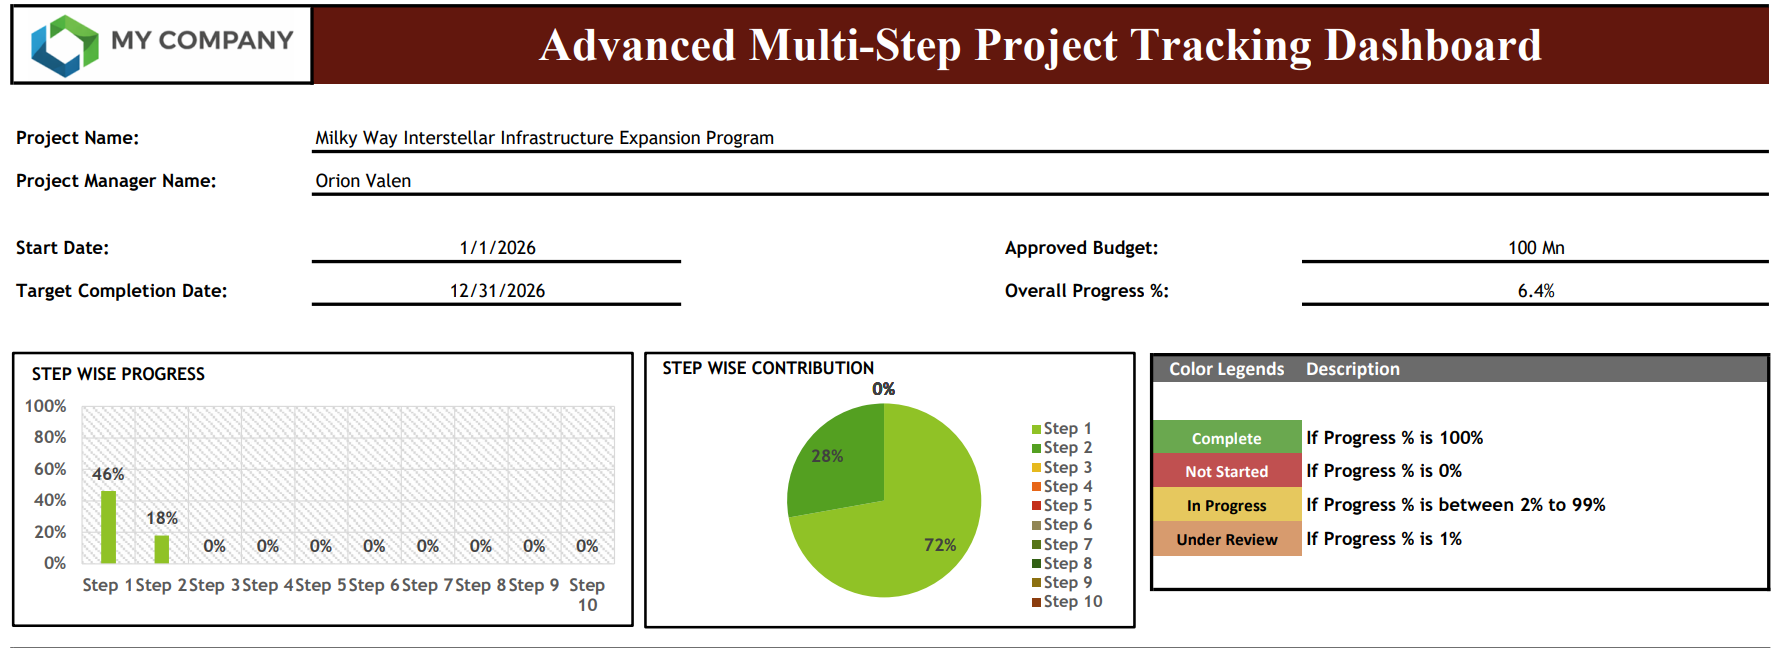
The top dashboard gives instant visibility into project performance:
β’ Step-wise progress bar chart β’ Step contribution pie chart β’ Automatic percentage calculations β’ Visual status indicators
Graphs update in real time based on task progress. No manual editing needed.
Just enter progress numbers β charts refresh instantly.
π― Conditional Formatting Rules
The template uses smart color coding for fast visual control:
π’ Complete β Progress = 100% π΄ Not Started β Progress = 0% π‘ In Progress β Progress between 2% and 99% π Under Review β Progress = 1%
This lets you scan the sheet and immediately understand project health.
π§© Project Structure
The workbook is divided into 10 project steps:
Step 1 to Step 10 Each step contains:
β’ Task name β’ Duration β’ Start date β’ End date β’ Progress % β’ Auto status β’ Remarks / notes
β How It Works
Each task has a progress percentage.
Step progress = average of all tasks in that step Dashboard progress = auto calculated from steps
No formulas need editing. Everything is prebuilt.
You only fill in task data.
π How to Use (Step-by-Step)
1οΈβ£ Replace βTask Name Hereβ with your tasks 2οΈβ£ Enter duration and dates 3οΈβ£ Fill progress % for each task 4οΈβ£ Status updates automatically 5οΈβ£ Dashboard charts update instantly 6οΈβ£ Add comments if needed 7οΈβ£ Rename steps to match your project 8οΈβ£ Add your company logo and title
Done. Your project dashboard is live.
π Adaptability
This template works for:
β IT & software projects β Construction tracking β Business operations β Freelance workflows β PMO reporting β Student project planning β Multi-phase programs β Client delivery tracking
You can duplicate steps, expand tasks, or adapt structure without breaking the dashboard.
This Best Practice includes
1 x Excel Sheet
