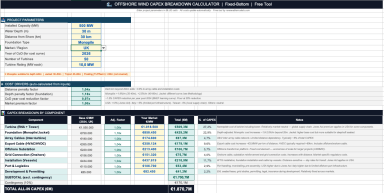
Offshore Wind CAPEX Breakdown Calculator — Fixed-Bottom | Free Tool
Originally published: 06/05/2026 19:50
Publication number: ELQ-12324-1
View all versions & Certificate
certified

Offshore Wind CAPEX Breakdown Calculator — Fixed-Bottom | Free Tool

Free Excel calculator estimating offshore wind CAPEX by component

Description
Stop guessing offshore wind CAPEX with a single €/MW number.


This free Excel calculator breaks down the all-in CAPEX of a fixed-bottom offshore wind project into 9 components, automatically adjusted for water depth, distance from shore, foundation type, market and year of CoD. Enter your project parameters and get a detailed cost breakdown in seconds — benchmarked against H1 2026 market data for 8 countries.
Two sheets included:


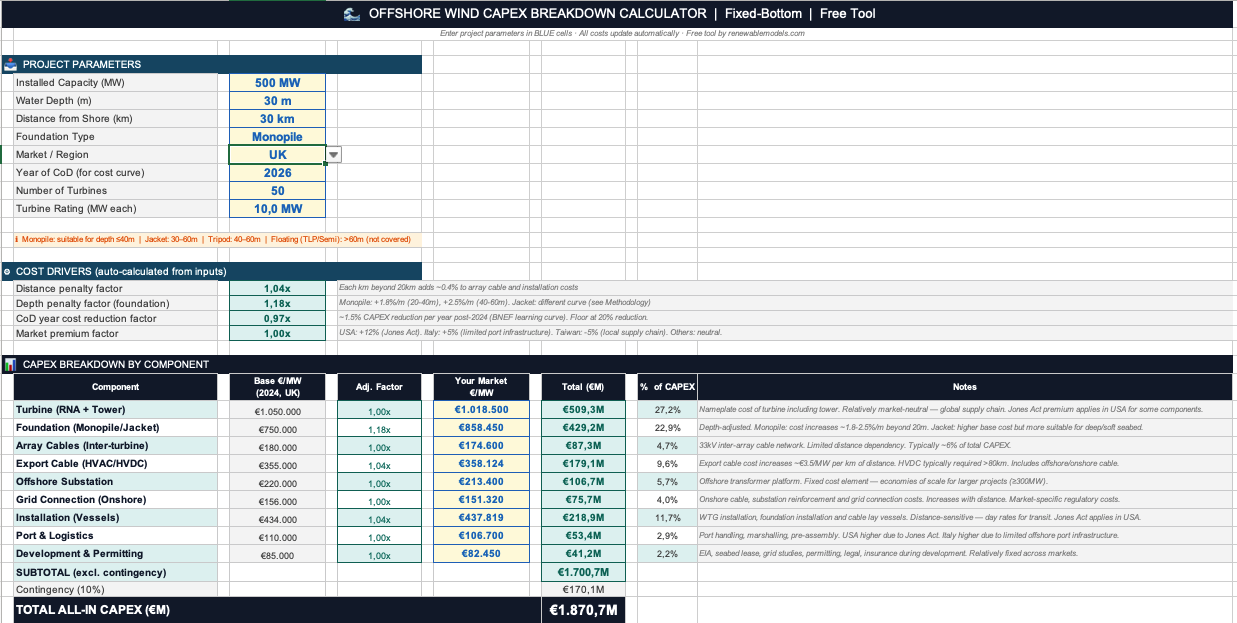
CAPEX Breakdown Calculator Enter your project parameters in the blue cells — installed capacity (MW), water depth (m), distance from shore (km), foundation type (Monopile / Jacket / Tripod), market, year of CoD, number of turbines and turbine rating. The calculator outputs a full breakdown by component:
  • Turbine (RNA + Tower)
  • Foundation — depth-adjusted curve (Monopile: +1.8%/m for 20–40m, +2.5%/m for 40–60m)
  • Array cables (inter-turbine)
  • Export cable — distance-adjusted (+€3,500/MW per km)
  • Offshore substation
  • Grid connection (onshore) — distance-adjusted
  • Installation (vessels) — distance and market adjusted
  • Port & logistics — market specific
  • Development & permitting
Each component shows base €/MW (2024 UK reference), adjustment factor, your market €/MW and total €M. Subtotal, 10% contingency and all-in CAPEX/MW are computed automatically. A benchmark comparison table shows whether your estimate is within, above or below the H1 2026 range for your selected market.


Four automatic adjustments:
  • Depth penalty — foundation and installation costs increase with water depth
  • Distance penalty — export cable, installation vessel transit and onshore grid costs increase with distance from shore
  • Market factor — USA +12% (Jones Act), Italy +5% (limited port infrastructure), Taiwan −5% (strong local supply chain), Netherlands −3% (mature ports)
  • Learning curve — ~1.5%/yr CAPEX reduction post-2024, reflecting turbine standardisation and supply chain maturity (BNEF H2 2025)


Methodology Full explanation of the depth and distance cost curves, market adjustment rationale, learning curve assumptions, contingency treatment and what the tool does not cover (floating offshore, decommissioning, AFUDC).

This Best Practice includes
1 Excel

Piero Farenti offers you this Best Practice for free!

download for free

Add to bookmarks

Discuss

Further information

Estimate offshore wind fixed-bottom CAPEX broken down by component, adjusted for site-specific parameters (depth, distance, foundation type) and market. Benchmark your estimate against H1 2026 ranges for 8 markets. Understand the key cost drivers without building a full bottom-up model.

You are screening an offshore wind project and need a component-level CAPEX estimate adjusted for your site and market. Useful for early-stage feasibility, investment committee presentations, benchmarking EPC quotes or understanding the sensitivity of total CAPEX to depth and distance.

You need a floating offshore wind estimate (depth >60m — cost structure is fundamentally different, €4–6M/MW range), a detailed bottom-up EPC cost model, or CAPEX for an onshore wind or solar project. This tool covers fixed-bottom offshore wind only.


0.0 / 5 (0 votes)

please wait...