
Interactive Budget vs Actual Dashboard with Department-Level Variance Analysis
Originally published: 24/04/2026 08:43
Publication number: ELQ-13904-1
View all versions & Certificate
certified

Interactive Budget vs Actual Dashboard with Department-Level Variance Analysis

Excel-based budget tracking dashboard

Description

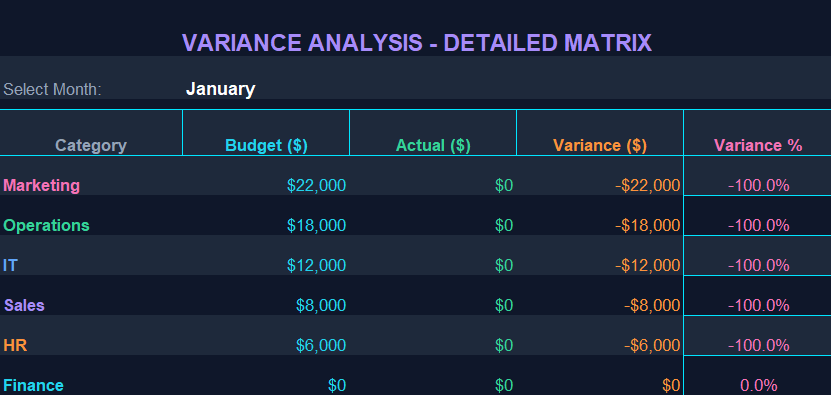
This downloadable best practice provides a structured Excel solution for tracking and analyzing budget versus actual financial performance. The file is designed with multiple interconnected sheets, including a data entry interface, a centralized master data log, predefined budget targets, and a variance analysis module.

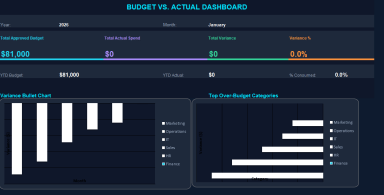
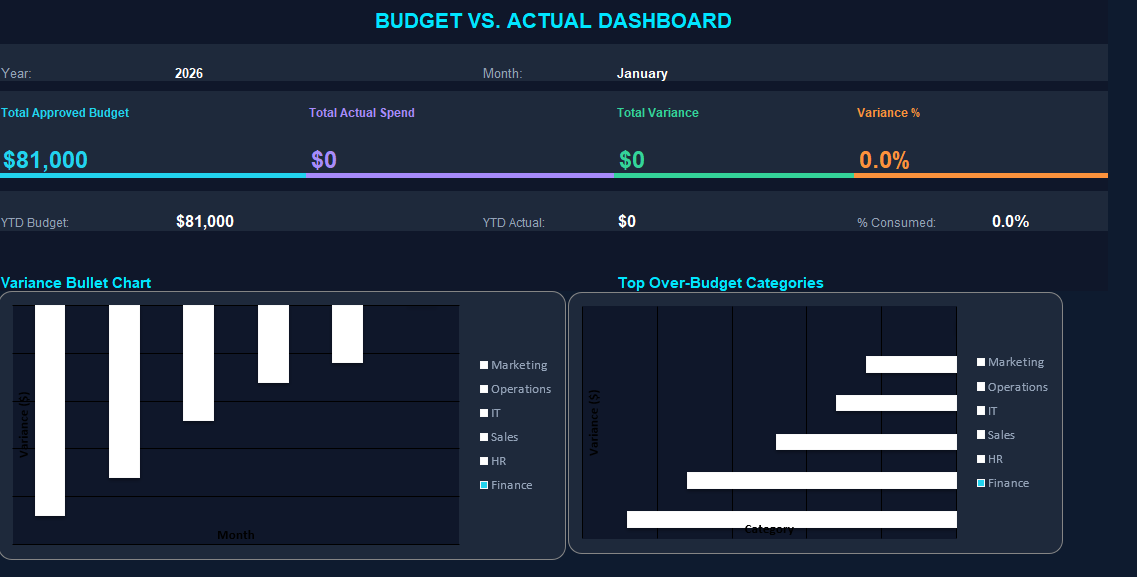
The dashboard delivers a summarized financial overview for a selected year, allowing users to compare total budget allocations against actual recorded expenses. Data is categorized by departments such as Sales, IT, Finance, Marketing, and Operations, enabling focused performance evaluation.

Instead of relying heavily on complex visualizations, the model emphasizes clarity through organized tables, monthly breakdowns, and calculated variance metrics. This ensures ease of use, transparency, and accuracy in financial tracking and reporting.

Contents

  • Dashboard sheet summarizing total budget, actuals, and variance
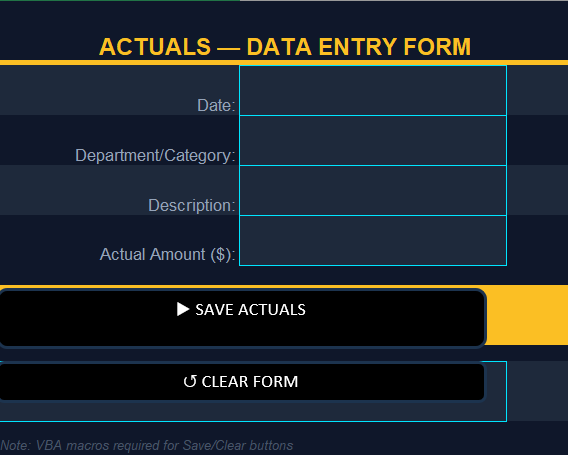
  • Data entry sheet for recording financial transactions
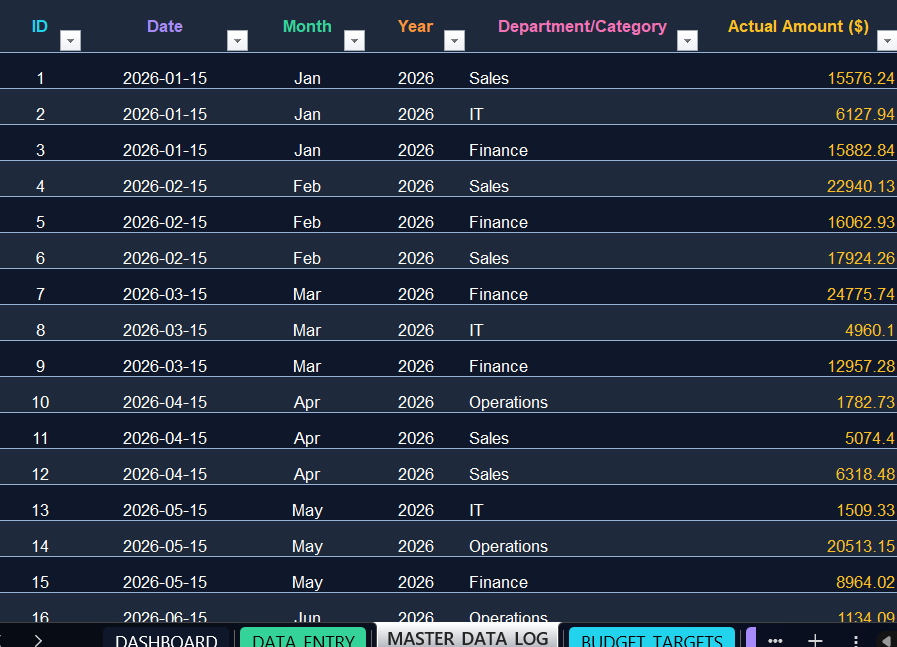
  • Master data log storing all entered records
  • Budget targets sheet with monthly allocations per department
  • Variance analysis sheet for monthly comparison
  • Department-based structure (Sales, IT, Finance, Marketing, Operations)
  • Monthly breakdown from January to December
  • Year selection functionality (e.g., 2026)


Discount 30% for first 10 person NOW.

Excel-based budget tracking dashboard

DONT WAIT

This Best Practice includes
Interactive Budget vs Actual Dashboard with Department.xlsm

Acquire business license for $30.00

Add to cart

Add to bookmarks

Discuss

Further information

To provide a clear system for recording and organizing actual financial data
To compare actual performance against predefined budget targets
To enable variance analysis across departments and time periods
To centralize financial data in a structured and consistent format
To support better financial decision-making through simplified reporting

When tracking departmental expenses against fixed budget plans
In organizations requiring monthly financial monitoring
For users working within Excel without external system integration
In small to medium-sized datasets where structured tracking is sufficient
When a simple and organized financial reporting tool is needed

In large-scale enterprise environments requiring ERP integration
When handling very large datasets beyond Excel limitations
For advanced predictive analytics or financial modeling needs
When fully automated real-time data synchronization is required
For users expecting highly advanced interactive dashboards


0.0 / 5 (0 votes)

please wait...