Originally published: 10/10/2023 09:15
Publication number: ELQ-68160-1
View all versions & Certificate
Publication number: ELQ-68160-1
View all versions & Certificate


0.0 / 5 (0 votes)
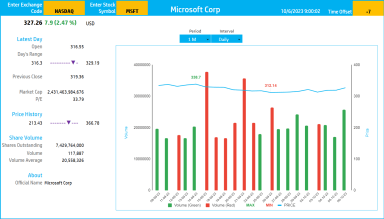
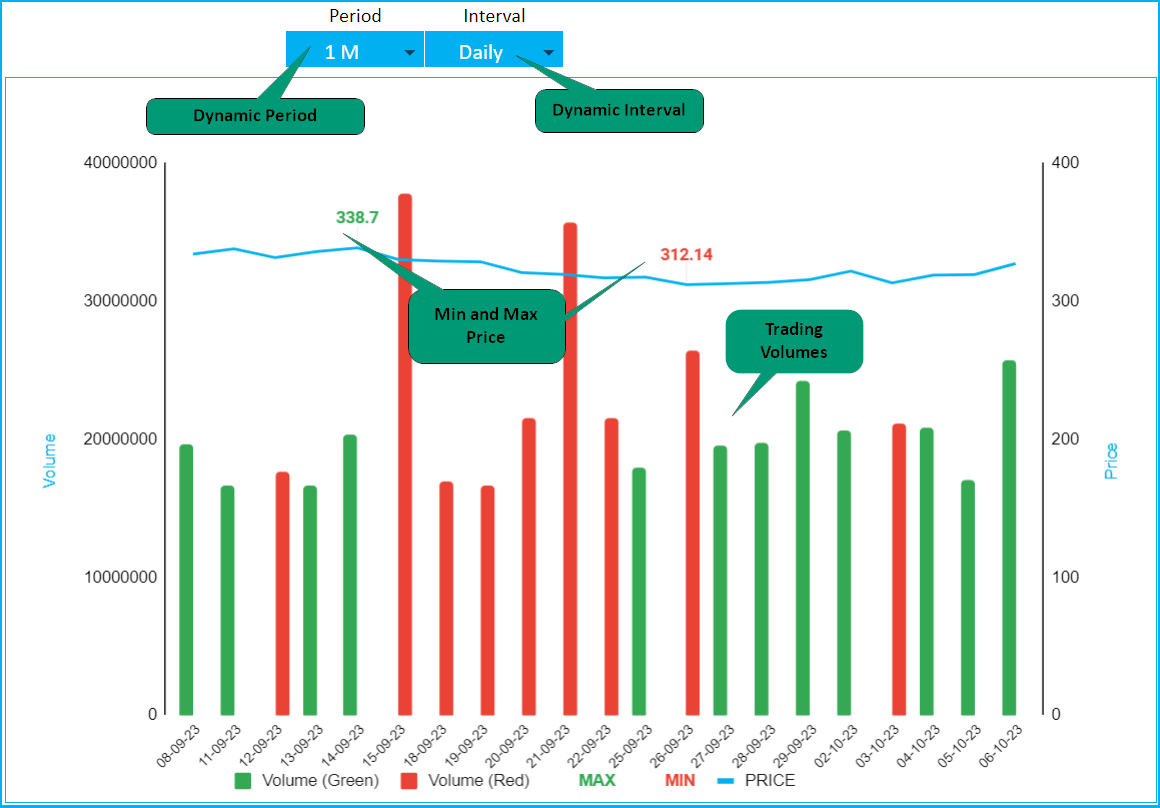
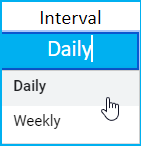
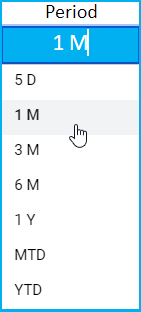
Stock Price Chart in Google Sheets – Dynamic – LIVE updates
by Indzara
Version 1 (Original Version): 10/10/2023 09:15 GMT
Publication Number: ELQ-68160-1
