

Originally published: 25/12/2023 21:16
Last version published: 06/07/2024 22:32
Publication number: ELQ-56179-6
View all versions & Certificate
Last version published: 06/07/2024 22:32
Publication number: ELQ-56179-6
View all versions & Certificate

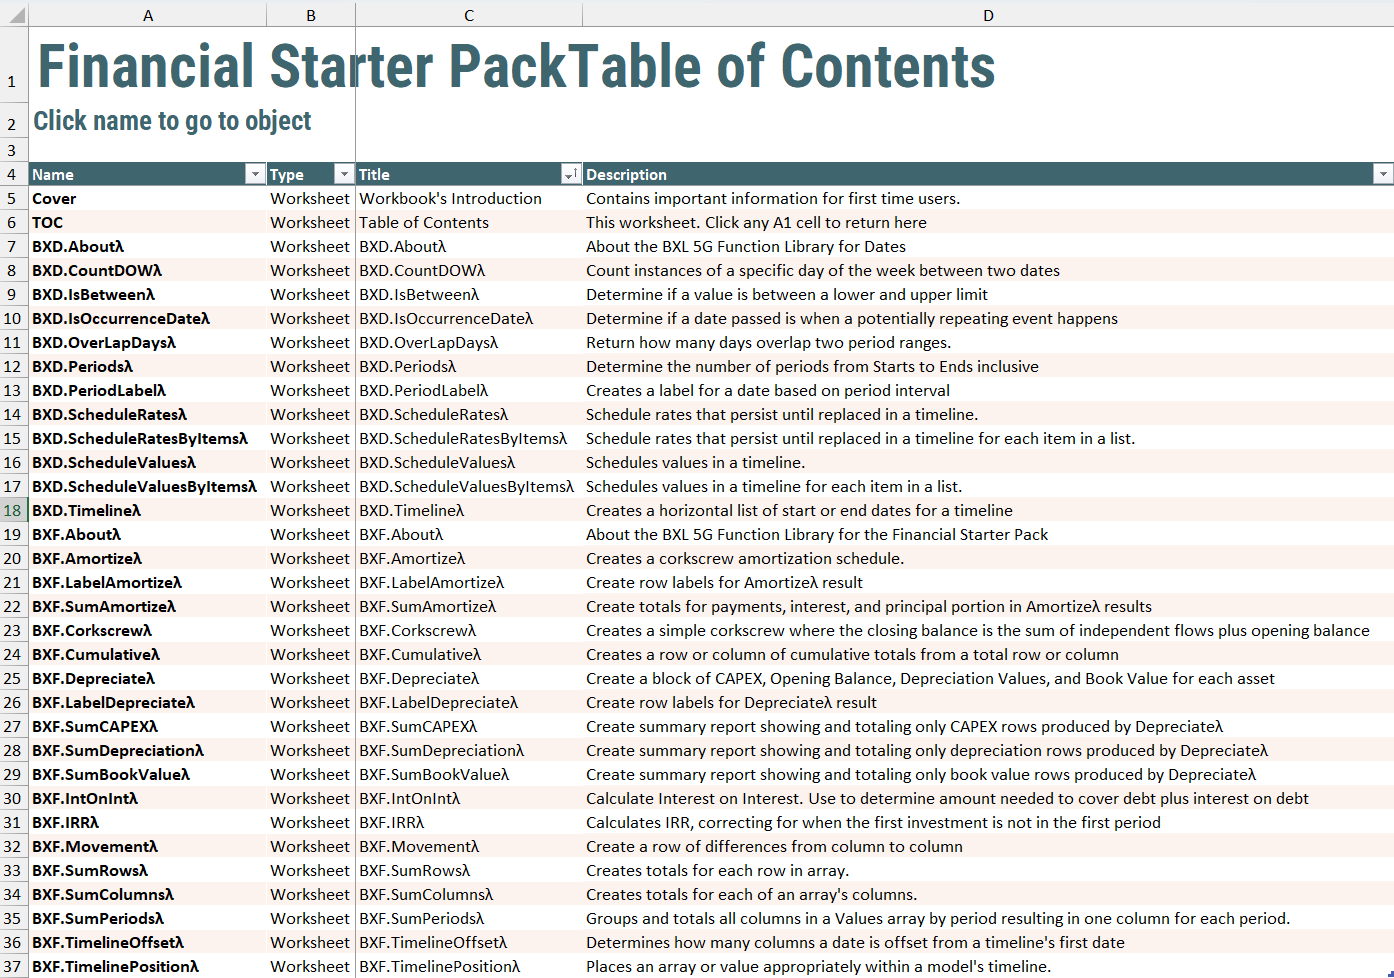
Financial Starter Pack
Easily create dynamic array financial models using 5g. 5g is a standard for converting Excel formulas into Excel functions anyone can use on any workbook.
Founder: Beyond Excel and 5G Modeling.com. Author: Ribbon Recipes: Beginner's Guide to Creating Excel MenusFollow 84
Description
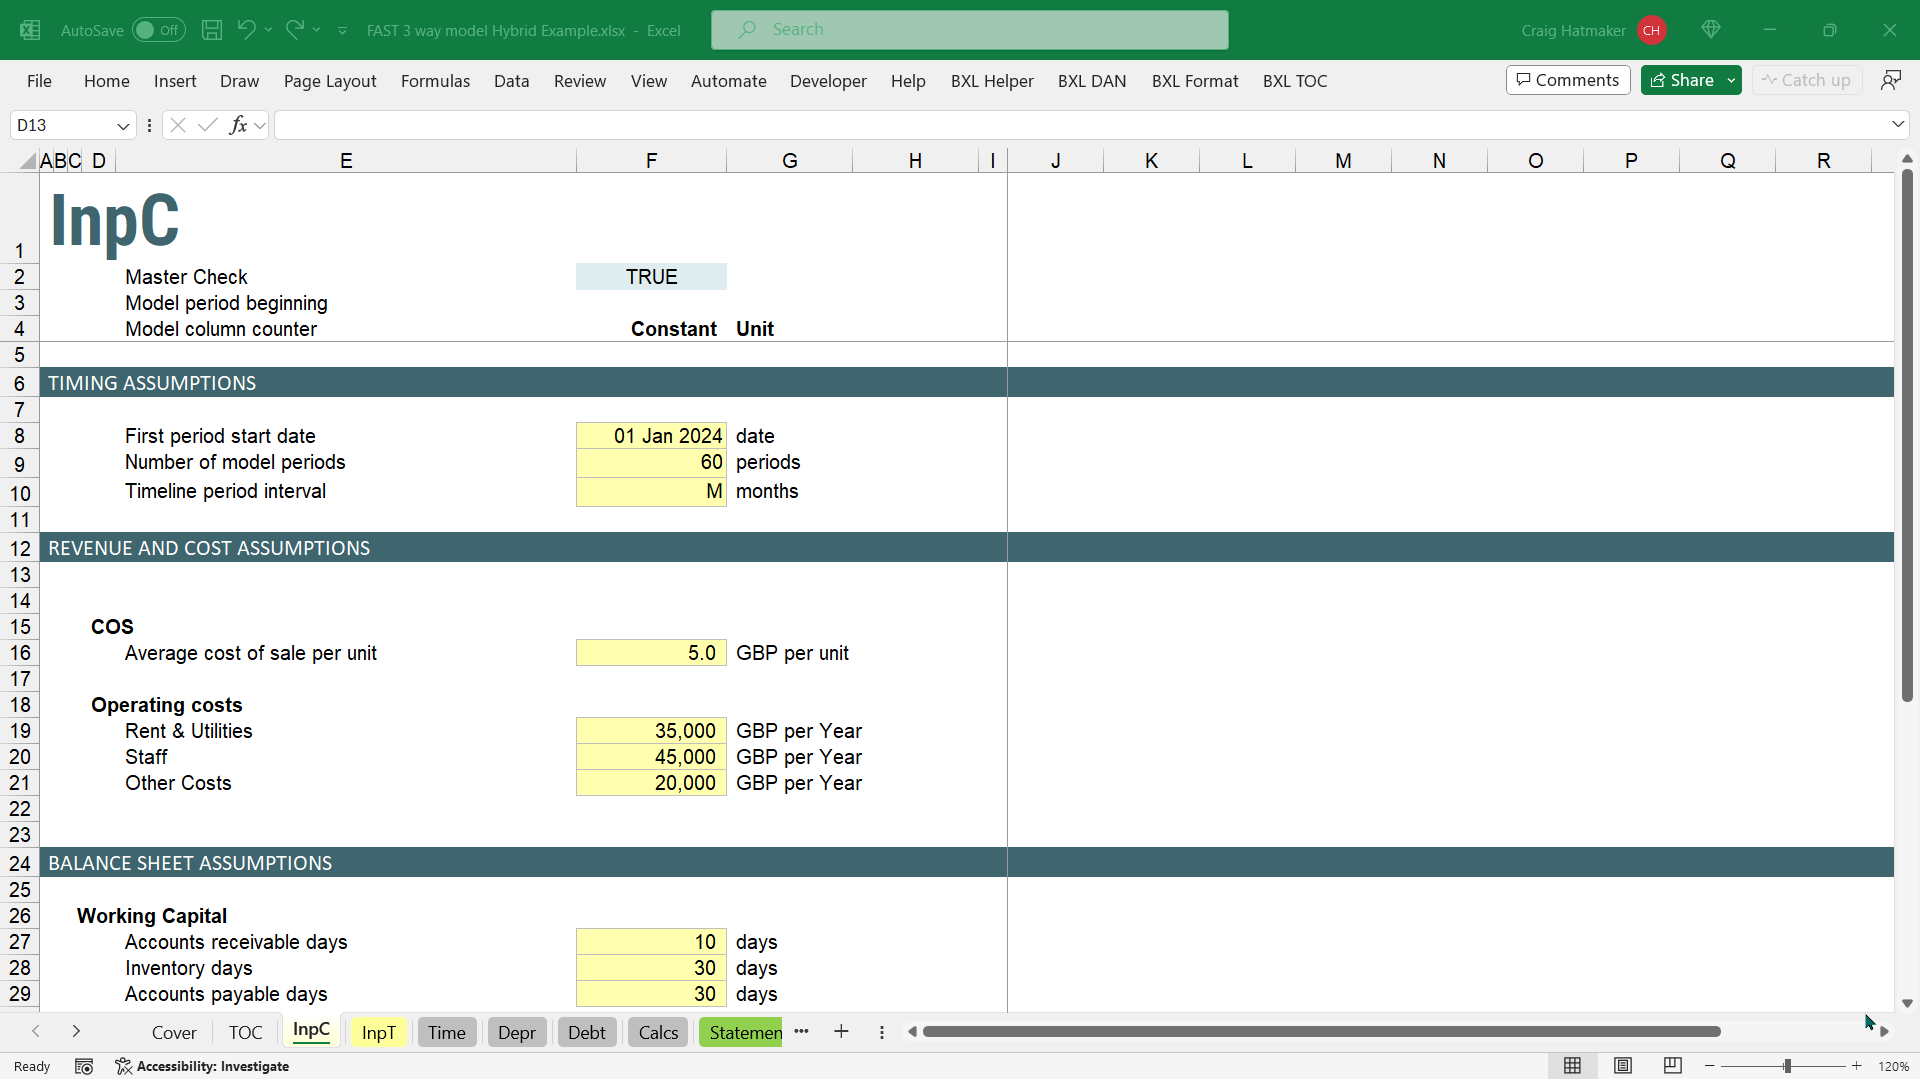
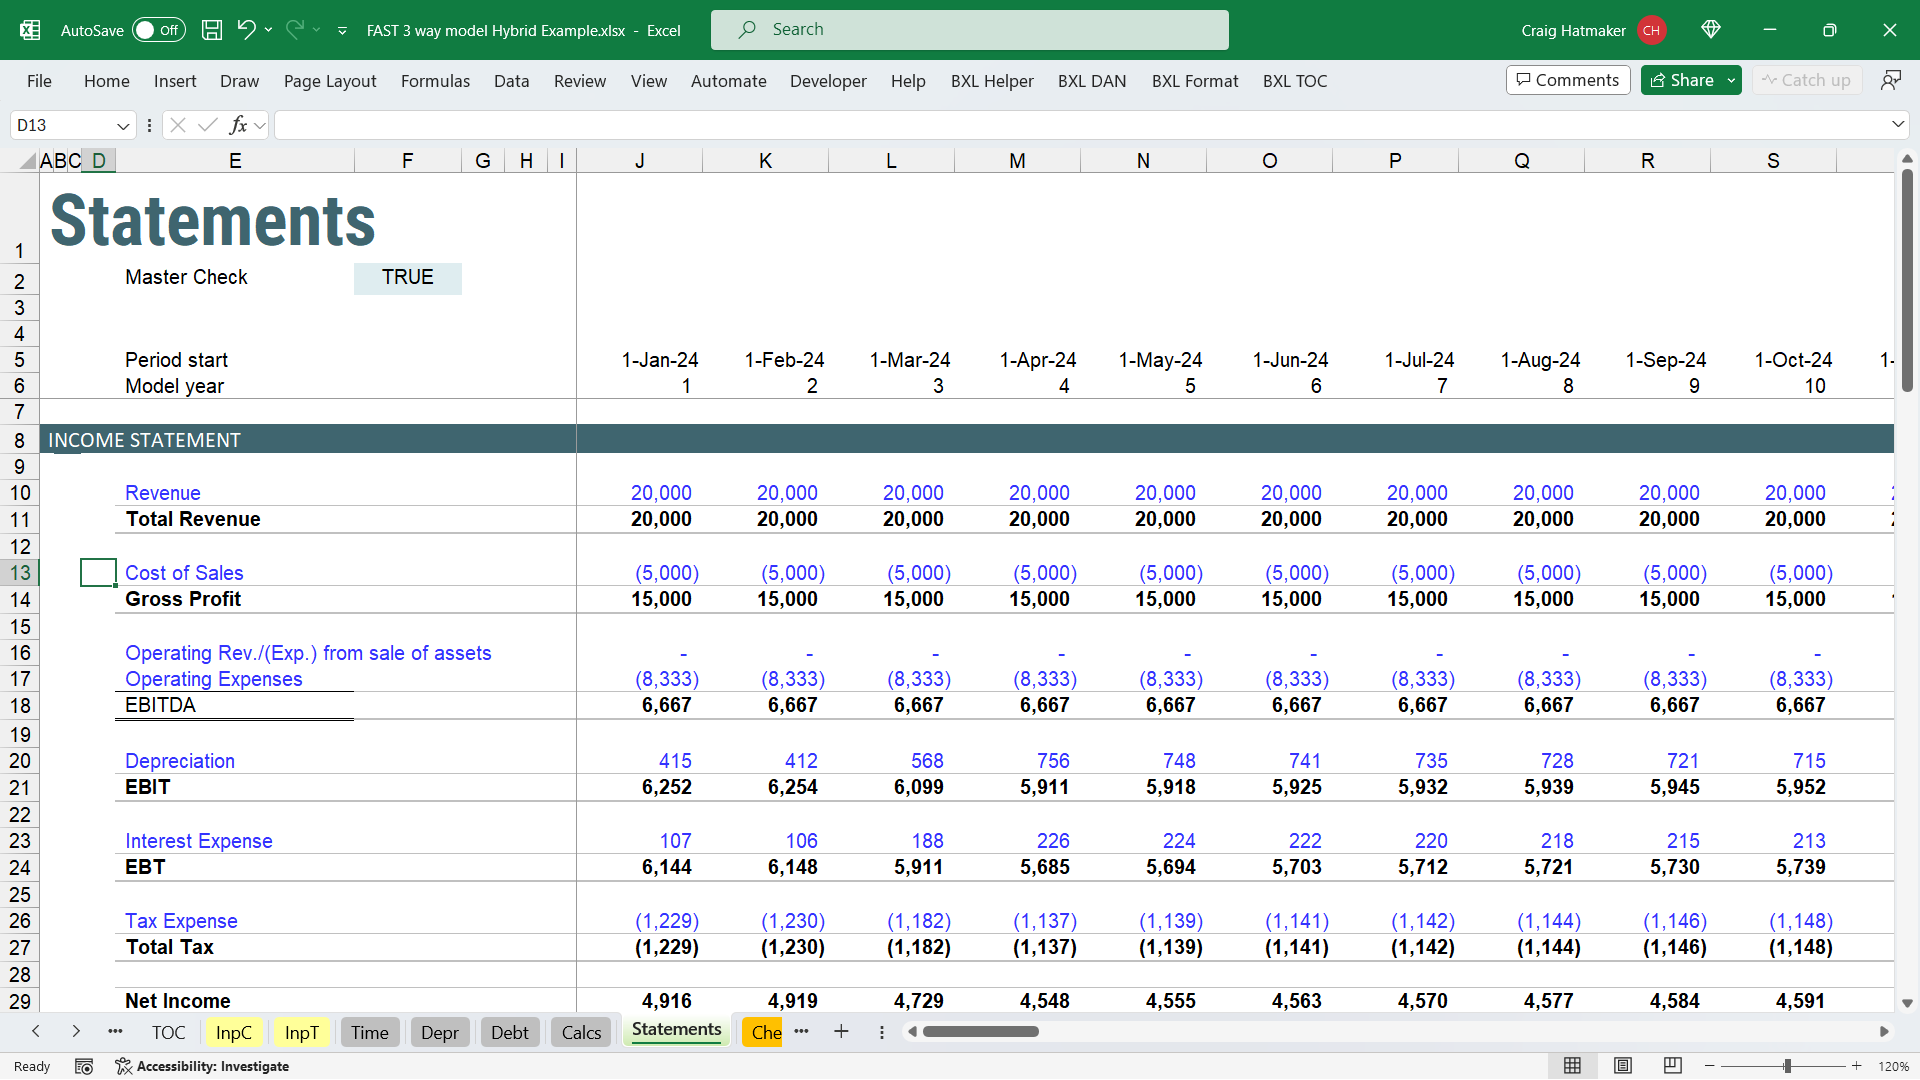
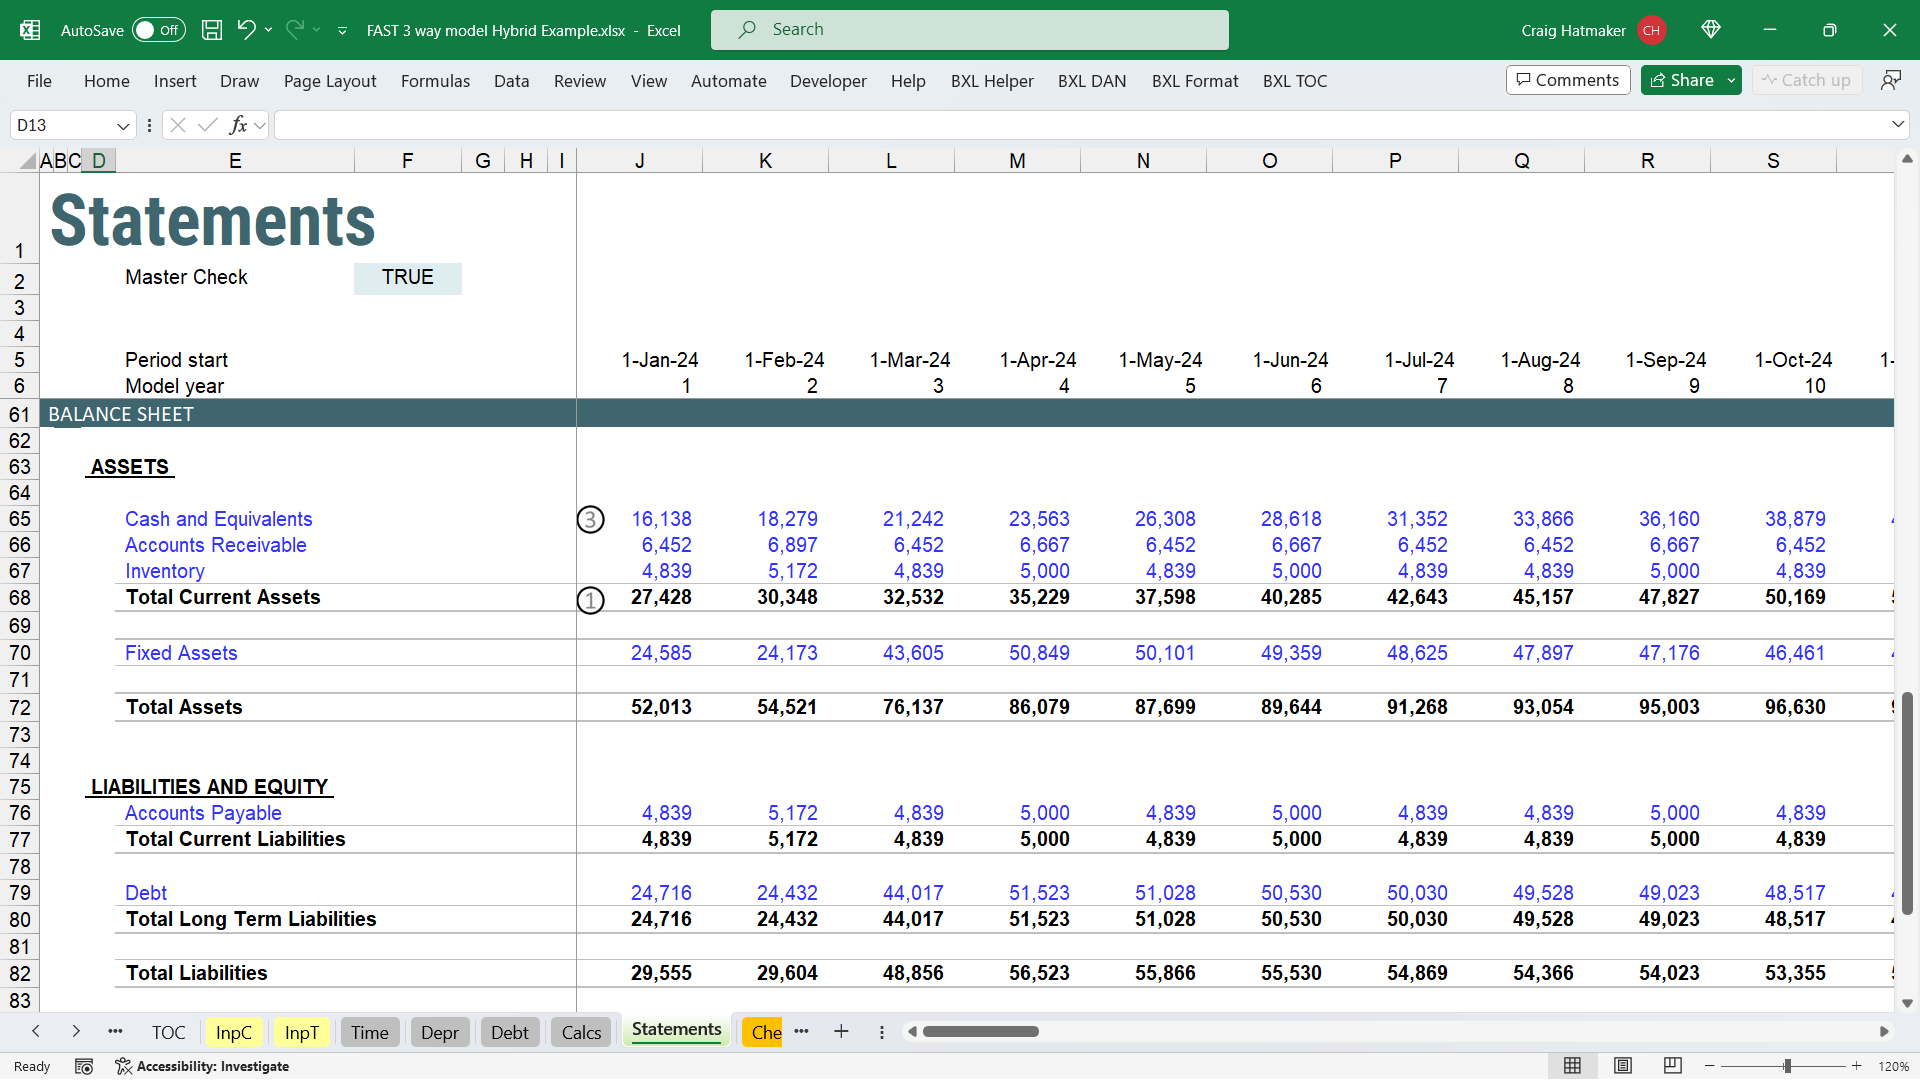
The Financial Starter Pack includes a 3-way financial model that uses 5g functions to create its 100% dynamic array calculations with no special skills. That's because 5g functions look and feel just like Excel's functions so anyone who can use SUM() can use 5g functions.
No special skills required!
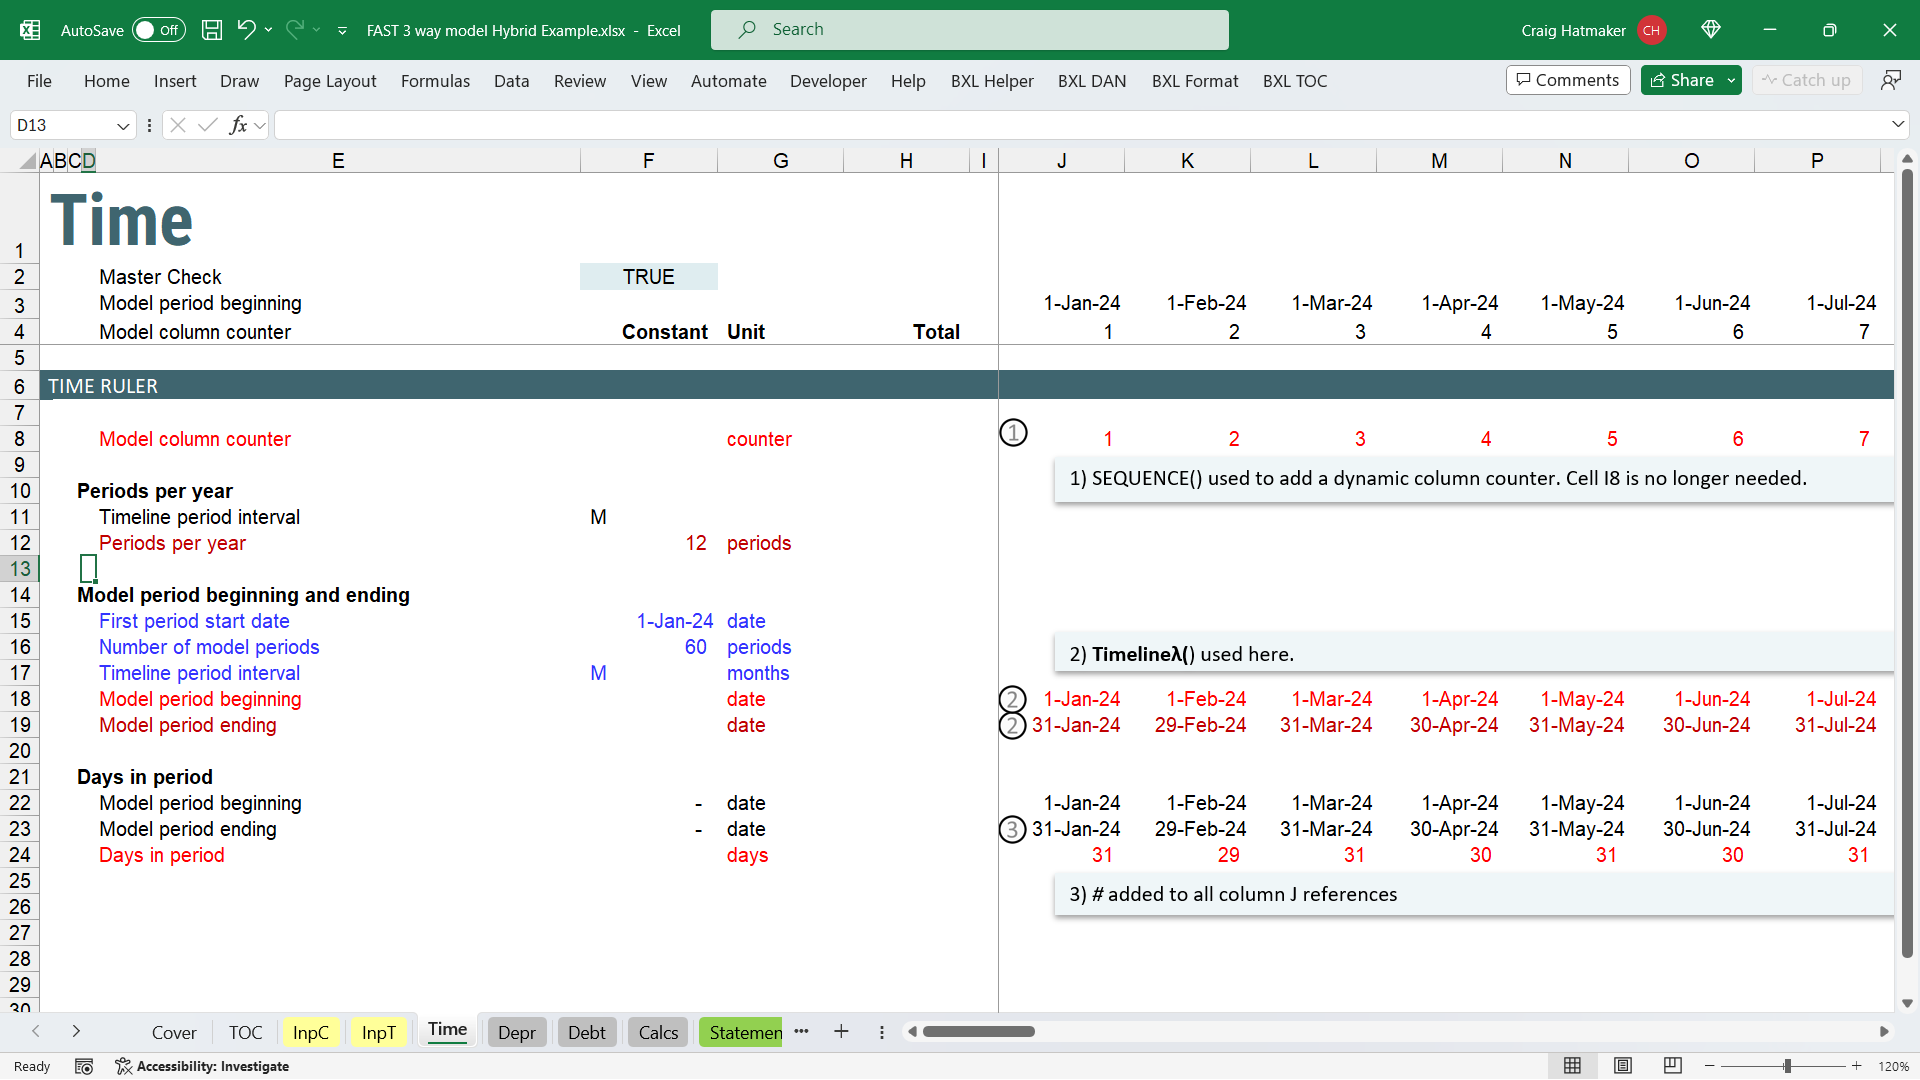
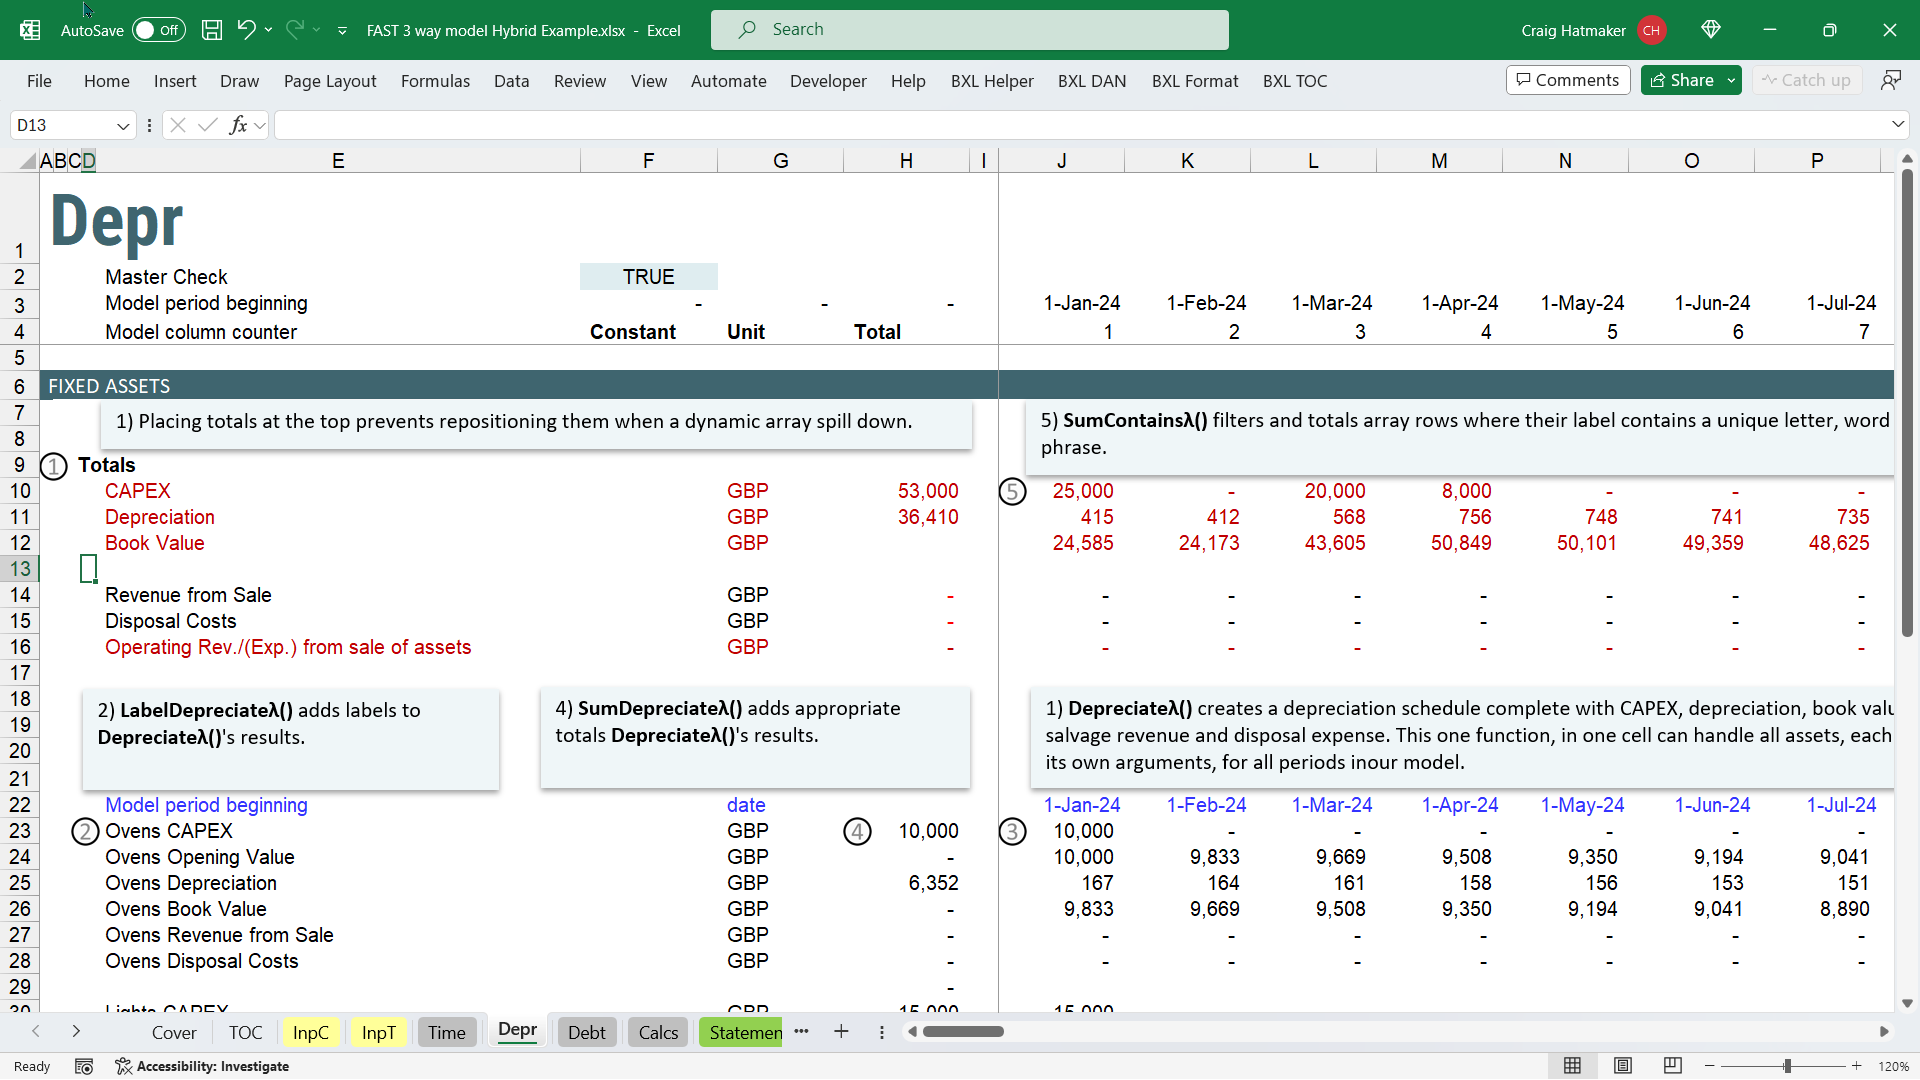
5G functions can make dynamic arrays do some incredible things. Watch the video to see how one 5G function in one cell can calculate an entire deprecition schedule for ALL assets and ALL periods:
Depreciation Demo: https://youtu.be/pEzzBVG9WVE
5g functions are easy to load into any workbook. See how easy in this video:
Load 5g Functions: https://youtu.be/2SEYLHzyw3k
You get all this!
* An example 3-way financial model* All the functions listed below (and more)
* A workbook that explains each function and provides working examples to play with.
* A video showing step by step how we converted a FAST model to dynamic arrays
* The original model from the step by step video.
* The converted model from the step by step video* NEW! 38 Financial Ratios
Dates Library
BXD.Aboutλ - About the BXL 5G Function Library for Dates
BXD.CountDOWλ - Count instances of a specific day of the week between two dates
BXD.IsBetweenλ - Determine if a value is between a lower and upper limit
BXD.IsOccurrenceDateλ - Determine if a date passed is when a potentially repeating event happens
BXD.OverLapDaysλ - Return how many days overlap two period ranges.
BXD.Periodsλ - Determine the number of periods from Starts to Ends inclusive
BXD.PeriodLabelλ - Creates a label for a date based on period interval
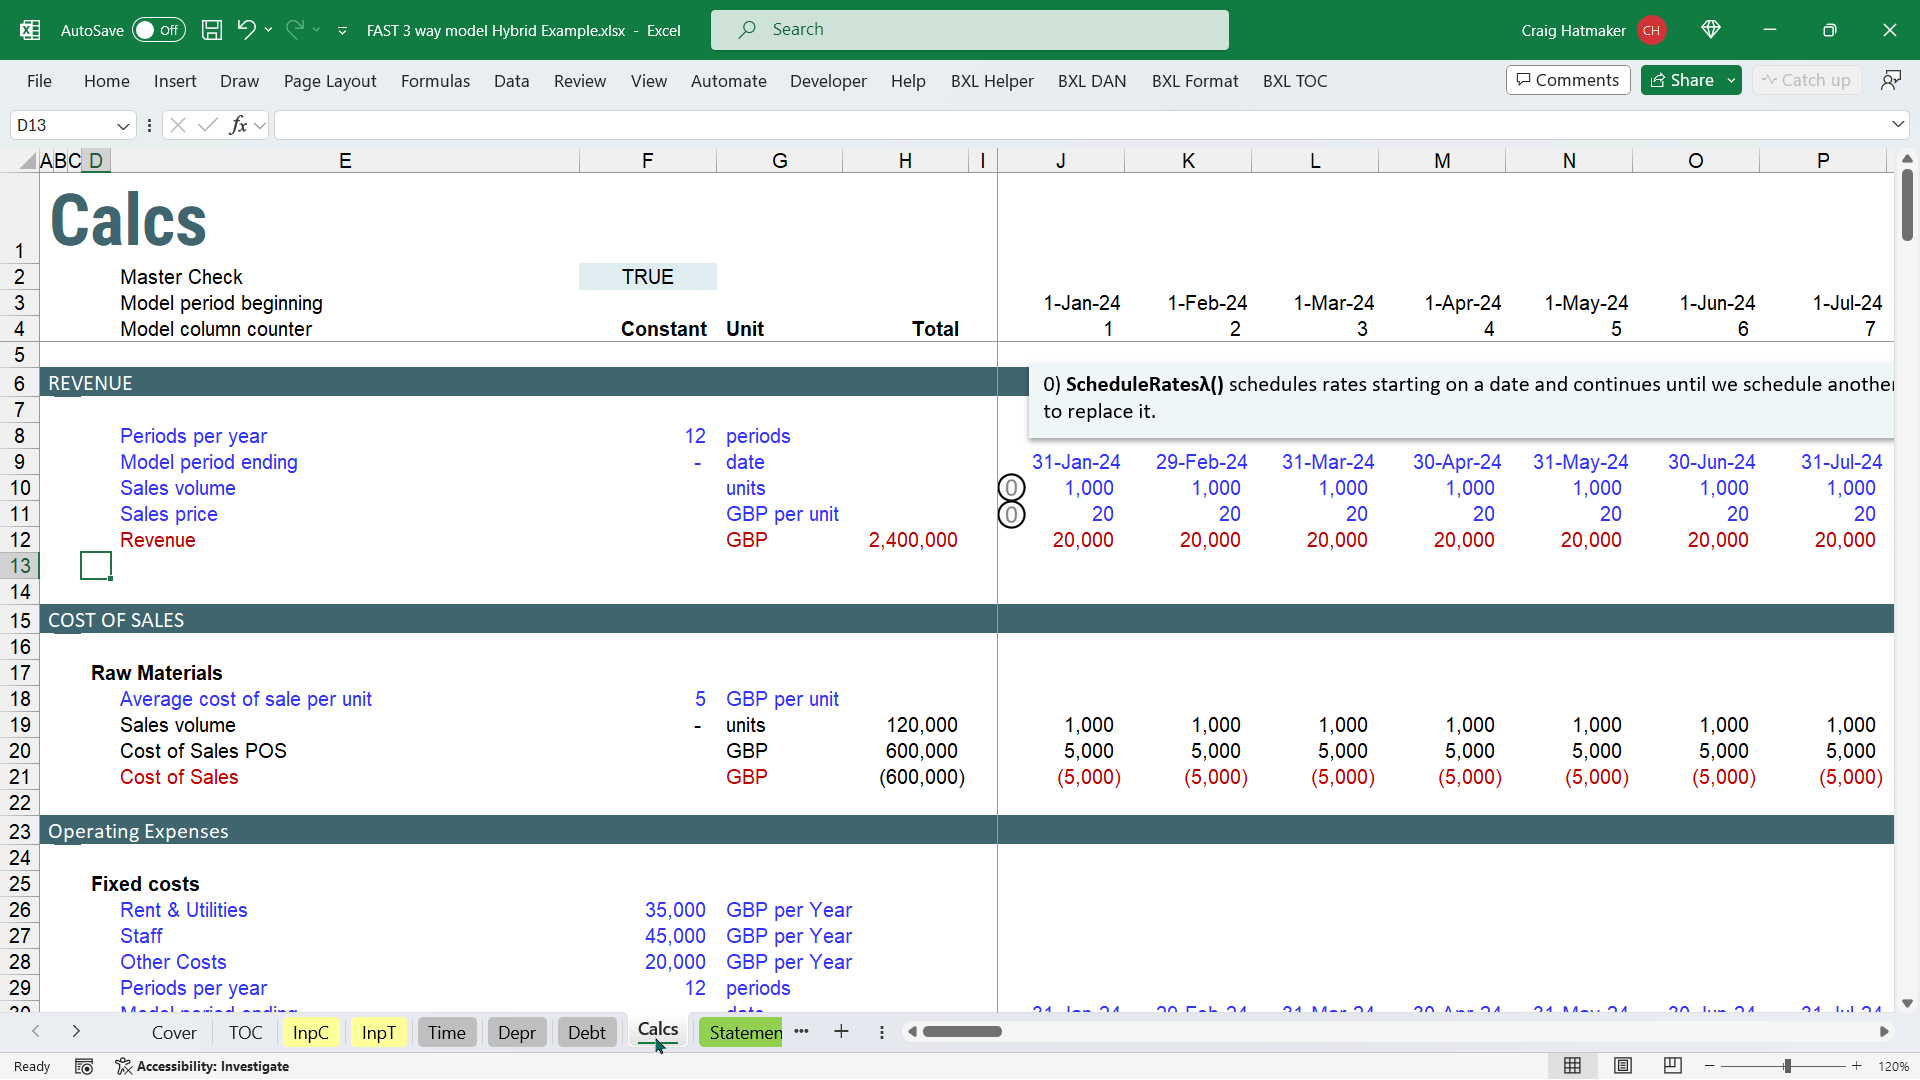
BXD.ScheduleRatesλ - Schedule rates that persist until replaced in a timeline.
BXD.ScheduleRatesByItemsλ - Schedule rates that persist until replaced in a timeline for each item in a list.
BXD.ScheduleValuesλ - Schedules values in a timeline.
BXD.ScheduleValuesByItemsλ - Schedules values in a timeline for each item in a list.
BXD.Timelineλ - Creates a horizontal list of start or end dates for a timeline
FInancials Library
BXF.Aboutλ - About the BXL 5G Function Library for the Financial Starter Pack
Amortization suite
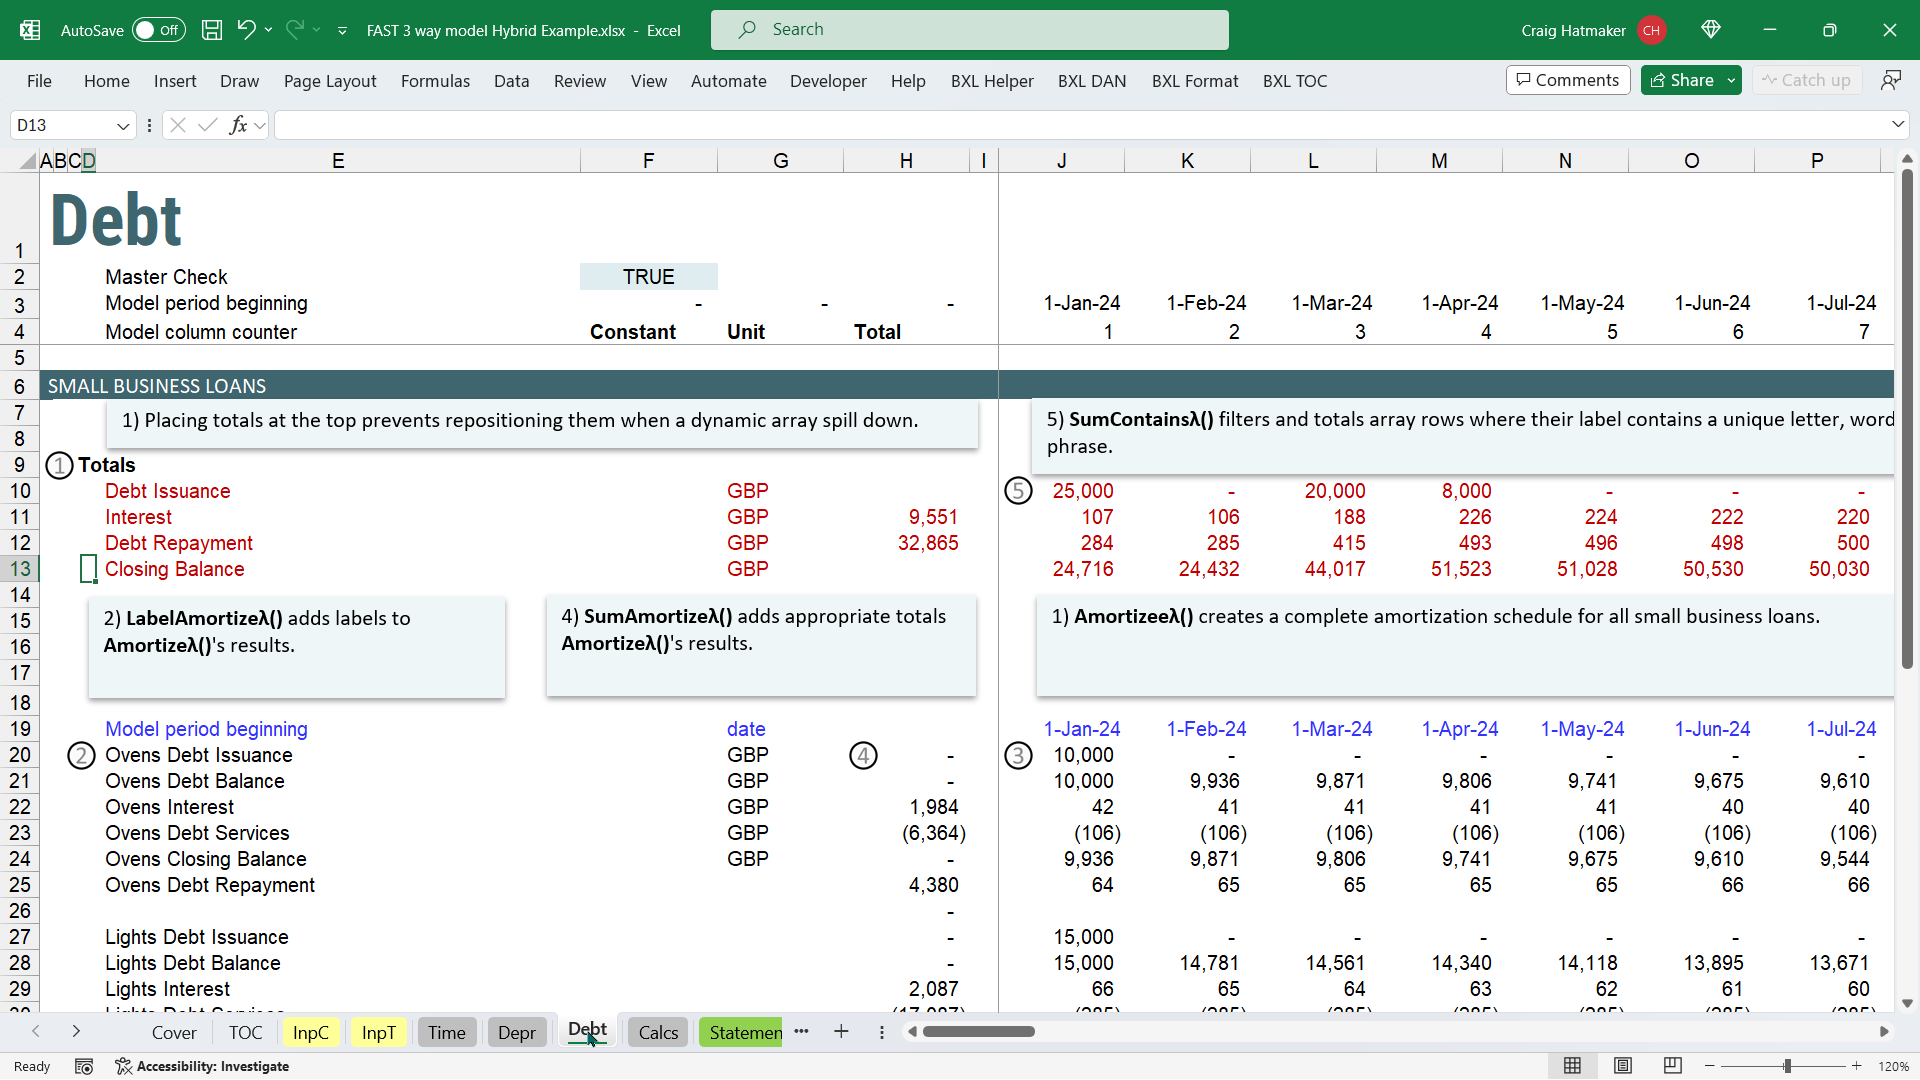
BXF.Amortizeλ - Creates a corkscrew amortization schedule.
BXF.LabelAmortizeλ - Create row labels for Amortizeλ result
BXF.SumAmortizeλ - Create totals for payments, interest, and principal portion in Amortizeλ results
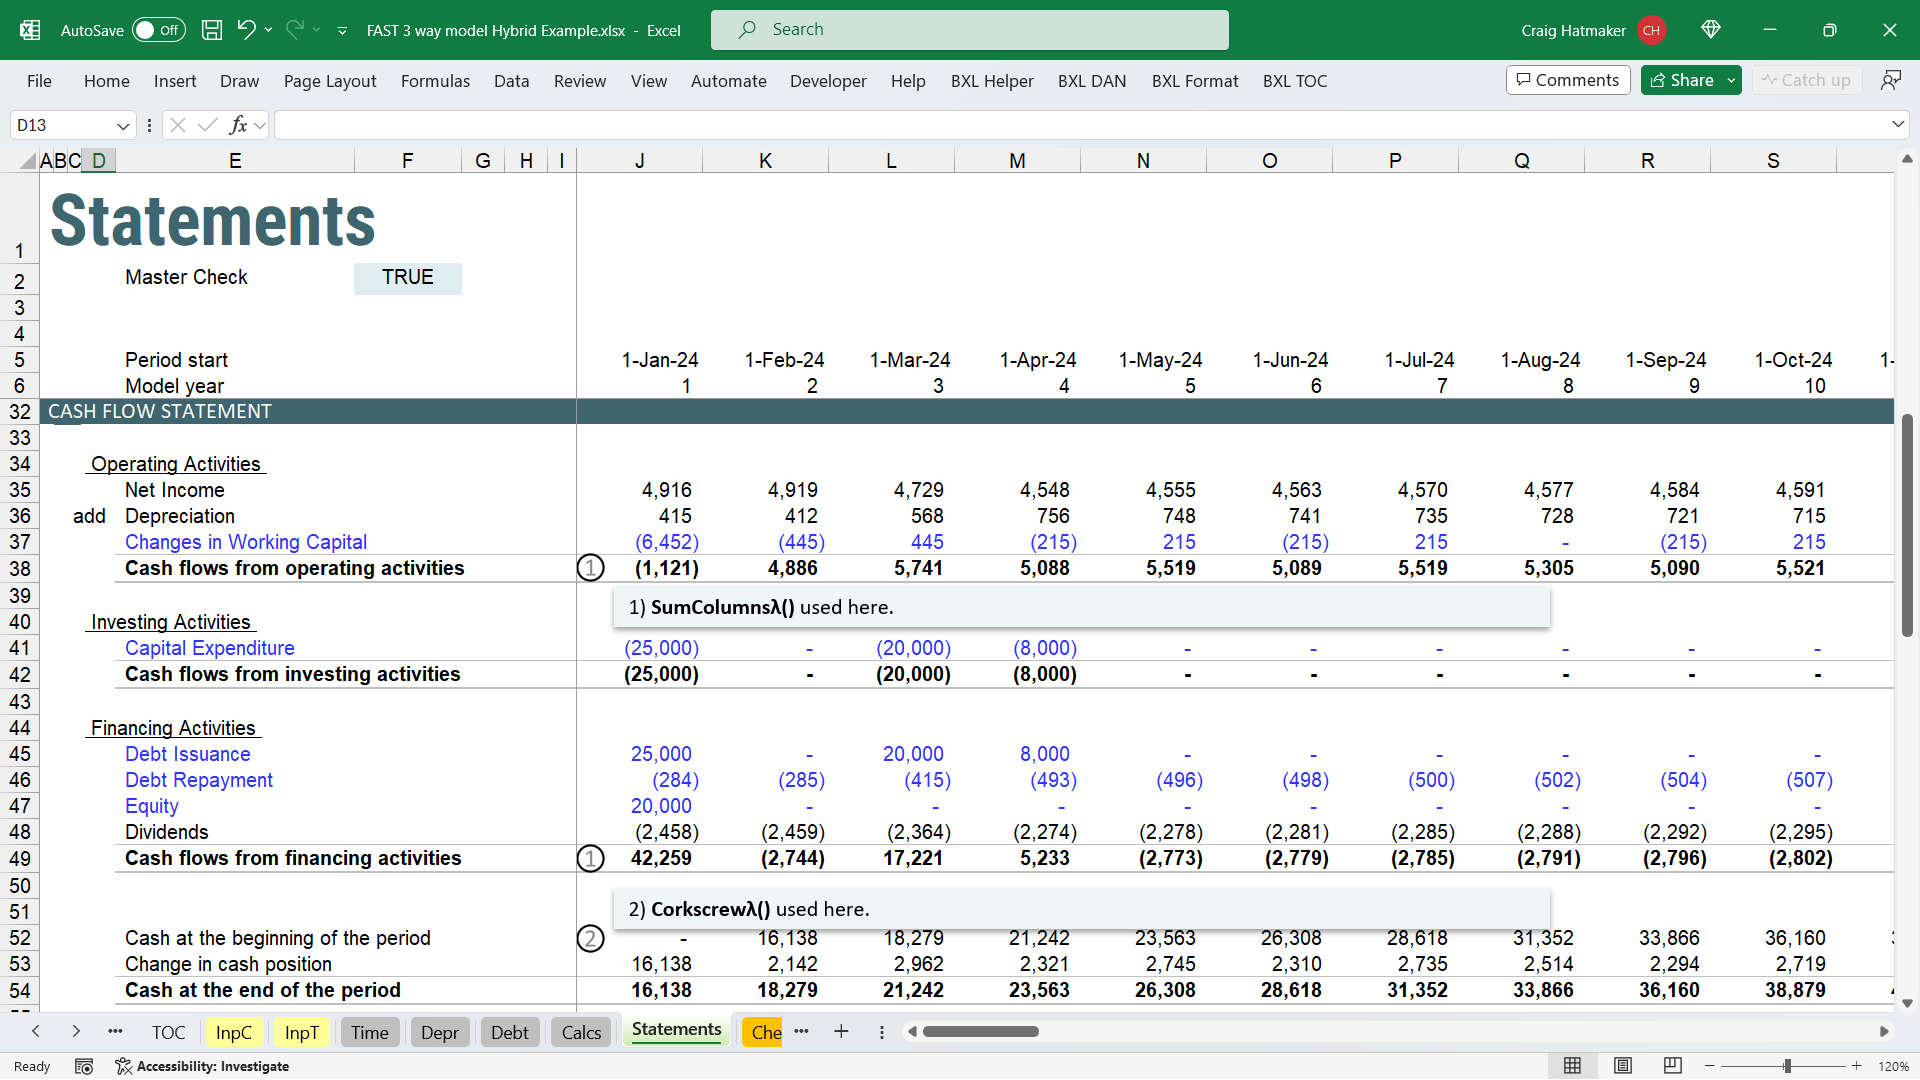
BXF.Corkscrewλ - Creates a simple corkscrew where the closing balance is the sum of independent flows plus opening balance
BXF.Cumulativeλ - Creates a row or column of cumulative totals from a total row or column
Deperciation suite
BXF.Depreciateλ - Create a block of CAPEX, Opening Balance, Depreciation Values, and Book Value for each asset
BXF.LabelDepreciateλ - Create row labels for Depreciateλ result
BXF.SumDepreciateλ - Create row totals appropriate for Depreciateλ's results
BXF.IntOnIntλ - Calculate Interest on Interest. Use to determine amount needed to cover debt plus interest on debt
BXF.IRRλ - Calculates IRR, correcting for when the first investment is not in the first period
BXF.Movementλ - Create a row of differences from column to column
BXF.RollingSumλ - Creates rolling totals for a row of values.
BXF.SumContainsλ - Totals rows where their labels match a unique letter, word or phrase.
BXF.SumRowsλ - Creates totals for each row in array.
BXF.SumColsλ - Creates totals for each column in an array'.
BXF.SumPeriodsλ - Groups and totals all columns in a Values array by period resulting in one column for each period.
BXF.TimelineOffsetλ - Determines how many columns a date is offset from a timeline's first date
BXF.TimelinePositionλ - Places an array or value appropriately within a model's timeline.
Array Essentials Library
CountCλ - Count how many of one or more characters are in a text string
SumColsλ-Get the total of each column
SumRowsλ-Get the total of each row
AvgColsλ-Get the average of each column
AvgRowsλ-Get the average of each row
MinColsλ-Get the minimum of each column
MinRowsλ-Get the minimum of each row
MaxColsλ -Get the maximum of each column
MaxRowsλ-Get the maximum of each row
CountColsλ-Get the count of numbers in each column
CountRowsλ-Get the count of numbers in each row
CountAColsλ-Get the count of everything of each column
CountARowsλ-Get the count of everything of each row
IsBetweenλ-Determine if a value is between a lower and upper limit.
RangeToDAλ-Convert a range reference to a dynamic array reference
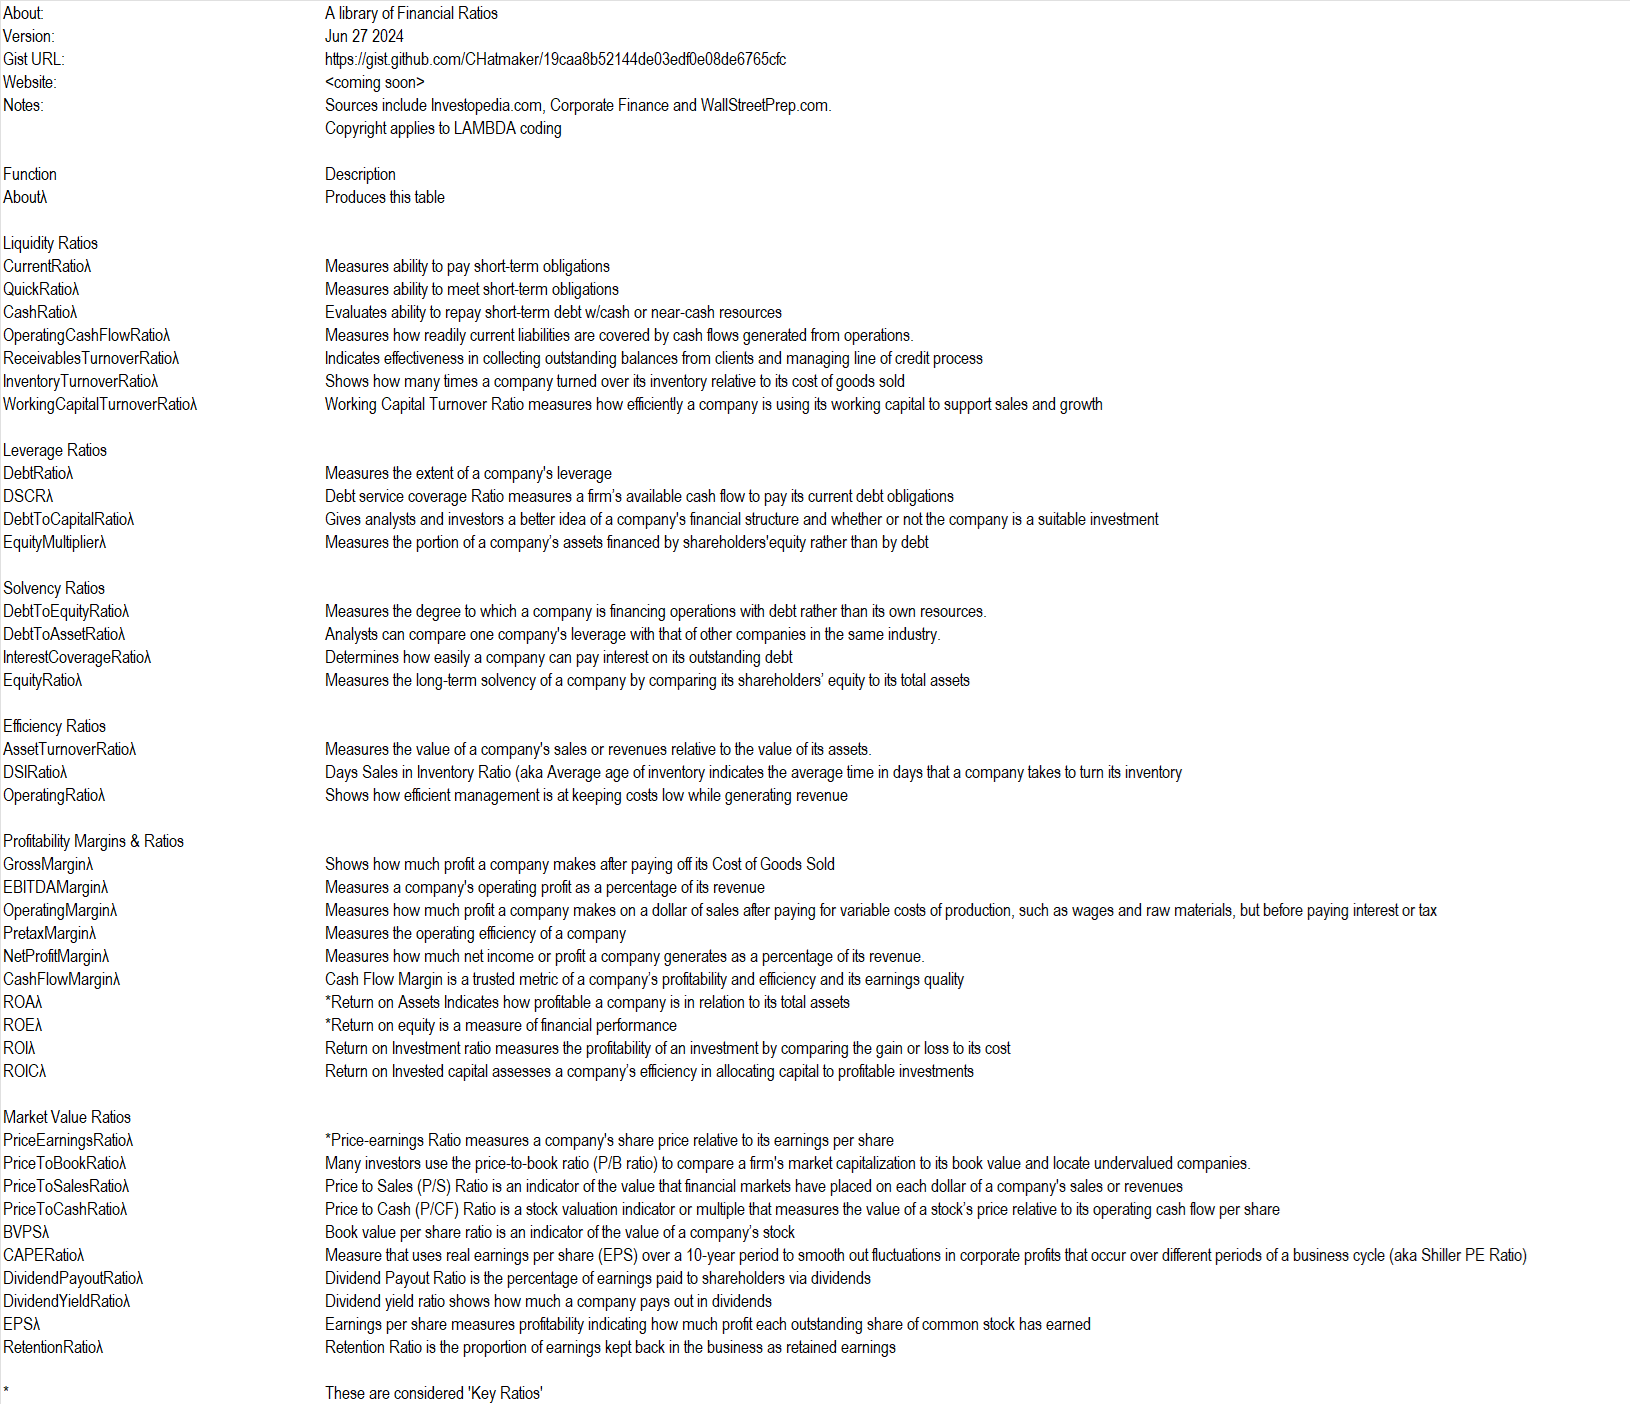
NEW! Financial Ratios
Liquidity Ratios
CurrentRatioλ-Measures ability to pay short-term obligations
QuickRatioλ-Measures ability to meet short-term obligations
CashRatioλ-Evaluates ability to repay short-term debt w/cash or near-cash resources
OperatingCashFlowRatioλ-Measures how readily current liabilities are covered by cash flows generated from operations.
ReceivablesTurnoverRatioλ-Indicates effectiveness in collecting outstanding balances from clients and managing line of credit process
InventoryTurnoverRatioλ-Shows how many times a company turned over its inventory relative to its cost of goods sold
WorkingCapitalTurnoverRatioλ-Working Capital Turnover Ratio measures how efficiently a company is using its working capital to support sales and growth
Leverage Ratios
DebtRatioλ-Measures the extent of a company's leverage
DSCRλ-Debt service coverage Ratio measures a firm’s available cash flow to pay its current debt obligations
DebtToCapitalRatioλ-Gives analysts and investors a better idea of a company's financial structure and whether or not the company is a suitable investment
EquityMultiplierλ-Measures the portion of a company’s assets financed by shareholders'equity rather than by debt
Solvency Ratios
DebtToEquityRatioλ-Measures the degree to which a company is financing operations with debt rather than its own resources.
DebtToAssetRatioλ-Analysts can compare one company's leverage with that of other companies in the same industry.
InterestCoverageRatioλ-Determines how easily a company can pay interest on its outstanding debt
EquityRatioλ-Measures the long-term solvency of a company by comparing its shareholders’ equity to its total assets
Efficiency Ratios
AssetTurnoverRatioλ-Measures the value of a company's sales or revenues relative to the value of its assets.
DSIRatioλ-Days Sales in Inventory Ratio (aka Average age of inventory indicates the average time in days that a company takes to turn its inventory
OperatingRatioλ-Shows how efficient management is at keeping costs low while generating revenue
Profitability Margins & Ratios
GrossMarginλ-Shows how much profit a company makes after paying off its Cost of Goods Sold
EBITDAMarginλ-Measures a company's operating profit as a percentage of its revenue
OperatingMarginλ-Measures how much profit a company makes on a dollar of sales after paying for variable costs of production, such as wages and raw materials, but before paying interest or tax
PretaxMarginλ-Measures the operating efficiency of a company
NetProfitMarginλ-Measures how much net income or profit a company generates as a percentage of its revenue.
CashFlowMarginλ-Cash Flow Margin is a trusted metric of a company’s profitability and efficiency and its earnings quality
ROAλ-*Return on Assets Indicates how profitable a company is in relation to its total assets
ROEλ-*Return on equity is a measure of financial performance
ROIλ-Return on Investment ratio measures the profitability of an investment by comparing the gain or loss to its cost
ROICλ-Return on Invested capital assesses a company’s efficiency in allocating capital to profitable investments
Market Value Ratios
PriceEarningsRatioλ-*Price-earnings Ratio measures a company's share price relative to its earnings per share
PriceToBookRatioλ-Many investors use the price-to-book ratio (P/B ratio) to compare a firm's market capitalization to its book value and locate undervalued companies.
PriceToSalesRatioλ-Price to Sales (P/S) Ratio is an indicator of the value that financial markets have placed on each dollar of a company's sales or revenues
PriceToCashRatioλ-Price to Cash (P/CF) Ratio is a stock valuation indicator or multiple that measures the value of a stock’s price relative to its operating cash flow per share
BVPSλ-Book value per share ratio is an indicator of the value of a company’s stock
CAPERatioλ-Measure that uses real earnings per share (EPS) over a 10-year period to smooth out fluctuations in corporate profits that occur over different periods of a business cycle (aka Shiller PE Ratio)
DividendPayoutRatioλ-Dividend Payout Ratio is the percentage of earnings paid to shareholders via dividends
DividendYieldRatioλ-Dividend yield ratio shows how much a company pays out in dividends
EPSλ-Earnings per share measures profitability indicating how much profit each outstanding share of common stock has earned
RetentionRatioλ-Retention Ratio is the proportion of earnings kept back in the business as retained earnings
* These are considered 'Key Ratios'
The Financial Starter Pack includes a 3-way financial model that uses 5g functions to create its 100% dynamic array calculations with no special skills. That's because 5g functions look and feel just like Excel's functions so anyone who can use SUM() can use 5g functions.
No special skills required!
5G functions can make dynamic arrays do some incredible things. Watch the video to see how one 5G function in one cell can calculate an entire deprecition schedule for ALL assets and ALL periods:
Depreciation Demo: https://youtu.be/pEzzBVG9WVE
5g functions are easy to load into any workbook. See how easy in this video:
Load 5g Functions: https://youtu.be/2SEYLHzyw3k
You get all this!
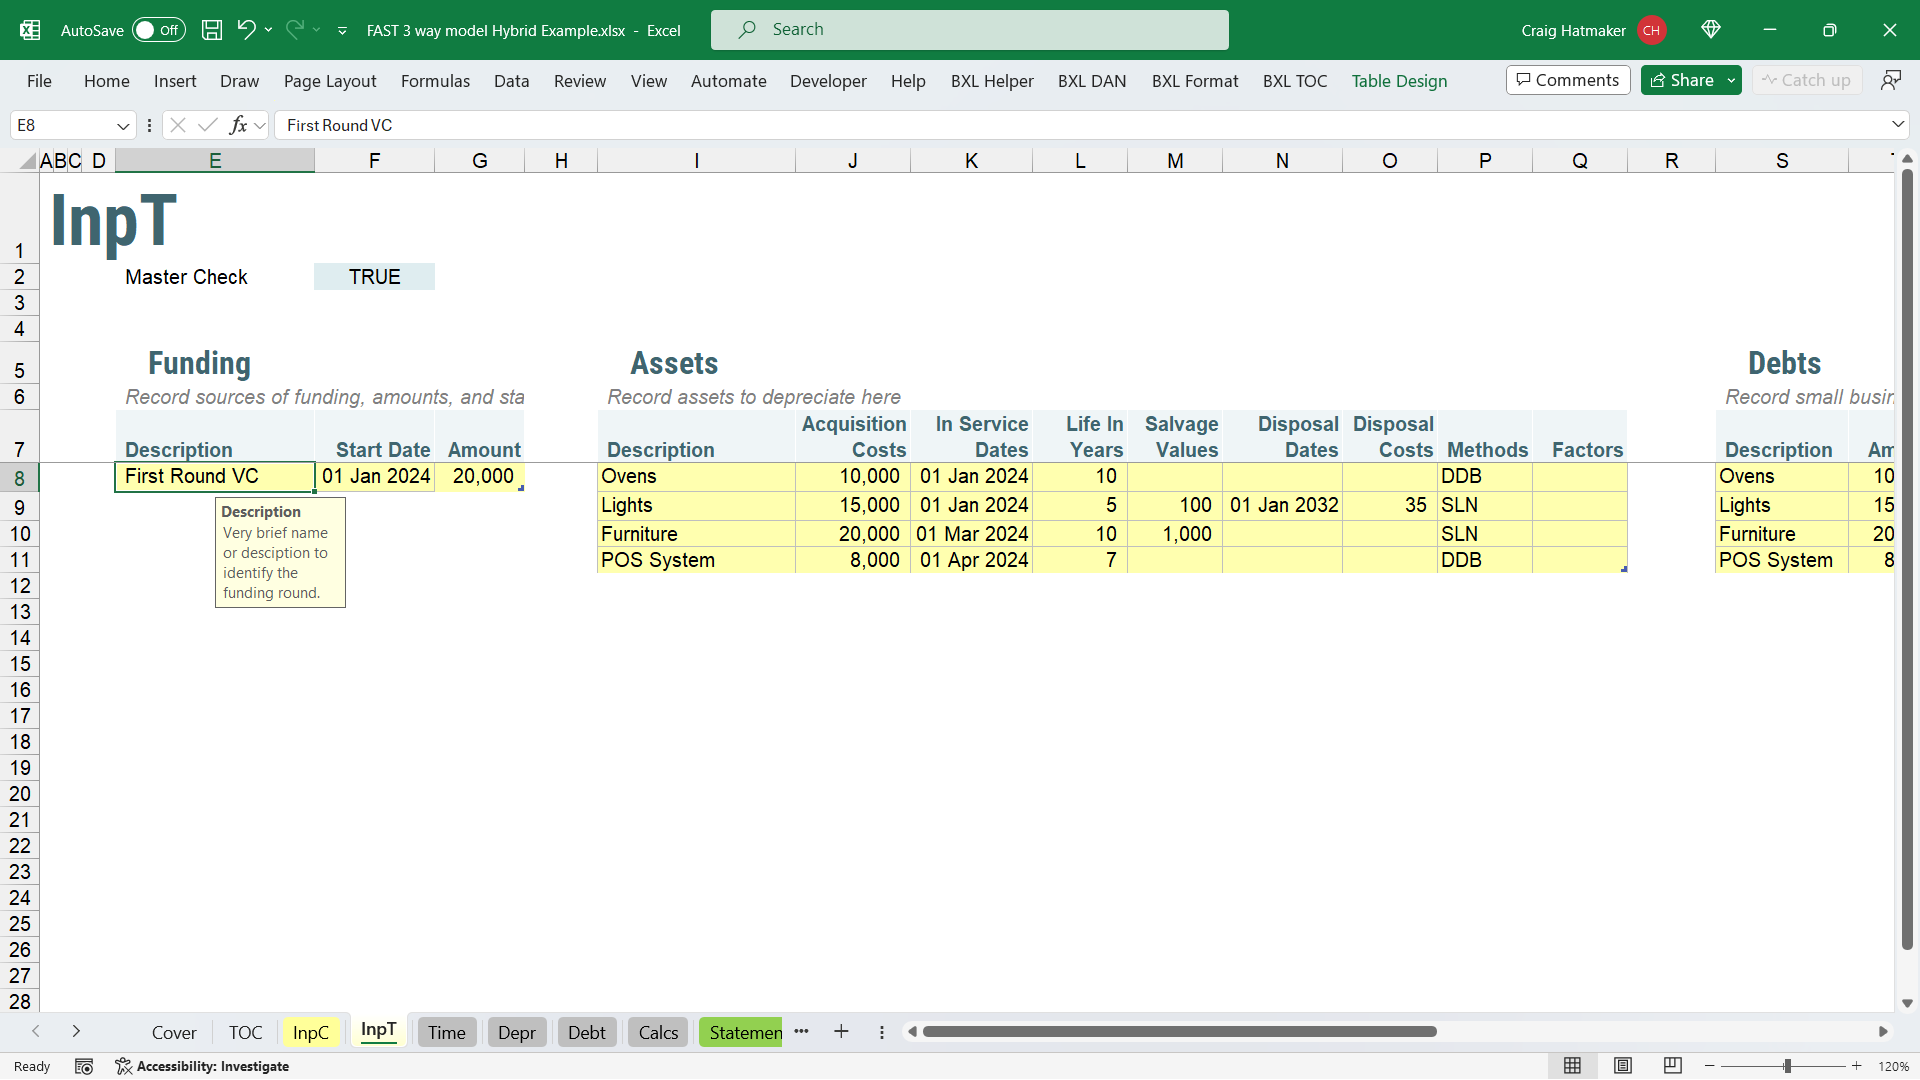
* An example 3-way financial model* All the functions listed below (and more)
* A workbook that explains each function and provides working examples to play with.
* A video showing step by step how we converted a FAST model to dynamic arrays
* The original model from the step by step video.
* The converted model from the step by step video* NEW! 38 Financial Ratios
Dates Library
BXD.Aboutλ - About the BXL 5G Function Library for Dates
BXD.CountDOWλ - Count instances of a specific day of the week between two dates
BXD.IsBetweenλ - Determine if a value is between a lower and upper limit
BXD.IsOccurrenceDateλ - Determine if a date passed is when a potentially repeating event happens
BXD.OverLapDaysλ - Return how many days overlap two period ranges.
BXD.Periodsλ - Determine the number of periods from Starts to Ends inclusive
BXD.PeriodLabelλ - Creates a label for a date based on period interval
BXD.ScheduleRatesλ - Schedule rates that persist until replaced in a timeline.
BXD.ScheduleRatesByItemsλ - Schedule rates that persist until replaced in a timeline for each item in a list.
BXD.ScheduleValuesλ - Schedules values in a timeline.
BXD.ScheduleValuesByItemsλ - Schedules values in a timeline for each item in a list.
BXD.Timelineλ - Creates a horizontal list of start or end dates for a timeline
FInancials Library
BXF.Aboutλ - About the BXL 5G Function Library for the Financial Starter Pack
Amortization suite
BXF.Amortizeλ - Creates a corkscrew amortization schedule.
BXF.LabelAmortizeλ - Create row labels for Amortizeλ result
BXF.SumAmortizeλ - Create totals for payments, interest, and principal portion in Amortizeλ results
BXF.Corkscrewλ - Creates a simple corkscrew where the closing balance is the sum of independent flows plus opening balance
BXF.Cumulativeλ - Creates a row or column of cumulative totals from a total row or column
Deperciation suite
BXF.Depreciateλ - Create a block of CAPEX, Opening Balance, Depreciation Values, and Book Value for each asset
BXF.LabelDepreciateλ - Create row labels for Depreciateλ result
BXF.SumDepreciateλ - Create row totals appropriate for Depreciateλ's results
BXF.IntOnIntλ - Calculate Interest on Interest. Use to determine amount needed to cover debt plus interest on debt
BXF.IRRλ - Calculates IRR, correcting for when the first investment is not in the first period
BXF.Movementλ - Create a row of differences from column to column
BXF.RollingSumλ - Creates rolling totals for a row of values.
BXF.SumContainsλ - Totals rows where their labels match a unique letter, word or phrase.
BXF.SumRowsλ - Creates totals for each row in array.
BXF.SumColsλ - Creates totals for each column in an array'.
BXF.SumPeriodsλ - Groups and totals all columns in a Values array by period resulting in one column for each period.
BXF.TimelineOffsetλ - Determines how many columns a date is offset from a timeline's first date
BXF.TimelinePositionλ - Places an array or value appropriately within a model's timeline.
Array Essentials Library
CountCλ - Count how many of one or more characters are in a text string
SumColsλ-Get the total of each column
SumRowsλ-Get the total of each row
AvgColsλ-Get the average of each column
AvgRowsλ-Get the average of each row
MinColsλ-Get the minimum of each column
MinRowsλ-Get the minimum of each row
MaxColsλ -Get the maximum of each column
MaxRowsλ-Get the maximum of each row
CountColsλ-Get the count of numbers in each column
CountRowsλ-Get the count of numbers in each row
CountAColsλ-Get the count of everything of each column
CountARowsλ-Get the count of everything of each row
IsBetweenλ-Determine if a value is between a lower and upper limit.
RangeToDAλ-Convert a range reference to a dynamic array reference
NEW! Financial Ratios
Liquidity Ratios
CurrentRatioλ-Measures ability to pay short-term obligations
QuickRatioλ-Measures ability to meet short-term obligations
CashRatioλ-Evaluates ability to repay short-term debt w/cash or near-cash resources
OperatingCashFlowRatioλ-Measures how readily current liabilities are covered by cash flows generated from operations.
ReceivablesTurnoverRatioλ-Indicates effectiveness in collecting outstanding balances from clients and managing line of credit process
InventoryTurnoverRatioλ-Shows how many times a company turned over its inventory relative to its cost of goods sold
WorkingCapitalTurnoverRatioλ-Working Capital Turnover Ratio measures how efficiently a company is using its working capital to support sales and growth
Leverage Ratios
DebtRatioλ-Measures the extent of a company's leverage
DSCRλ-Debt service coverage Ratio measures a firm’s available cash flow to pay its current debt obligations
DebtToCapitalRatioλ-Gives analysts and investors a better idea of a company's financial structure and whether or not the company is a suitable investment
EquityMultiplierλ-Measures the portion of a company’s assets financed by shareholders'equity rather than by debt
Solvency Ratios
DebtToEquityRatioλ-Measures the degree to which a company is financing operations with debt rather than its own resources.
DebtToAssetRatioλ-Analysts can compare one company's leverage with that of other companies in the same industry.
InterestCoverageRatioλ-Determines how easily a company can pay interest on its outstanding debt
EquityRatioλ-Measures the long-term solvency of a company by comparing its shareholders’ equity to its total assets
Efficiency Ratios
AssetTurnoverRatioλ-Measures the value of a company's sales or revenues relative to the value of its assets.
DSIRatioλ-Days Sales in Inventory Ratio (aka Average age of inventory indicates the average time in days that a company takes to turn its inventory
OperatingRatioλ-Shows how efficient management is at keeping costs low while generating revenue
Profitability Margins & Ratios
GrossMarginλ-Shows how much profit a company makes after paying off its Cost of Goods Sold
EBITDAMarginλ-Measures a company's operating profit as a percentage of its revenue
OperatingMarginλ-Measures how much profit a company makes on a dollar of sales after paying for variable costs of production, such as wages and raw materials, but before paying interest or tax
PretaxMarginλ-Measures the operating efficiency of a company
NetProfitMarginλ-Measures how much net income or profit a company generates as a percentage of its revenue.
CashFlowMarginλ-Cash Flow Margin is a trusted metric of a company’s profitability and efficiency and its earnings quality
ROAλ-*Return on Assets Indicates how profitable a company is in relation to its total assets
ROEλ-*Return on equity is a measure of financial performance
ROIλ-Return on Investment ratio measures the profitability of an investment by comparing the gain or loss to its cost
ROICλ-Return on Invested capital assesses a company’s efficiency in allocating capital to profitable investments
Market Value Ratios
PriceEarningsRatioλ-*Price-earnings Ratio measures a company's share price relative to its earnings per share
PriceToBookRatioλ-Many investors use the price-to-book ratio (P/B ratio) to compare a firm's market capitalization to its book value and locate undervalued companies.
PriceToSalesRatioλ-Price to Sales (P/S) Ratio is an indicator of the value that financial markets have placed on each dollar of a company's sales or revenues
PriceToCashRatioλ-Price to Cash (P/CF) Ratio is a stock valuation indicator or multiple that measures the value of a stock’s price relative to its operating cash flow per share
BVPSλ-Book value per share ratio is an indicator of the value of a company’s stock
CAPERatioλ-Measure that uses real earnings per share (EPS) over a 10-year period to smooth out fluctuations in corporate profits that occur over different periods of a business cycle (aka Shiller PE Ratio)
DividendPayoutRatioλ-Dividend Payout Ratio is the percentage of earnings paid to shareholders via dividends
DividendYieldRatioλ-Dividend yield ratio shows how much a company pays out in dividends
EPSλ-Earnings per share measures profitability indicating how much profit each outstanding share of common stock has earned
RetentionRatioλ-Retention Ratio is the proportion of earnings kept back in the business as retained earnings
* These are considered 'Key Ratios'
This Best Practice includes
1 Excel Workbook containing Financial Starter Pack functions plus links to tutorial videos and 3 workbooks
Further information
Prepare for the future of Excel modeling using dynamic arrays and industry specific pre-tested functions.
Requires Excel 365.
Not compatible with older versions of Excel. Only tested with English language Excel.
