

Originally published: 08/08/2023 09:27
Publication number: ELQ-10697-1
View all versions & Certificate
Publication number: ELQ-10697-1
View all versions & Certificate

Investment Holding Company 3 Statement Financial Projection Model
3 statement 5 or 8 year rolling financial projection Excel model for an holding company with investments in up to 8 portfolio companies.
holding companyinvestment returnportfolio companiesfinancial modelfinancial projectionvaluationrolling forecastdashboardexcelfinancial investments
Description
PURPOSE OF MODEL
Highly versatile and user-friendly Excel model for the preparation a of 5-year or 8-year rolling 3 statement (Income Statement, Balance Sheet and Cash flow Statement) financial projection with a monthly timeline for a startup or existing investment company holding investments in up to 8 portfolio companies and generating investment return included dividend income realised and unrealised fair value gains and losses and transaction fees.
The model also allows the user to model investments in other financial instruments (money market, bonds, equities, alternatives etc), other ancillary income, staff costs, operating expenses, fixed assets and borrowings making it a versatile and comprehensive model for any holding company business looking to project investment return, cash flows and key ratios including IRR by portfolio company.
The model follows good practice financial modelling principles and includes instructions, line-item explanations, checks and input validations and incorporates a discounted cash flow valuation calculation using the projected cash flows.
KEY OUTPUTS
The key outputs include:
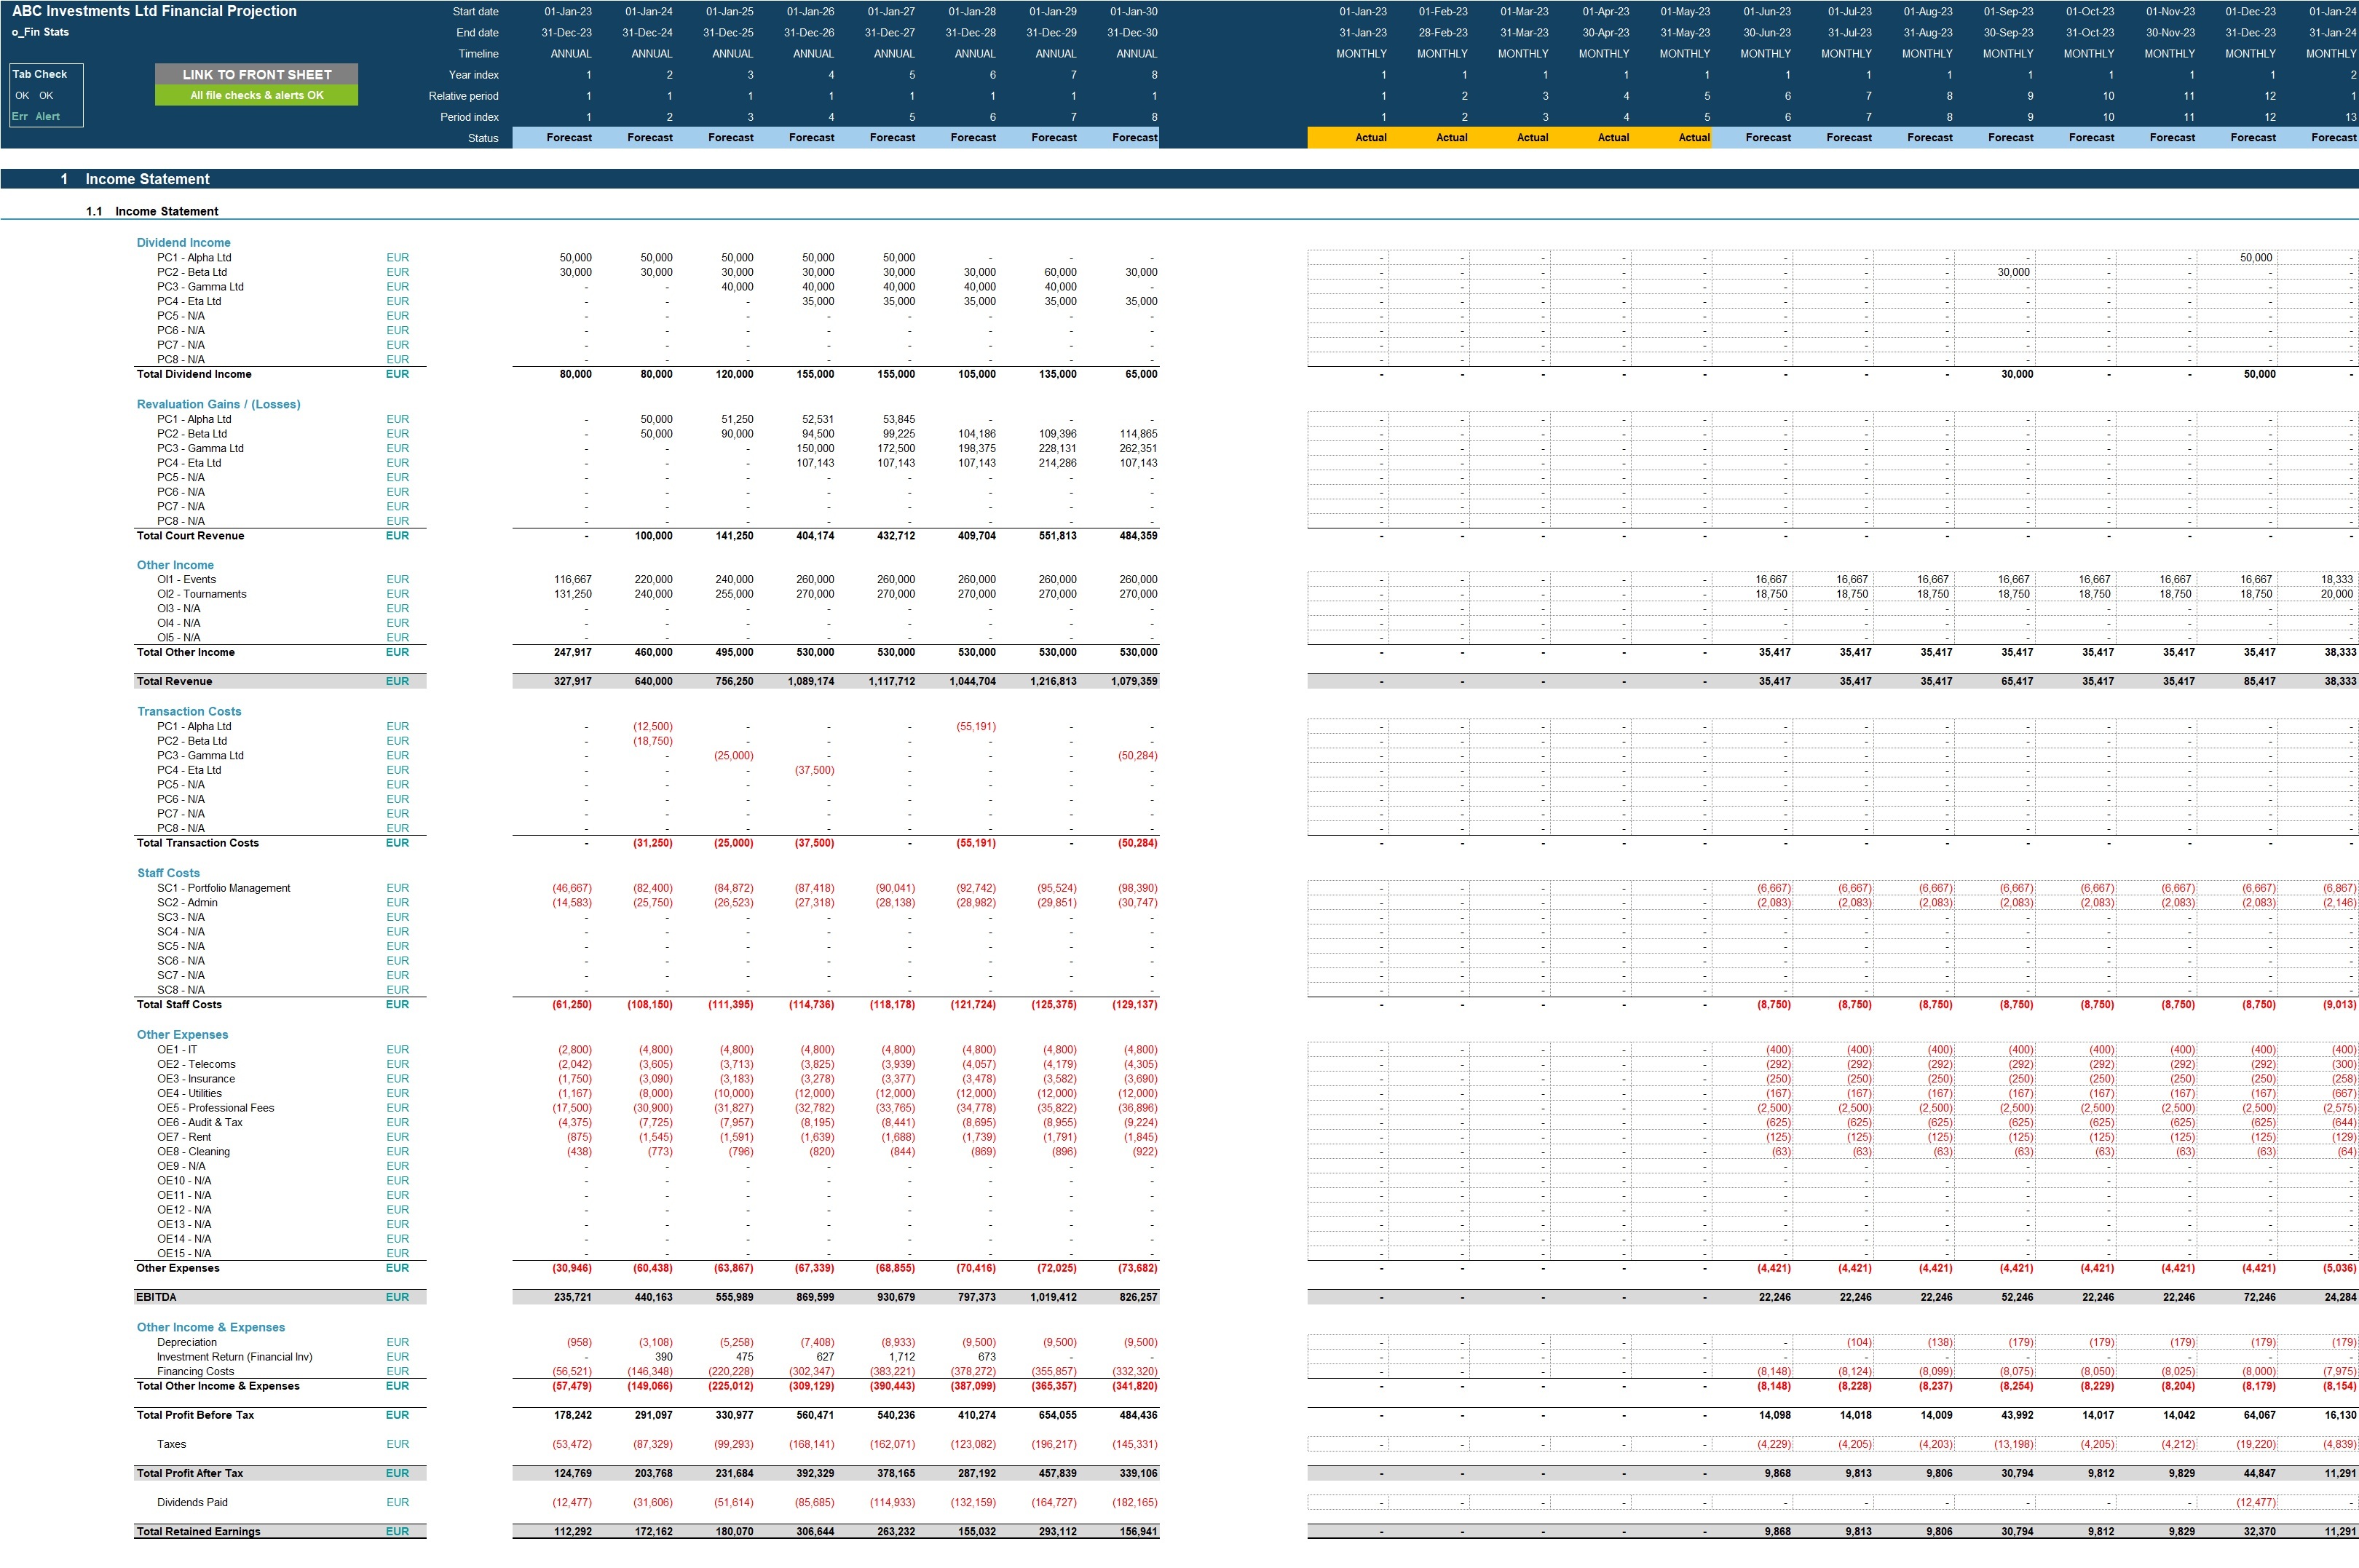
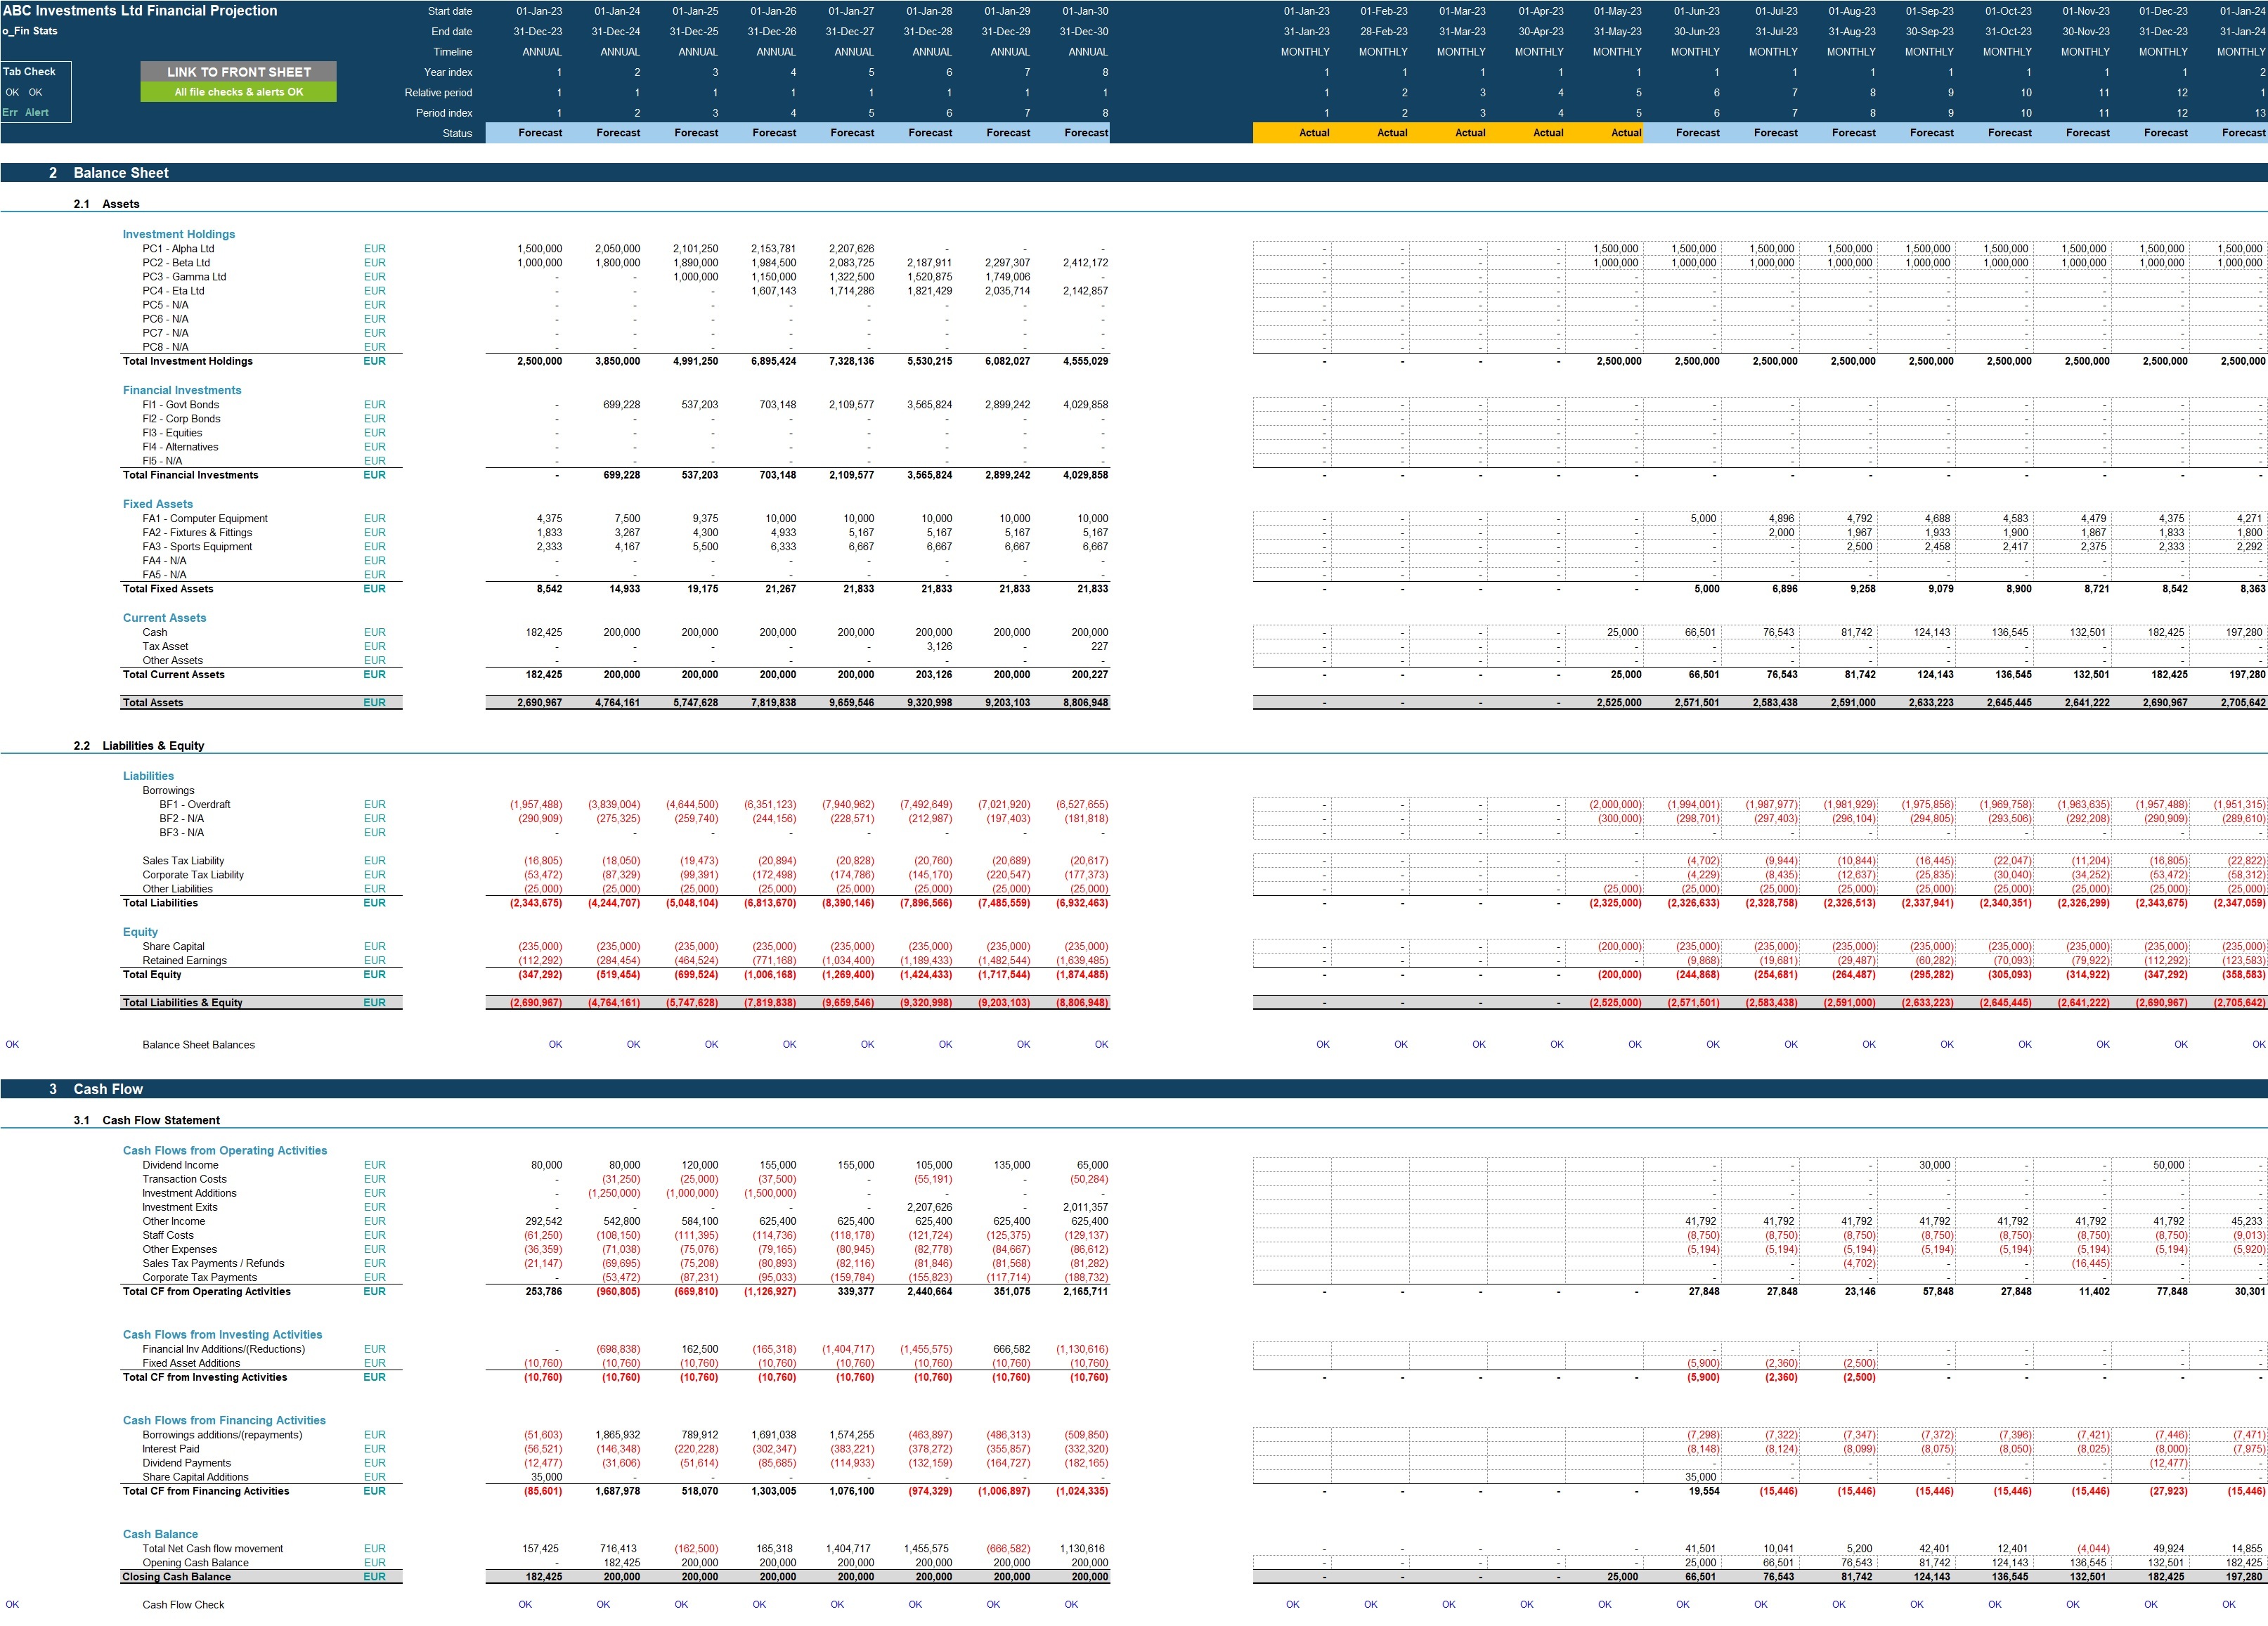
- Projected full financial statements (Income Statement, Balance Sheet and Cash flow Statement) presented on a monthly basis across up to 5 or 8 years and summarised on an annual basis.
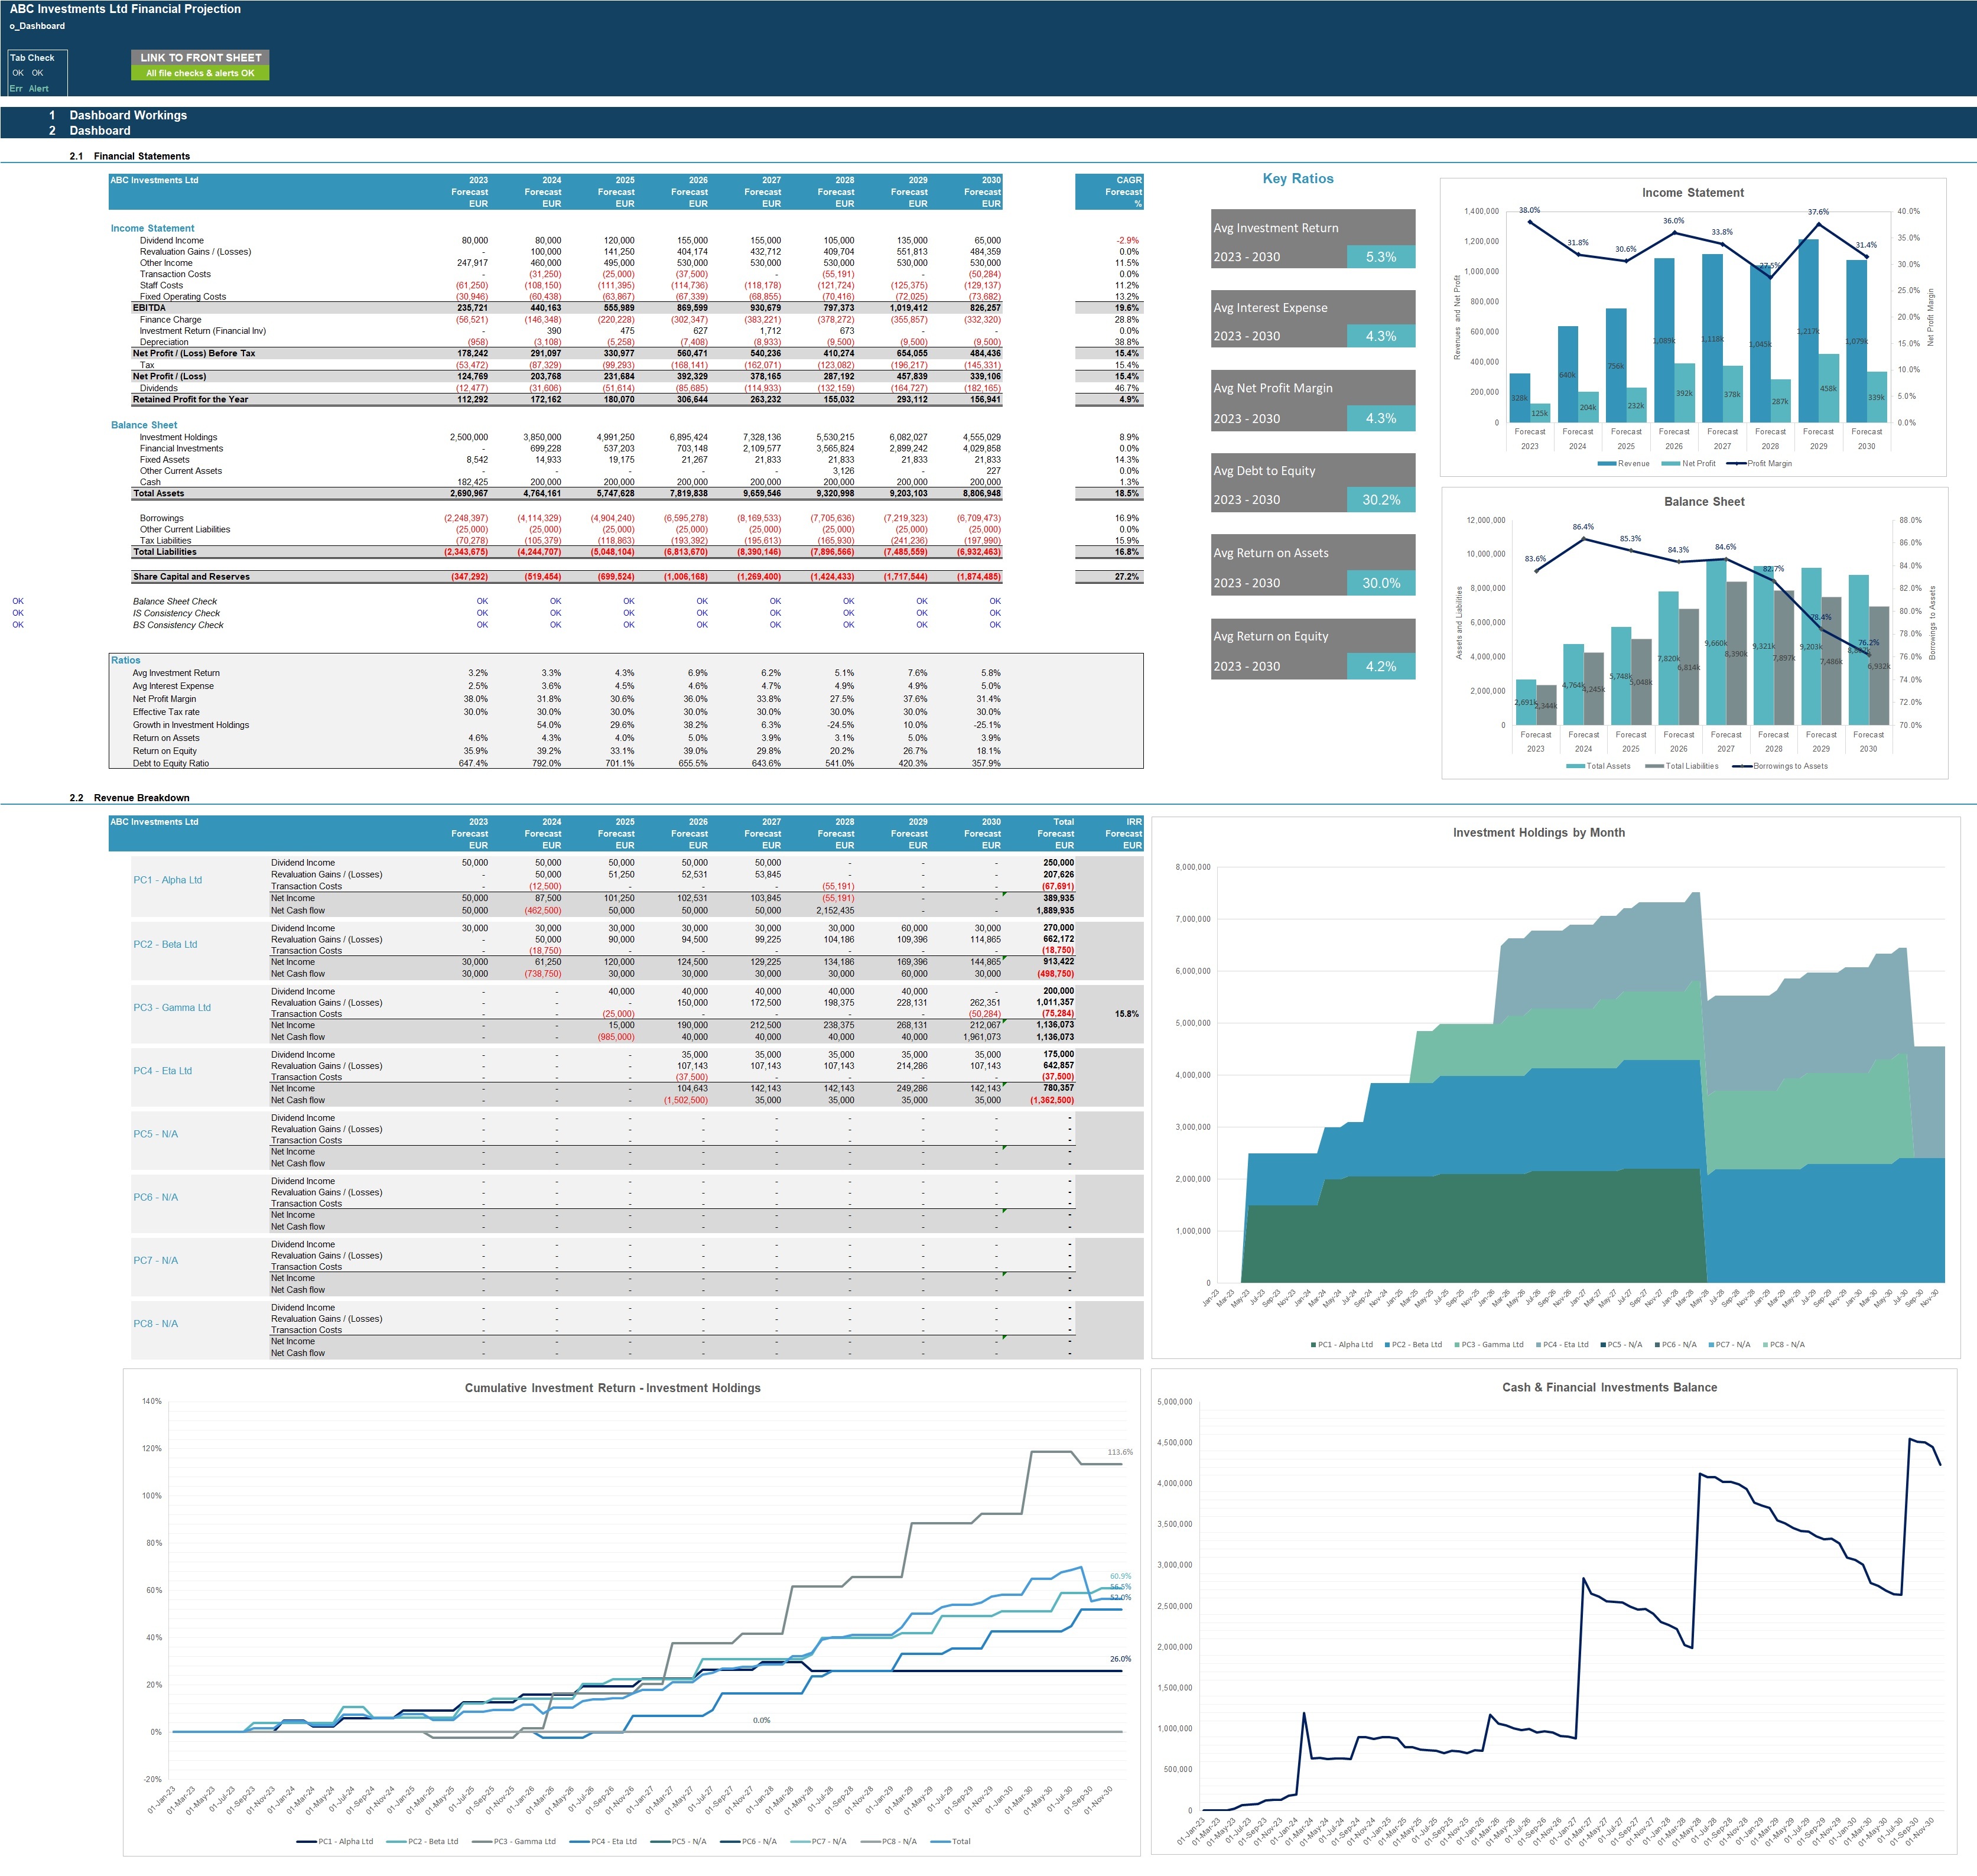
- Dashboard with:
o Summarised projected Income Statement and Balance Sheet;
o Compounded Annual Growth rate (CAGR) for each summarised income statement and Balance Sheet line item;
o List of key ratios including average investment return, average profit margins, average return on assets and equity and average debt to equity ratio;
o Bar charts summarising income statement and Balance Sheet projections;
o Table presenting investment return by investment holding and IRR (if applicable)
o Charts presenting split of investment holding by portfolio company, cash and financial investment balance by month, cumulative investment return by month
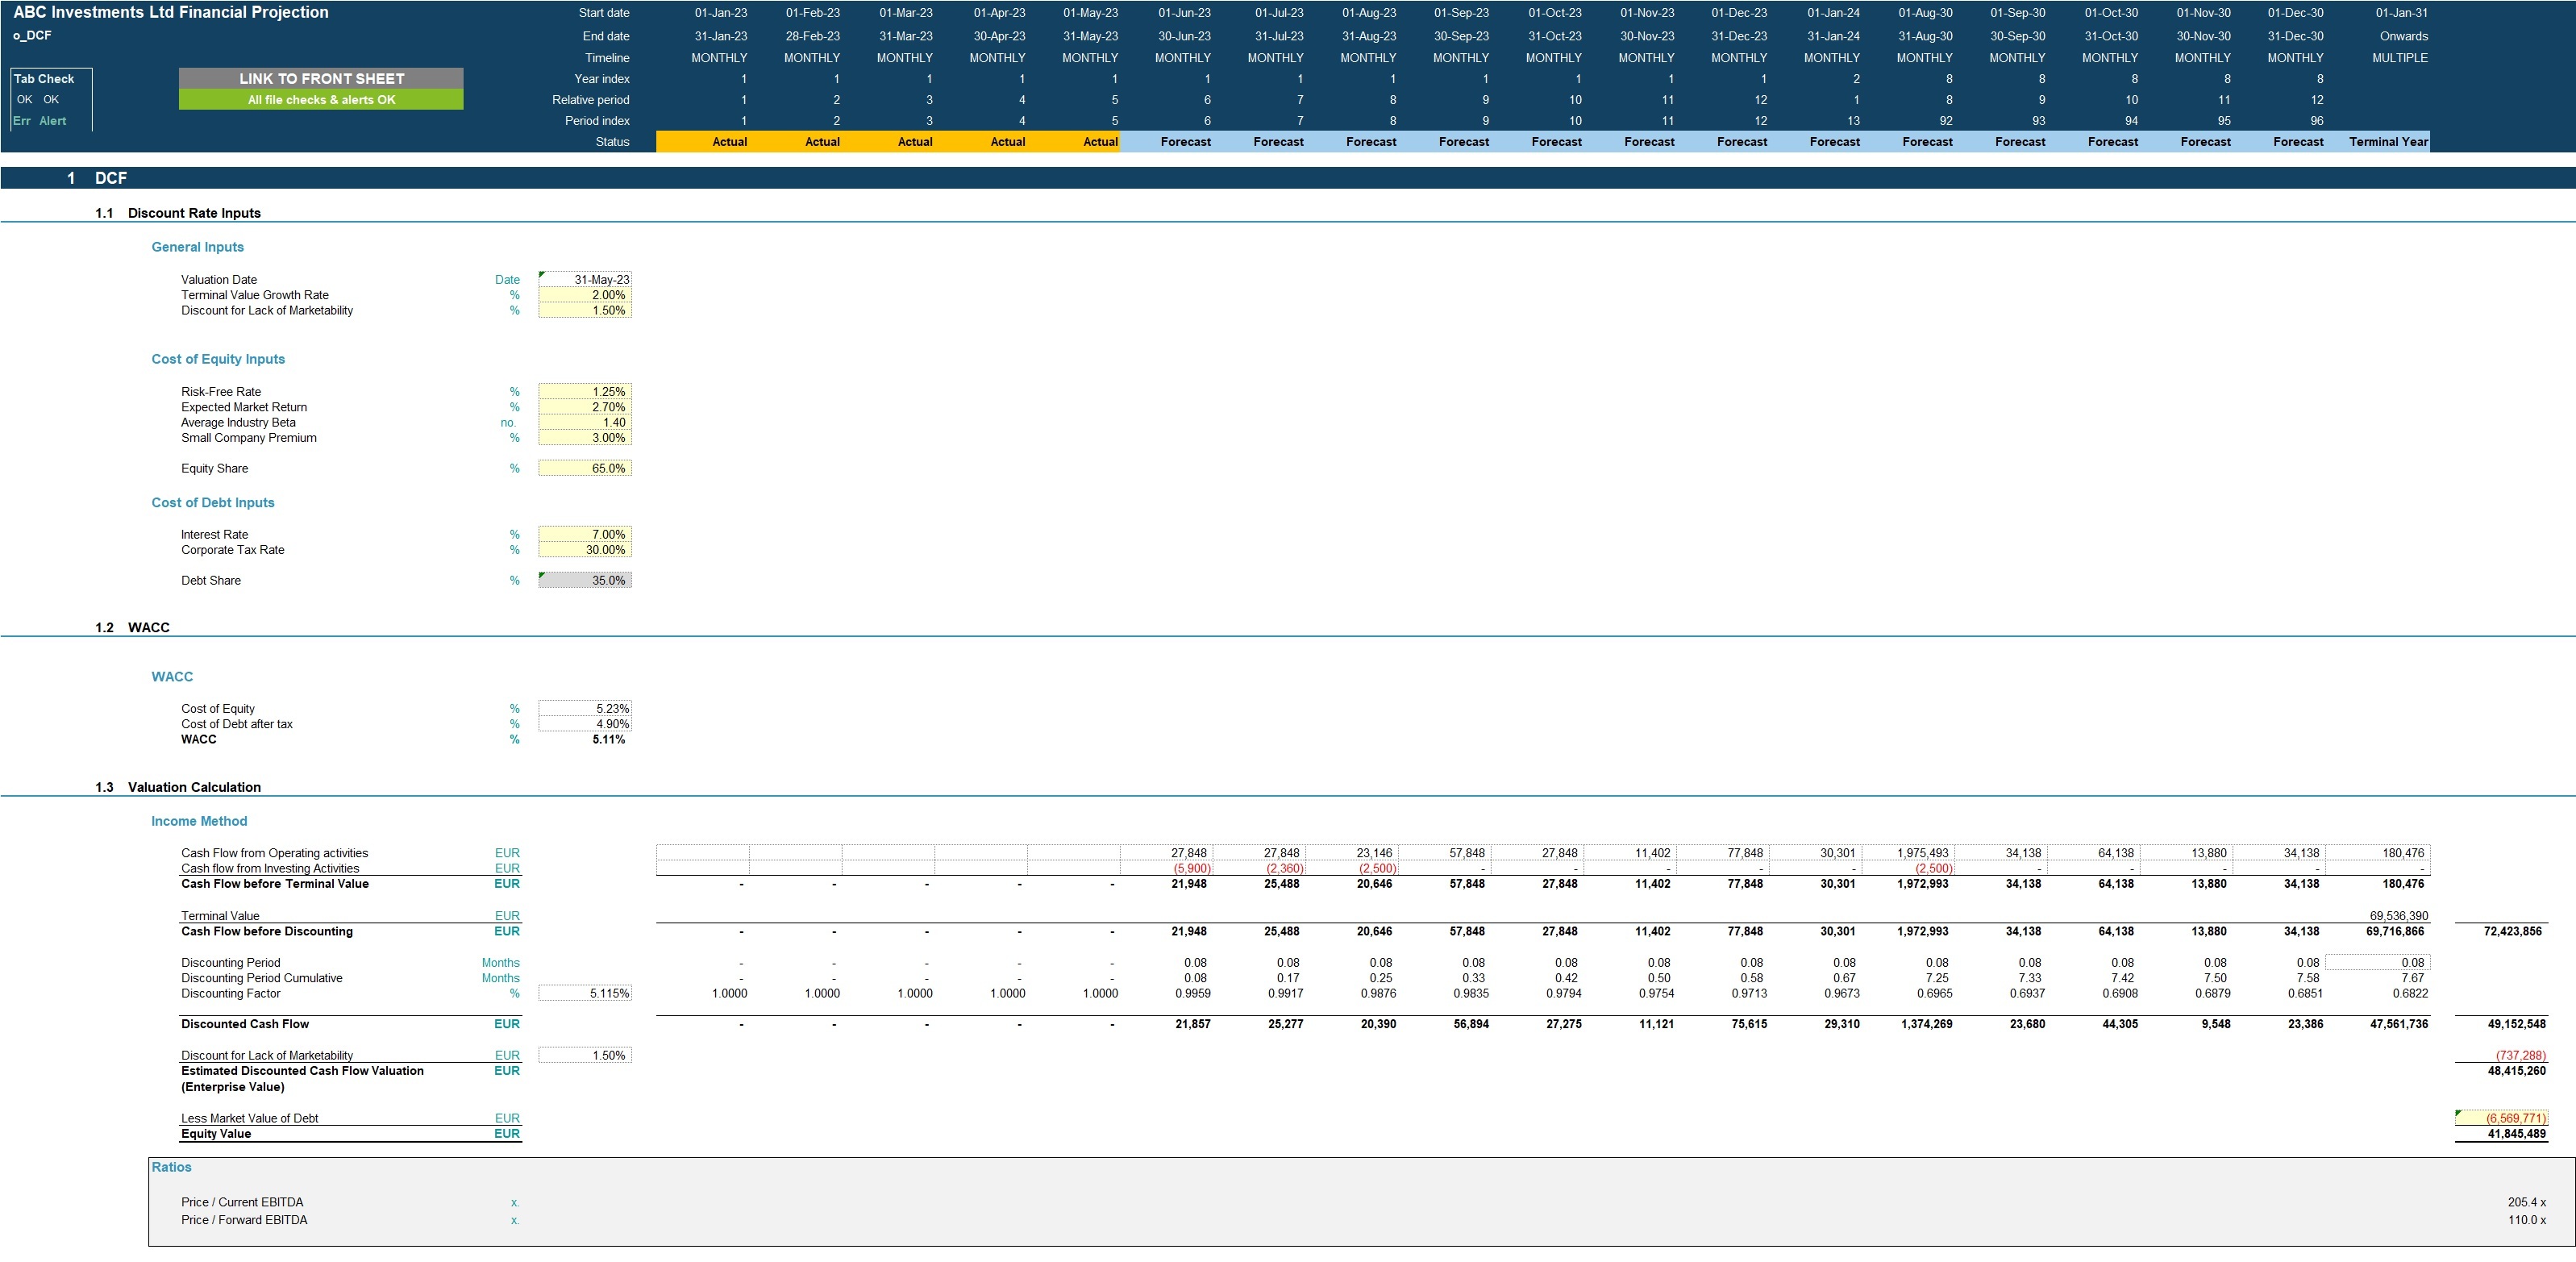
- Discounted cash flow valuation using the projected cash flow output.
KEY INPUTS
Inputs are split into Income Statement and Balance Sheet Inputs. Most inputs include input validations to help users understand what the input is for and populate correctly.
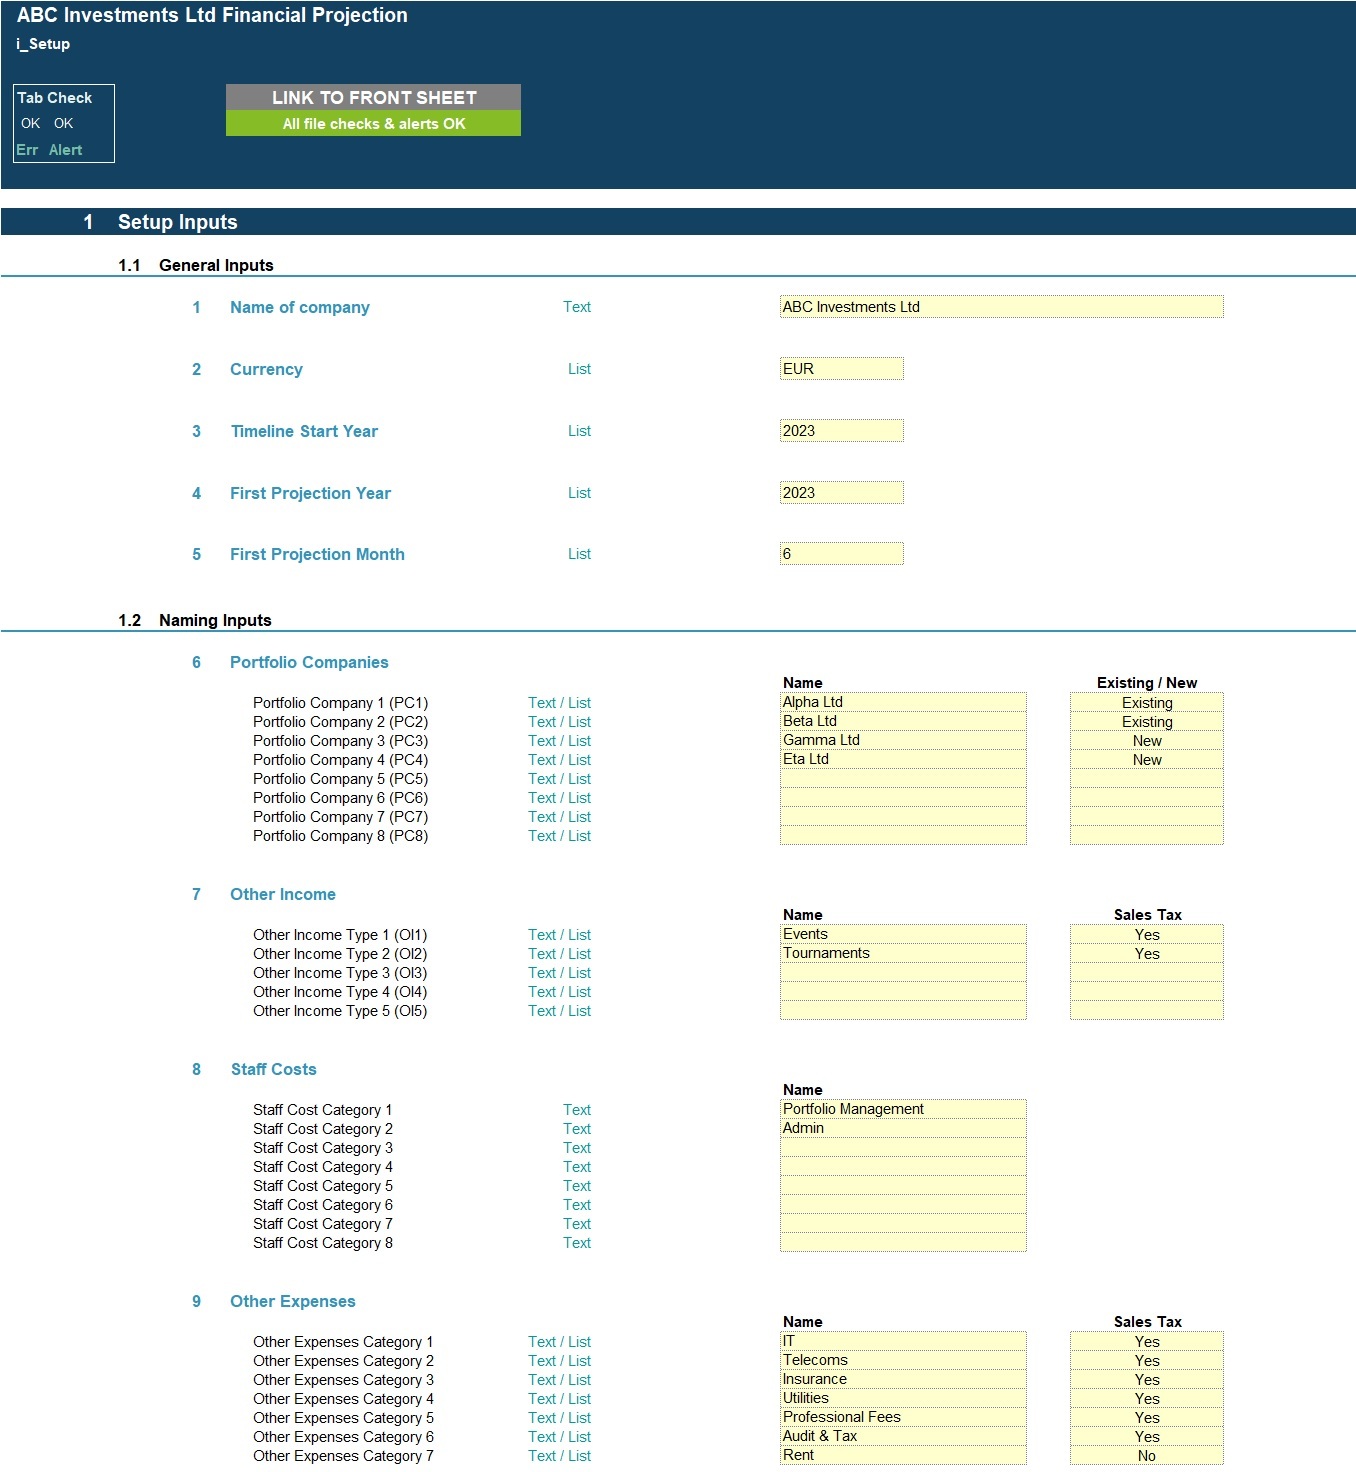
Setup Inputs:
- Name of business;
- Currency;
- First projection year and month;
- Naming for portfolio companies, other income, staff costs, other expenses, financial investments, fixed assets and borrowings.
- Sales tax applicability for revenue and cost categories;
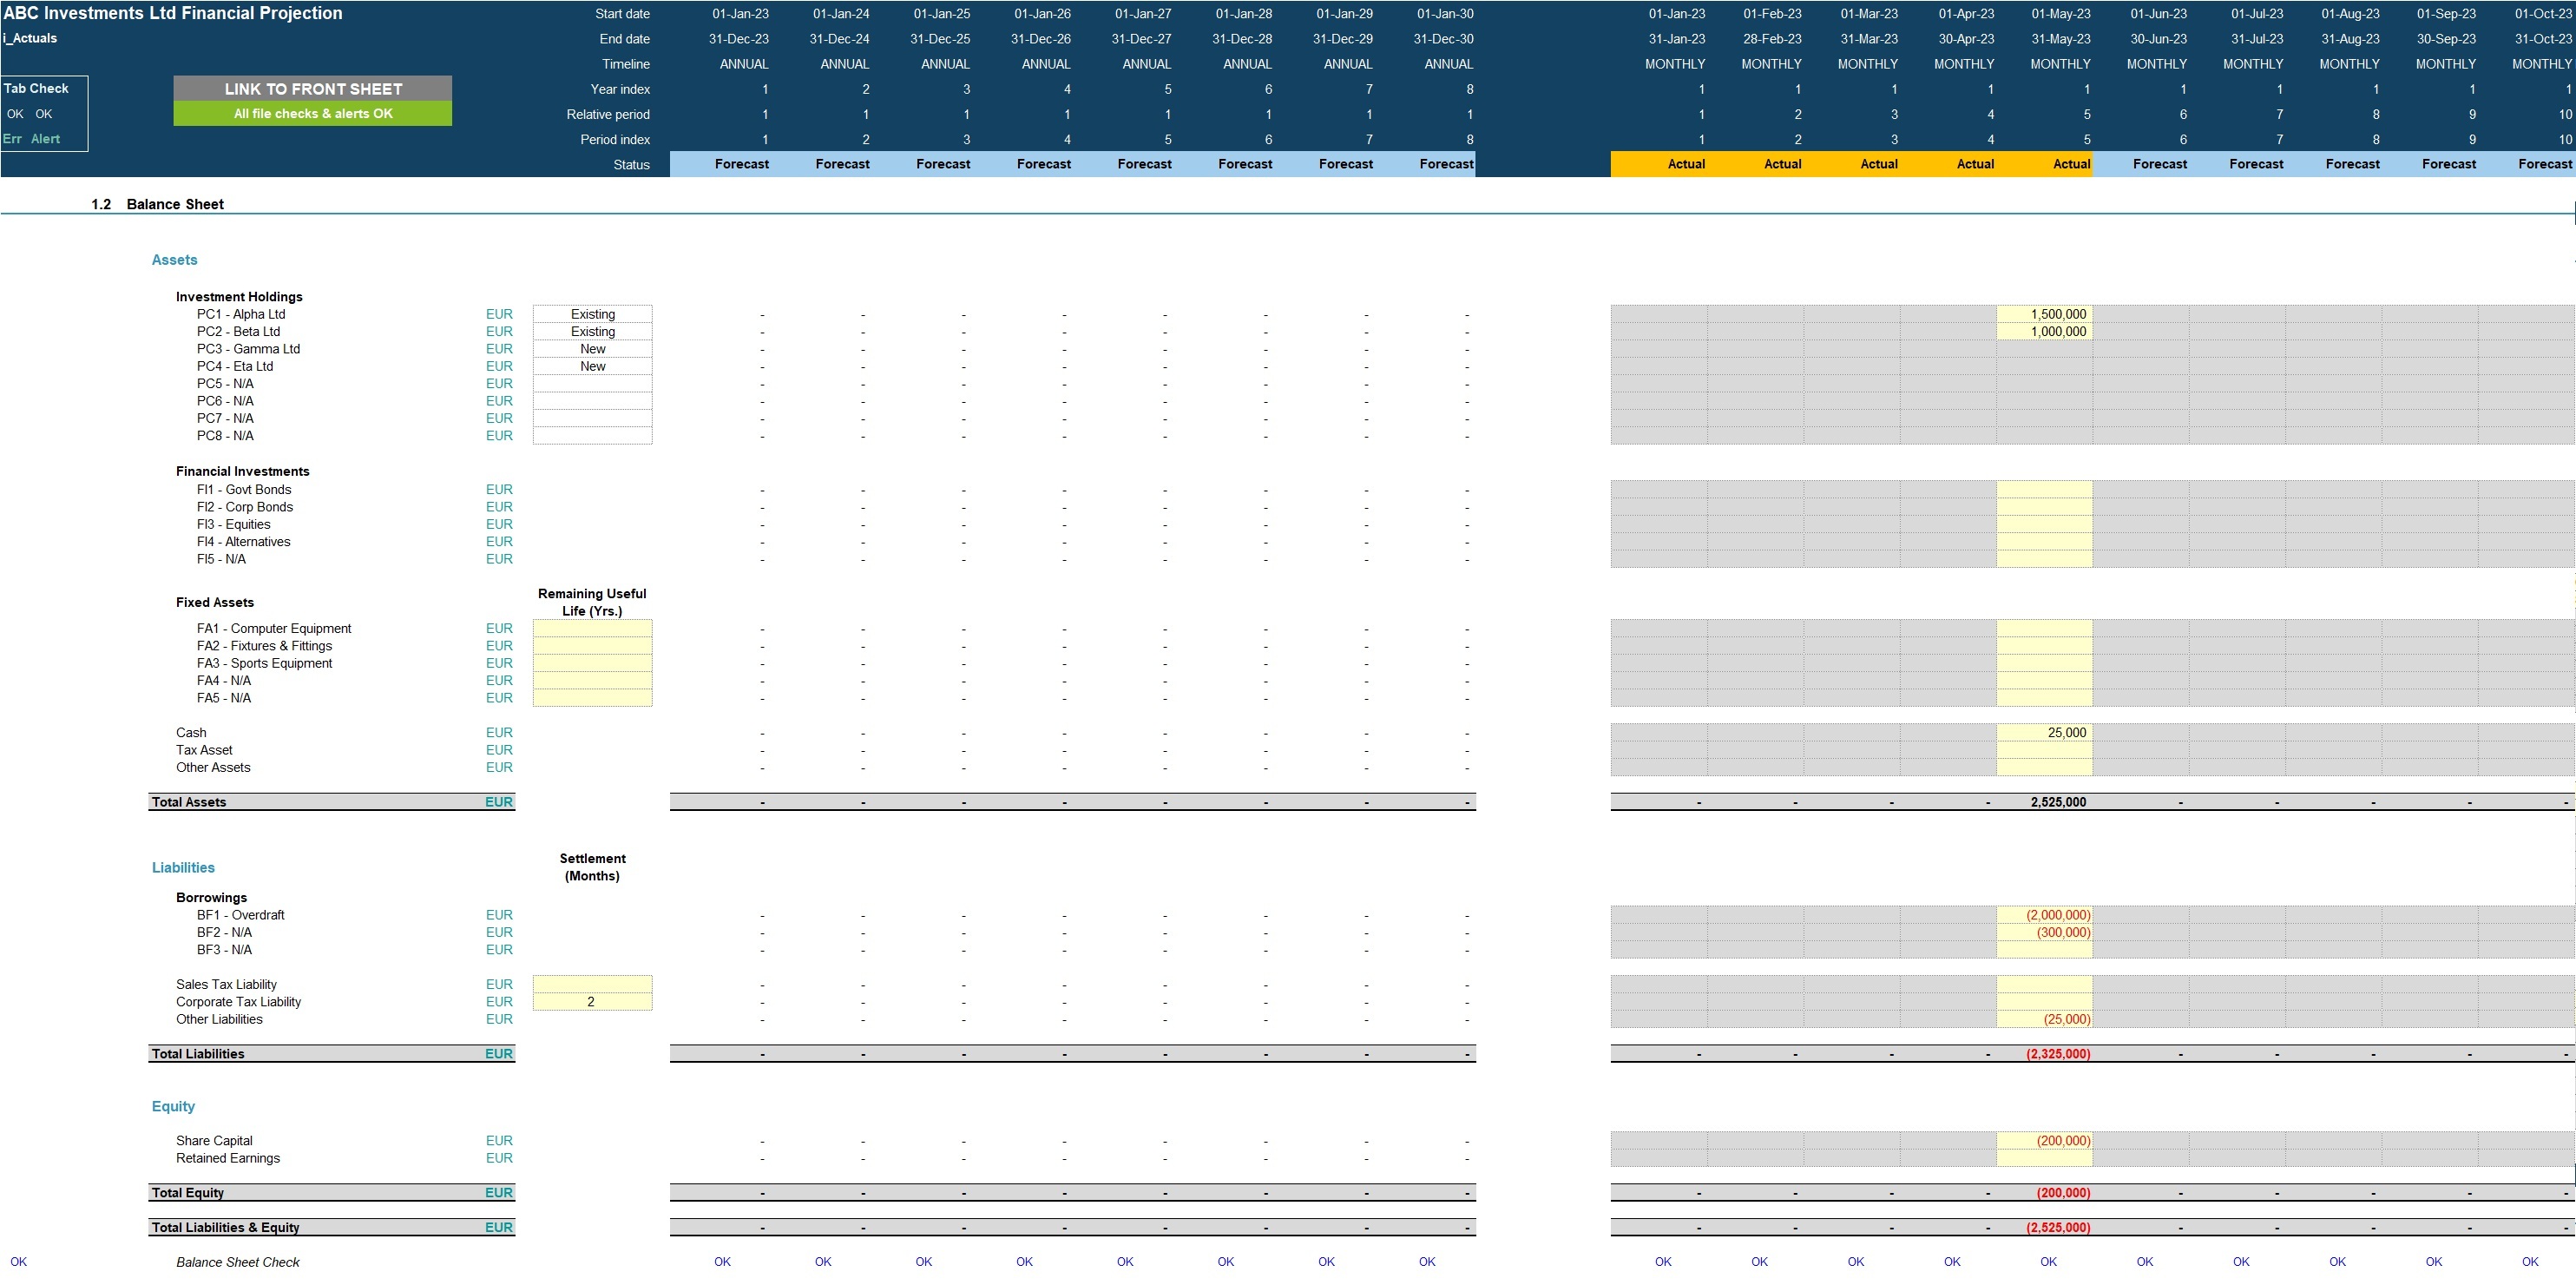
Actuals Inputs:
- Opening balance sheet (for existing businesses);
- Income Statement actuals (for trend analysis);
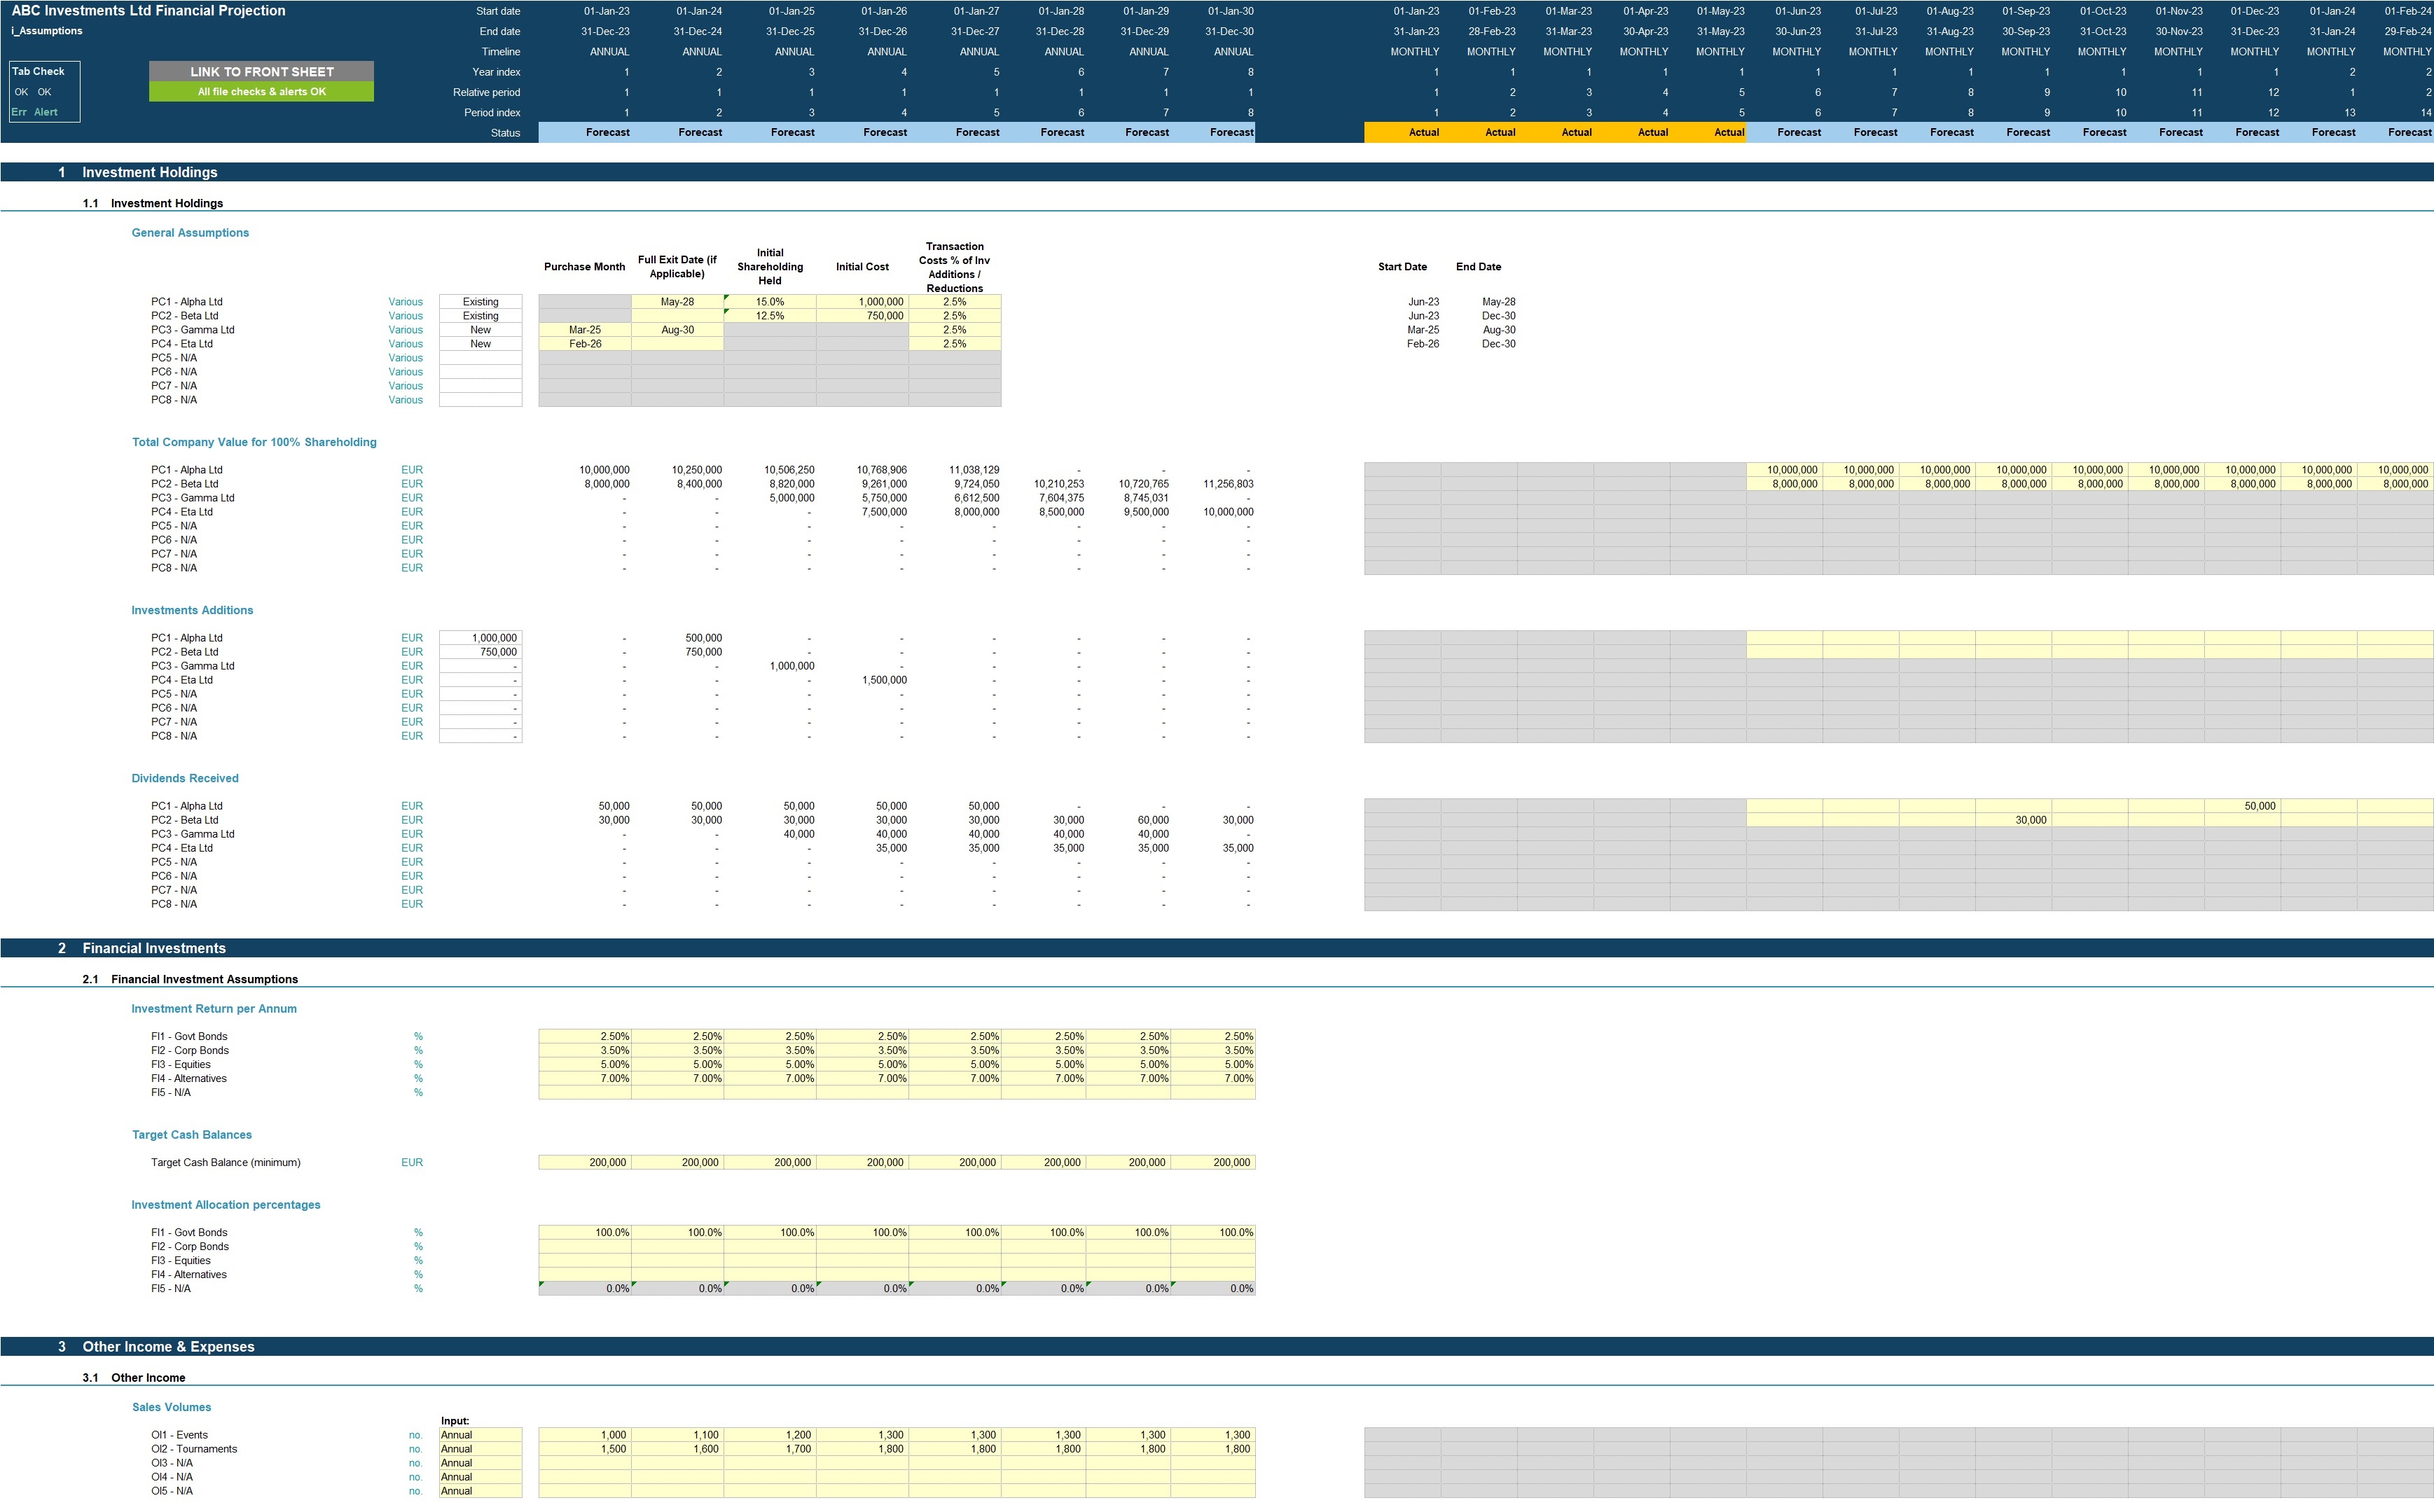
Projection Inputs:
- Portfolio Company Investment Return
o Portfolio company valuation;
o Investment additions;
o Investment exit date;
o Transaction cost %;
o Dividends received.
- Financial Investment Assumptions
o Investment Return per Annum;
o Target Cash Balances;
o Investment Allocation percentages;
- Other Income
o Volume and Rate / revenue per unit;
- Other cost inputs including
o Staff costs;
o Other operating costs;
- Sales and corporate tax inputs including rate and payment periods;
- Dividend inputs including amount or percentage of retained earnings and frequency;
- Fixed Assets including addition amounts and useful life;
- Borrowings including addition/redemption amounts and interest rate;
- Share Capital additions.
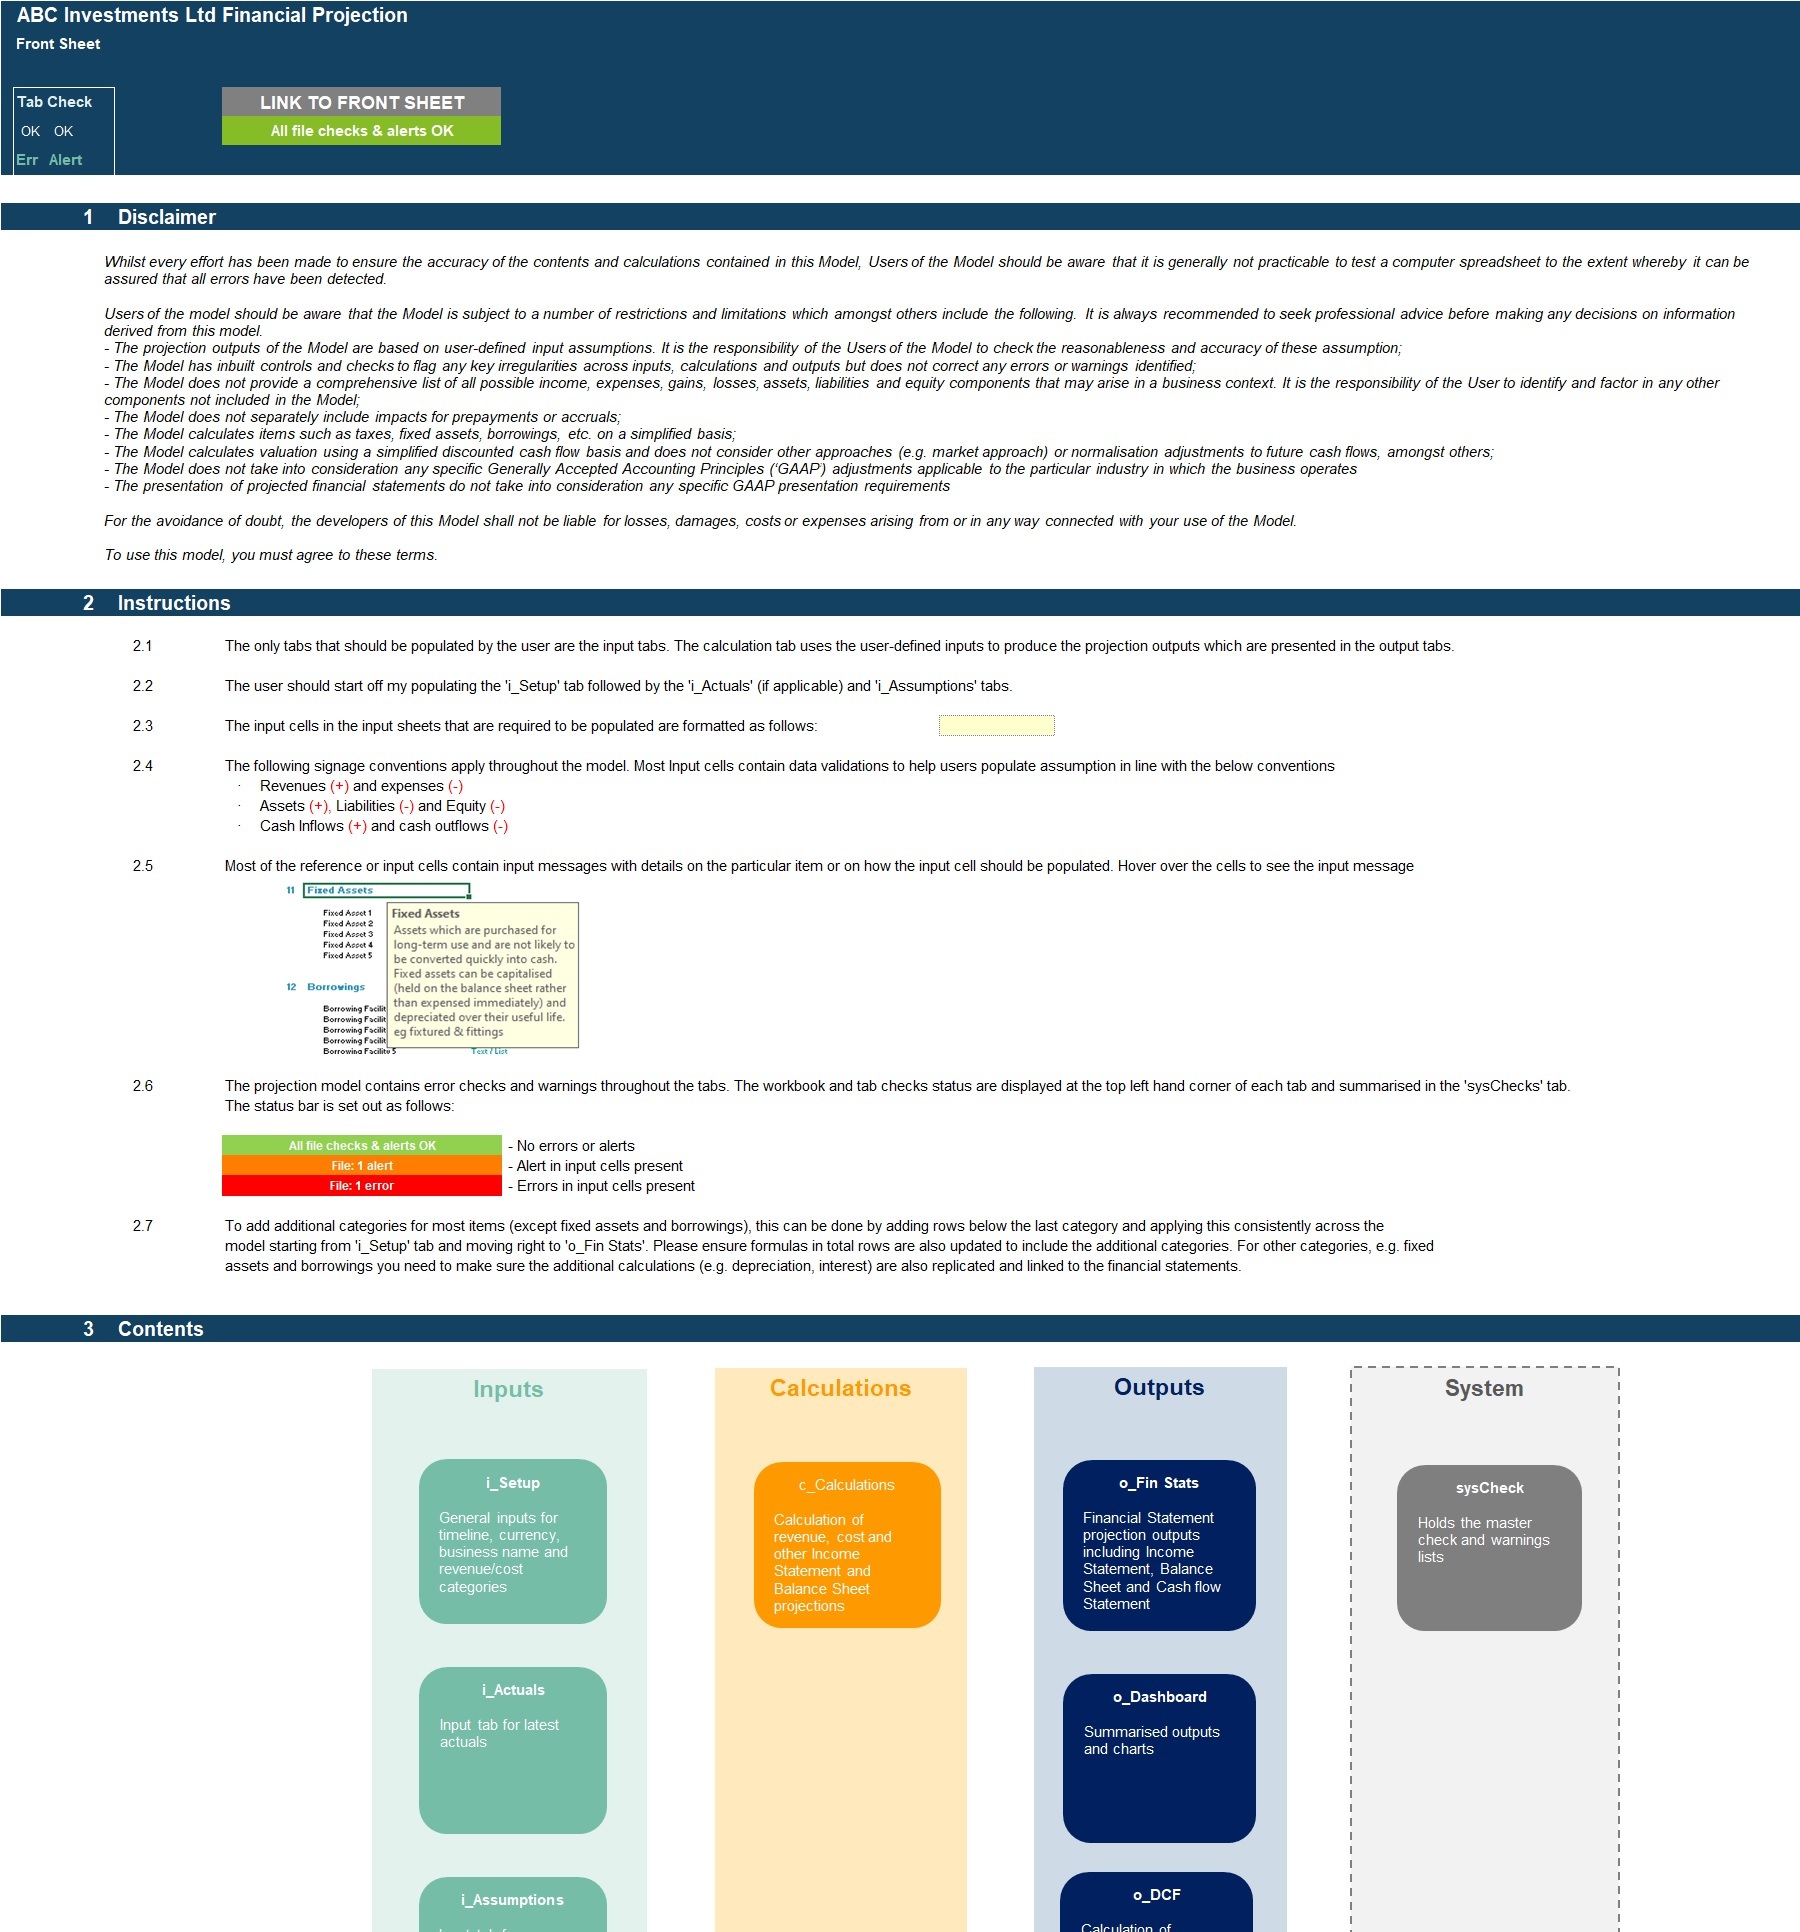
MODEL STRUCTURE
The model comprises of 9 tabs split into input ('i_'), calculation ('c_'), output ('o_’) and system tabs. The tabs to be populated by the user are the input tabs ('i_Setup', ‘i_Actuals’ and 'i_Assumptions'). The calculation tab uses the user-defined inputs to calculate and produce the projection outputs which are presented in 'o_Fin Stats', ‘o_Dashboard’ and ‘o_DCF’.
System tabs include:
- A 'Front Sheet' containing a disclaimer, instructions and contents;
- A Checks dashboard containing a summary of checks by tab.
KEY FEATURES
Other key features of this model include the following:
- The model follows best practice financial modelling guidelines and includes instructions, line item explanations, checks and input validations;
- The model is not password protected and can be modified as required following download;
- The model contains a dynamic timeline that allows for a mix of actual and forecast period across a 5-year or 8-year period allowing projections to be rolled forward from month to month;
- Timeline is split on a monthly basis and summarised on an annual basis;
- Model includes calculation of both realised and unrealised fair value gains and losses
- The model allows for the following number of underlying categories for each line item (these can be easily expanded if required):
o Portfolio companies – 8 companies
o Financial Investments – 5 categories
o Other income – 5 categories
o Staff costs – 8 categories;
o Other expenses – 15 categories;
o Fixed Assets – 5 categories;
o Borrowings – 3 facilities;
- Apart from projecting revenue and costs the model includes the possibility to model, financial investments, fixed assets, borrowings, dividends, corporate tax and sales tax;
- The model included an integrated discounted cash flow valuation using the projected cash flow outputs;
- Business name, currency, starting projection period are fully customisable;
- Revenue, cost, fixed asset and Borrowing category descriptions are fully customisable;
- The model includes instructions, line item explanations, checks and input validations to help ensure input fields are populated accurately;
- The model includes a checks dashboard which summarises all the checks included in the various tabs making it easier to identify any errors.
MODIFICATIONS
If you require any be-spoke modifications to the tool, we are more than happy to assist with this. Please send us a private message
ABOUT PROJECTIFY
We are financial modelling professionals with experience working in big 4 business modelling teams and strong experience supporting businesses with their financial planning and decision support needs. Our aim is to provide robust and easy-to-use tools that follow good practice financial modelling guidelines and assist individuals and businesses with their financial projection and analysis requirements.
We are keen to ensure our customers are satisfied with the models they purchase and will be more than happy to assist with any questions or support required.
We are also keen to receive feedback so please do let us know what you think of our models by sending us a message or submitting a review.
PURPOSE OF MODEL
Highly versatile and user-friendly Excel model for the preparation a of 5-year or 8-year rolling 3 statement (Income Statement, Balance Sheet and Cash flow Statement) financial projection with a monthly timeline for a startup or existing investment company holding investments in up to 8 portfolio companies and generating investment return included dividend income realised and unrealised fair value gains and losses and transaction fees.
The model also allows the user to model investments in other financial instruments (money market, bonds, equities, alternatives etc), other ancillary income, staff costs, operating expenses, fixed assets and borrowings making it a versatile and comprehensive model for any holding company business looking to project investment return, cash flows and key ratios including IRR by portfolio company.
The model follows good practice financial modelling principles and includes instructions, line-item explanations, checks and input validations and incorporates a discounted cash flow valuation calculation using the projected cash flows.
KEY OUTPUTS
The key outputs include:
- Projected full financial statements (Income Statement, Balance Sheet and Cash flow Statement) presented on a monthly basis across up to 5 or 8 years and summarised on an annual basis.
- Dashboard with:
o Summarised projected Income Statement and Balance Sheet;
o Compounded Annual Growth rate (CAGR) for each summarised income statement and Balance Sheet line item;
o List of key ratios including average investment return, average profit margins, average return on assets and equity and average debt to equity ratio;
o Bar charts summarising income statement and Balance Sheet projections;
o Table presenting investment return by investment holding and IRR (if applicable)
o Charts presenting split of investment holding by portfolio company, cash and financial investment balance by month, cumulative investment return by month
- Discounted cash flow valuation using the projected cash flow output.
KEY INPUTS
Inputs are split into Income Statement and Balance Sheet Inputs. Most inputs include input validations to help users understand what the input is for and populate correctly.
Setup Inputs:
- Name of business;
- Currency;
- First projection year and month;
- Naming for portfolio companies, other income, staff costs, other expenses, financial investments, fixed assets and borrowings.
- Sales tax applicability for revenue and cost categories;
Actuals Inputs:
- Opening balance sheet (for existing businesses);
- Income Statement actuals (for trend analysis);
Projection Inputs:
- Portfolio Company Investment Return
o Portfolio company valuation;
o Investment additions;
o Investment exit date;
o Transaction cost %;
o Dividends received.
- Financial Investment Assumptions
o Investment Return per Annum;
o Target Cash Balances;
o Investment Allocation percentages;
- Other Income
o Volume and Rate / revenue per unit;
- Other cost inputs including
o Staff costs;
o Other operating costs;
- Sales and corporate tax inputs including rate and payment periods;
- Dividend inputs including amount or percentage of retained earnings and frequency;
- Fixed Assets including addition amounts and useful life;
- Borrowings including addition/redemption amounts and interest rate;
- Share Capital additions.
MODEL STRUCTURE
The model comprises of 9 tabs split into input ('i_'), calculation ('c_'), output ('o_’) and system tabs. The tabs to be populated by the user are the input tabs ('i_Setup', ‘i_Actuals’ and 'i_Assumptions'). The calculation tab uses the user-defined inputs to calculate and produce the projection outputs which are presented in 'o_Fin Stats', ‘o_Dashboard’ and ‘o_DCF’.
System tabs include:
- A 'Front Sheet' containing a disclaimer, instructions and contents;
- A Checks dashboard containing a summary of checks by tab.
KEY FEATURES
Other key features of this model include the following:
- The model follows best practice financial modelling guidelines and includes instructions, line item explanations, checks and input validations;
- The model is not password protected and can be modified as required following download;
- The model contains a dynamic timeline that allows for a mix of actual and forecast period across a 5-year or 8-year period allowing projections to be rolled forward from month to month;
- Timeline is split on a monthly basis and summarised on an annual basis;
- Model includes calculation of both realised and unrealised fair value gains and losses
- The model allows for the following number of underlying categories for each line item (these can be easily expanded if required):
o Portfolio companies – 8 companies
o Financial Investments – 5 categories
o Other income – 5 categories
o Staff costs – 8 categories;
o Other expenses – 15 categories;
o Fixed Assets – 5 categories;
o Borrowings – 3 facilities;
- Apart from projecting revenue and costs the model includes the possibility to model, financial investments, fixed assets, borrowings, dividends, corporate tax and sales tax;
- The model included an integrated discounted cash flow valuation using the projected cash flow outputs;
- Business name, currency, starting projection period are fully customisable;
- Revenue, cost, fixed asset and Borrowing category descriptions are fully customisable;
- The model includes instructions, line item explanations, checks and input validations to help ensure input fields are populated accurately;
- The model includes a checks dashboard which summarises all the checks included in the various tabs making it easier to identify any errors.
MODIFICATIONS
If you require any be-spoke modifications to the tool, we are more than happy to assist with this. Please send us a private message
ABOUT PROJECTIFY
We are financial modelling professionals with experience working in big 4 business modelling teams and strong experience supporting businesses with their financial planning and decision support needs. Our aim is to provide robust and easy-to-use tools that follow good practice financial modelling guidelines and assist individuals and businesses with their financial projection and analysis requirements.
We are keen to ensure our customers are satisfied with the models they purchase and will be more than happy to assist with any questions or support required.
We are also keen to receive feedback so please do let us know what you think of our models by sending us a message or submitting a review.
This Best Practice includes
2 Populated Excel Models (5 and 8 year) and 2 Unpopulated Excel Model (5 and 8 year)
Further information
Preparation of a 5 or 8 year financial projection on a monthly basis for a new or existing investment holding companies holding shares in up to 8 portfolio companies generating dividend income and un/realised gains and losses
Startup or existing investment holding company
