
Originally published: 28/10/2024 21:36
Publication number: ELQ-47215-1
View all versions & Certificate
Publication number: ELQ-47215-1
View all versions & Certificate

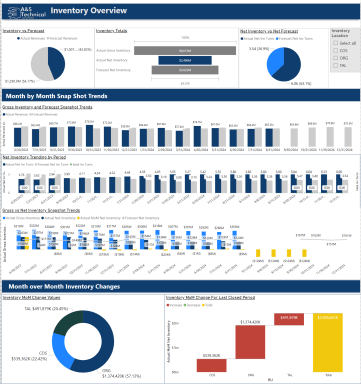
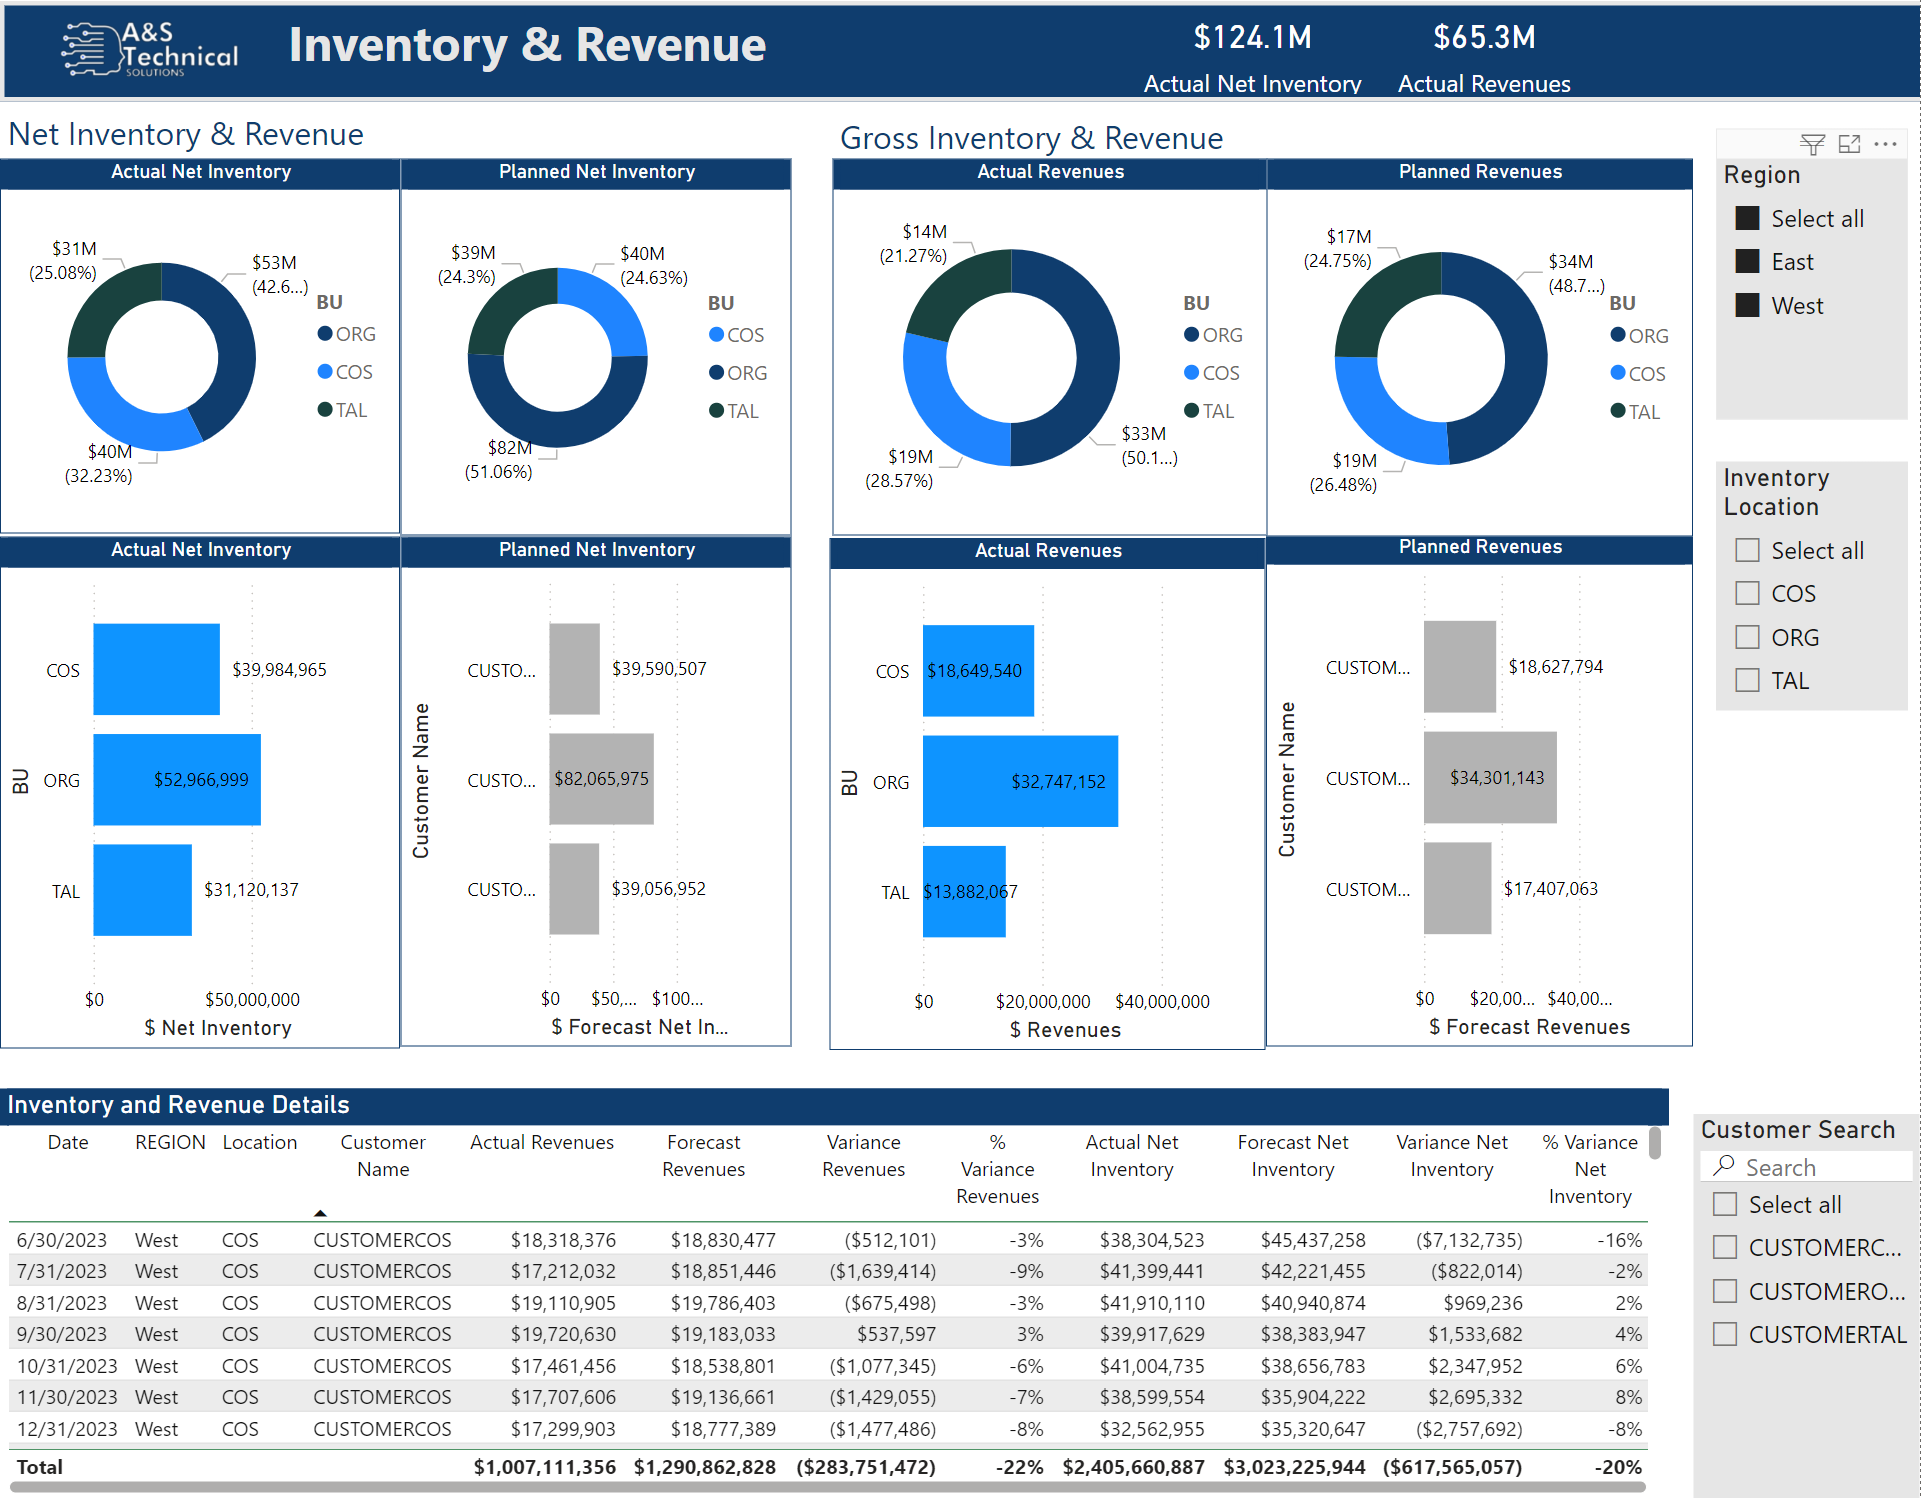
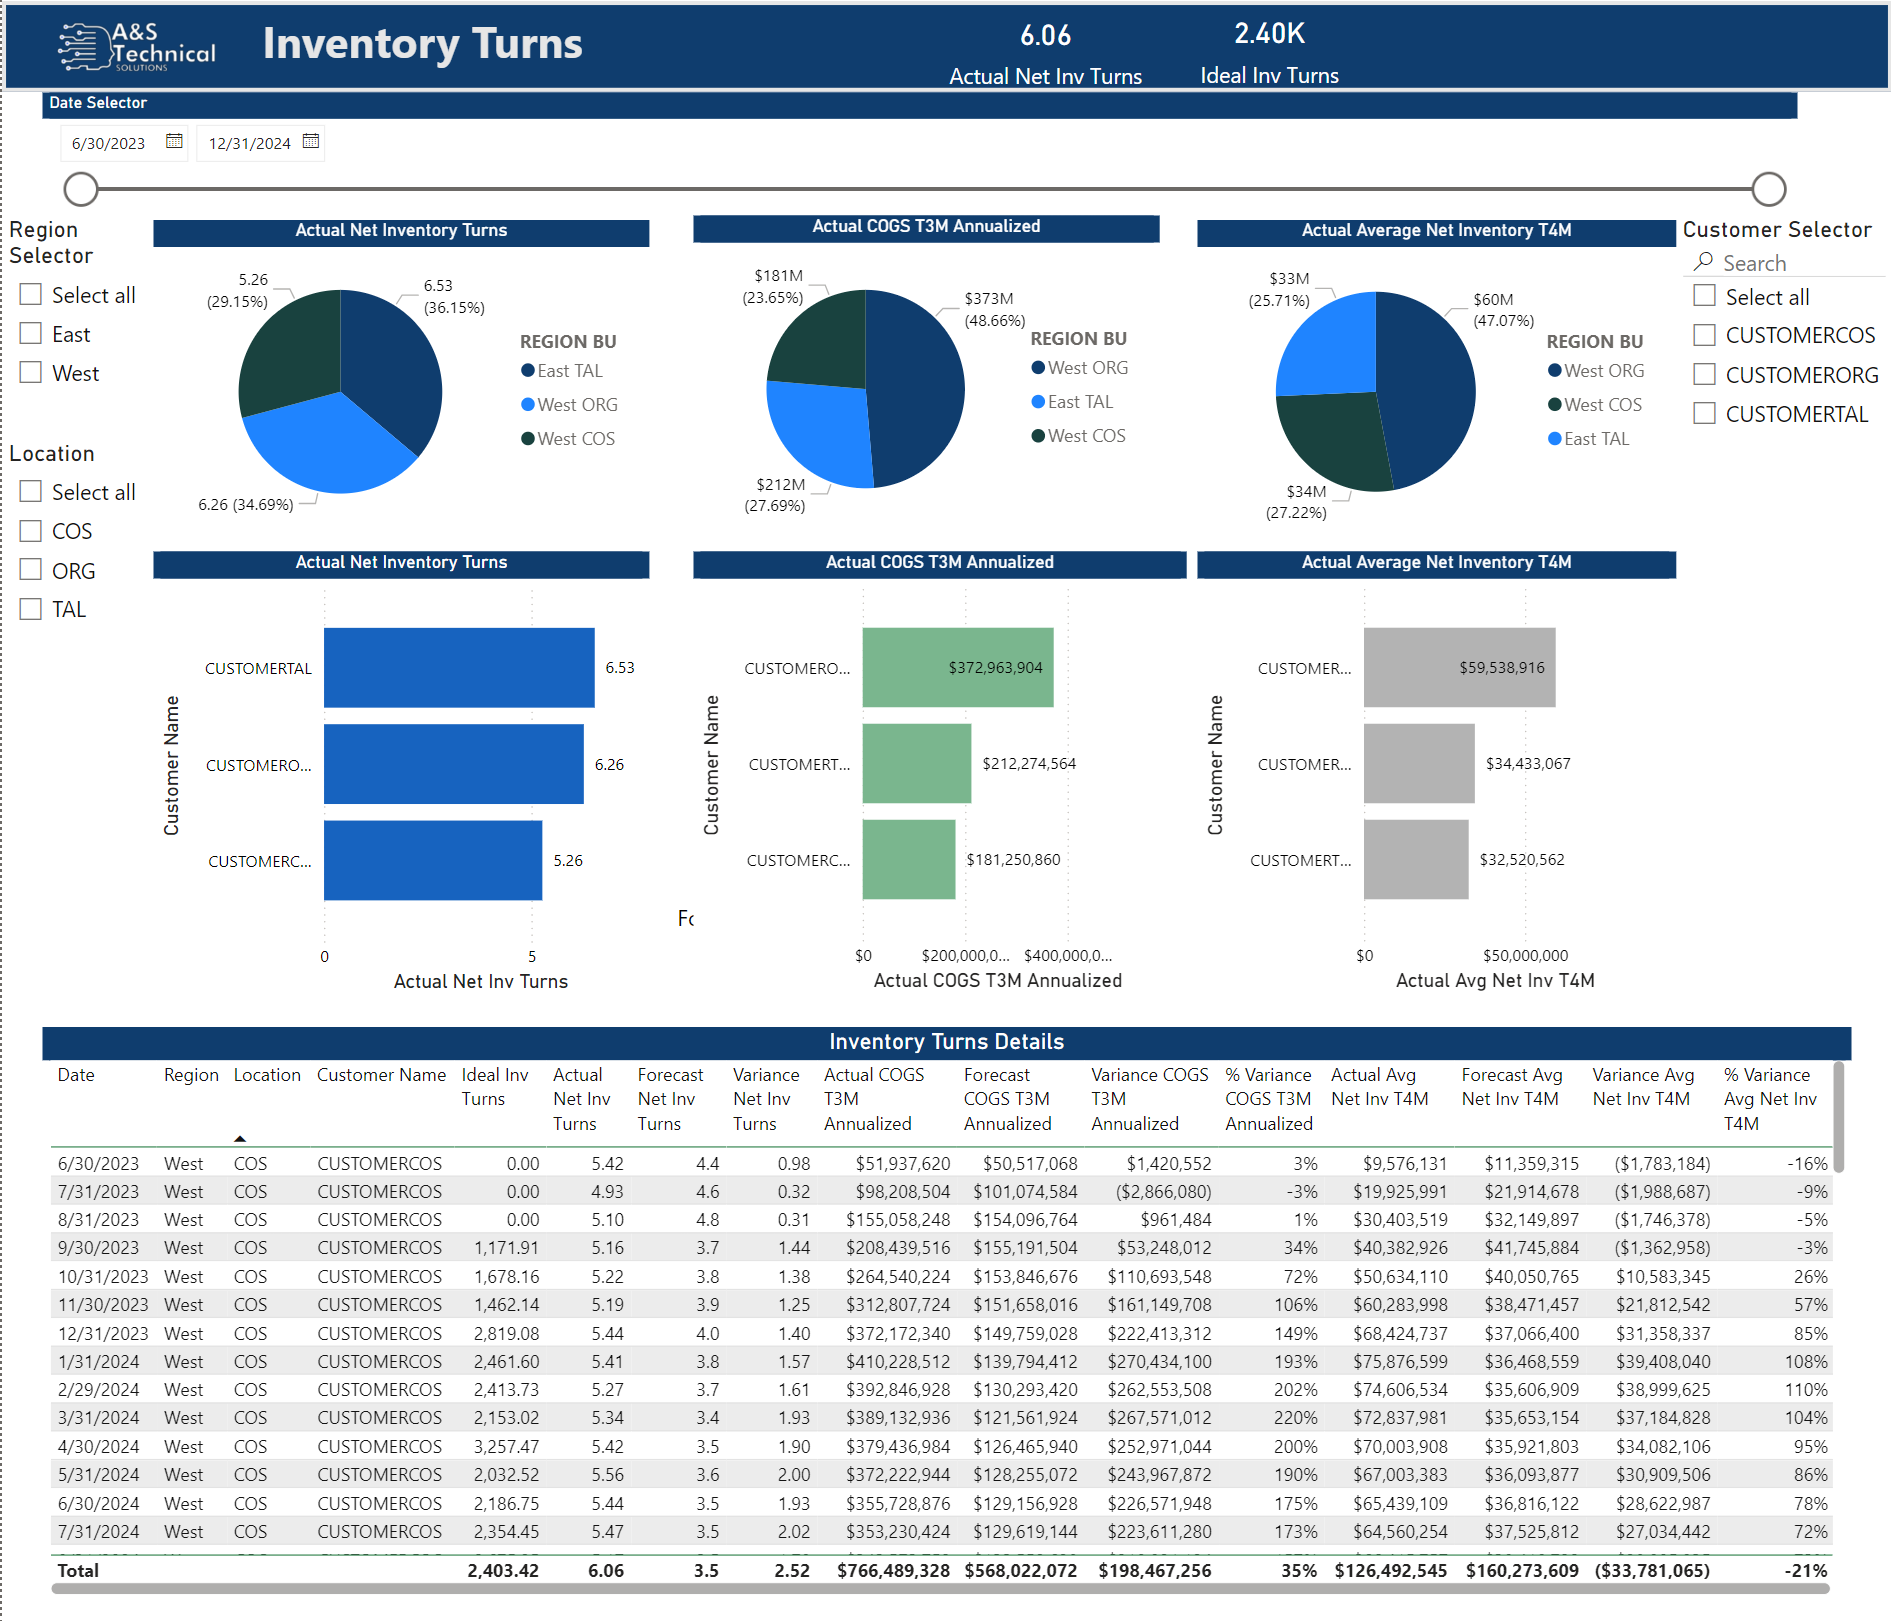
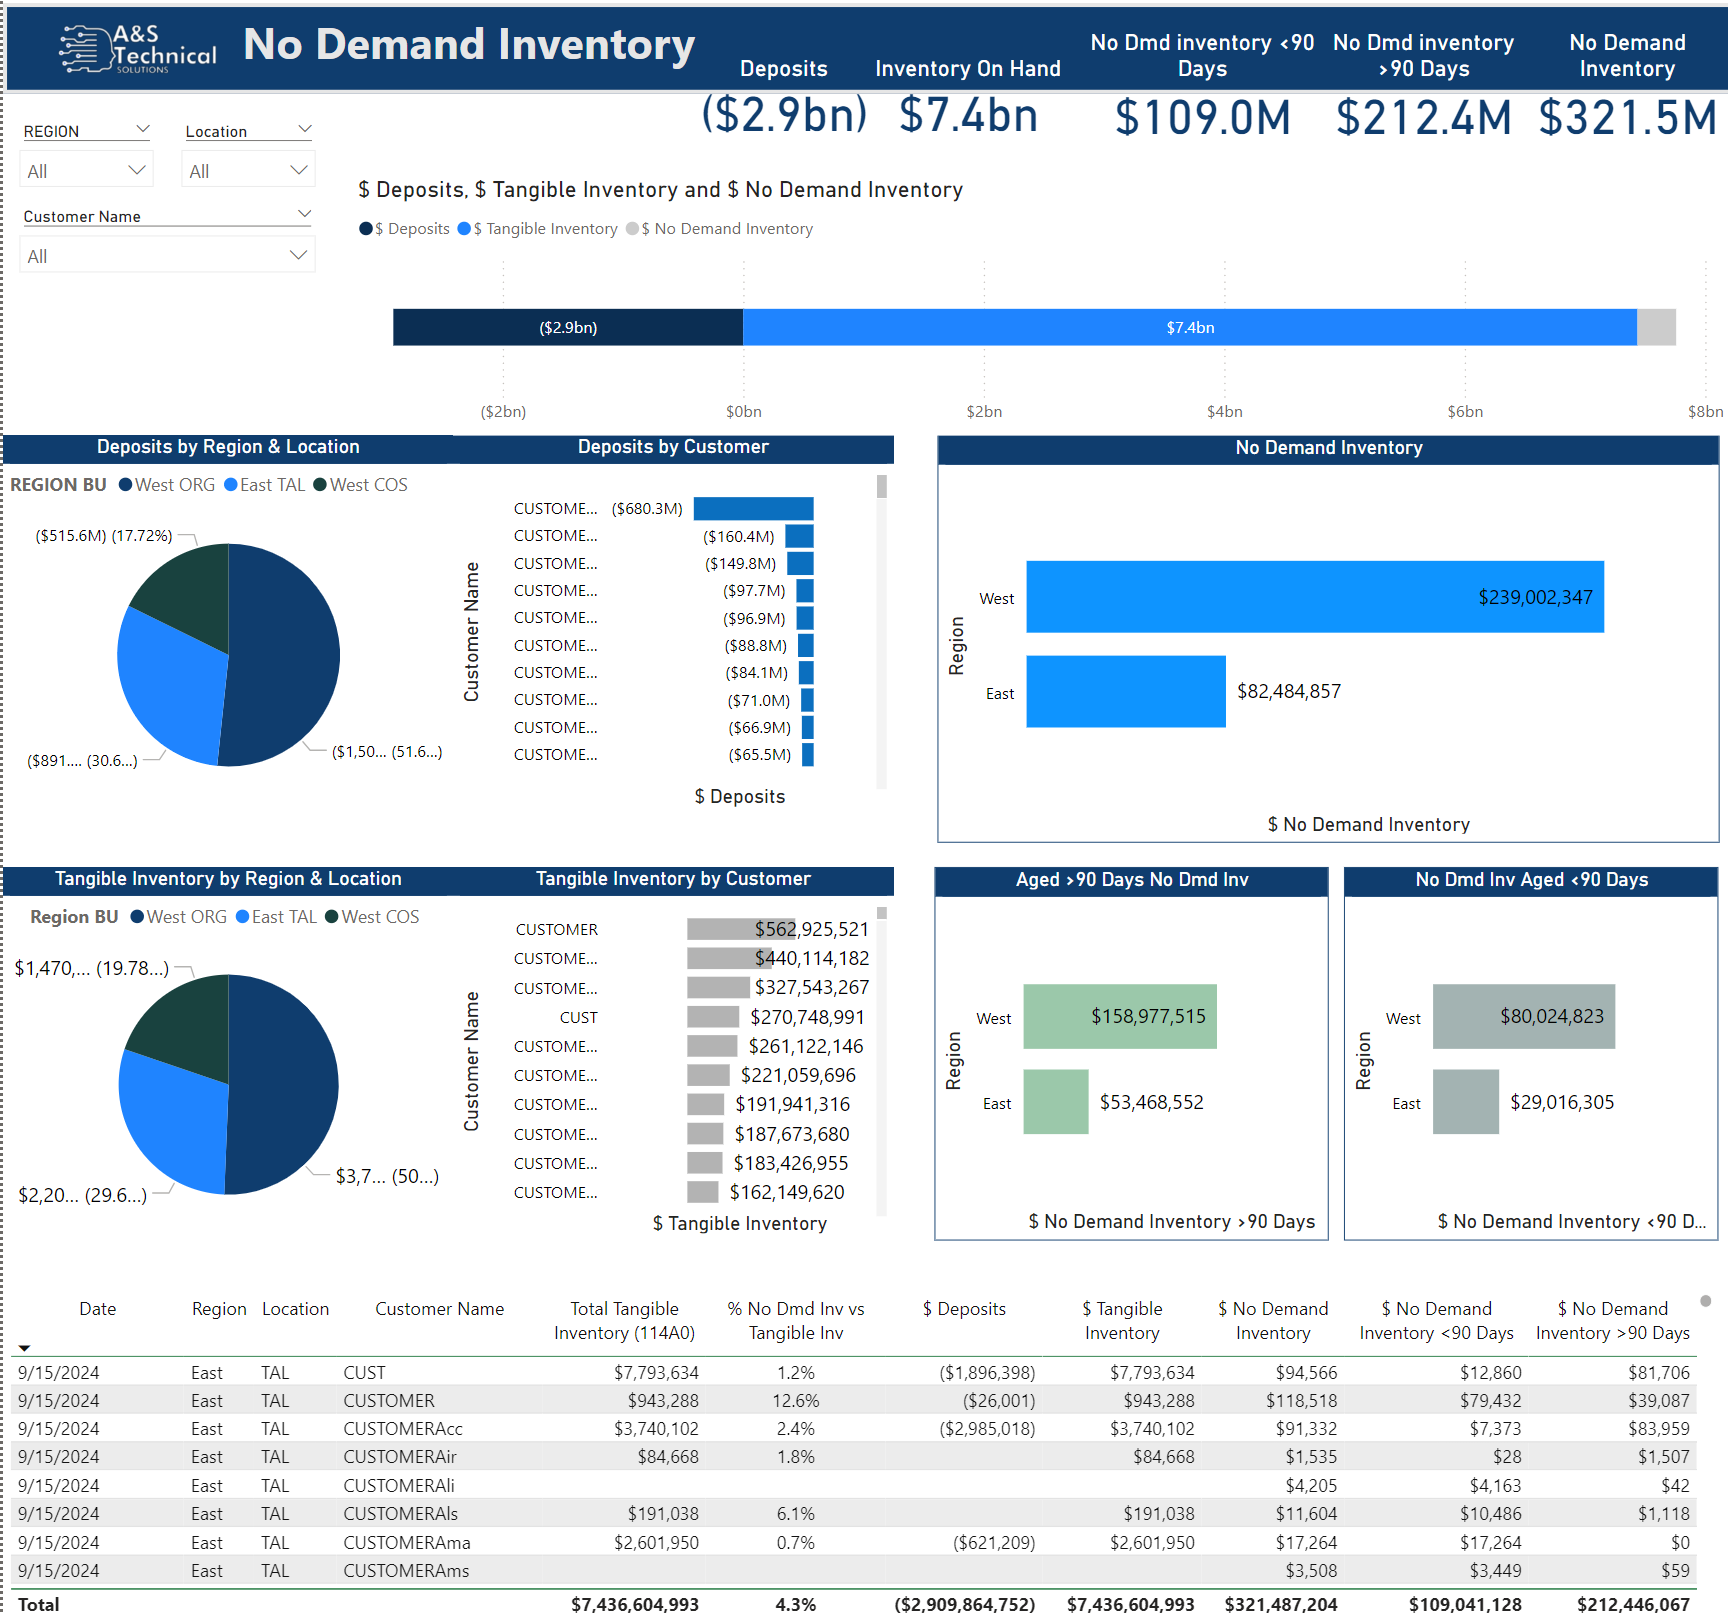
Inventory Insights Dashboard Power BI
The Inventory Insights Dashboard Template is a report built in Power BI that can be used to gain quick insights into inventory and inventory KPIs.
inventoryinventory dashboardinventory stockinventory analysisinventory power bipower bi stockinventory reportstocking reportinventory pbiinventory revenue
Description
The Inventory Insights Dashboard Template is a report that can be used to gain quick insights into inventory and inventory KPIs. This report was built to provide a direct correlation of inventory values with finance objectives. The focus of this report is to understand inventory metrics to better support operations and reduce costs. The objective is to bring visibility to current and projected inventory to make better decisions about stock, supply chain, and forecasting. This report provides region, location, and customer slicers to assist with narrowing down the population.
• Inventory Overivw with forecast projections from planned orders and customer demands.
• Month-over-month inventory changes with current status results.
• A breakdown of Gross vs Net Inventory by customer.
• Inventory turns with turnover rates
• No Demand Inventory detail
This table contains the snapshot dates the supporting fact tables align to.
The Inventory Insights Dashboard Template is a report that can be used to gain quick insights into inventory and inventory KPIs. This report was built to provide a direct correlation of inventory values with finance objectives. The focus of this report is to understand inventory metrics to better support operations and reduce costs. The objective is to bring visibility to current and projected inventory to make better decisions about stock, supply chain, and forecasting. This report provides region, location, and customer slicers to assist with narrowing down the population.
Below are the key areas highlighted in the report:
• Inventory Overivw with forecast projections from planned orders and customer demands.
• Month-over-month inventory changes with current status results.
• A breakdown of Gross vs Net Inventory by customer.
• Inventory turns with turnover rates
• No Demand Inventory detail
Data source
The Inventory Insights Dashboard Template contains pre-made csv document datasets based on data extracts from an ERP, MES, and finance system into data models of facts and dimensions. These data sets were recreated and simplified to provide the maximum use of inventory data with very few criteria.
This table contains the snapshot dates the supporting fact tables align to.
Regions
This table is where users can add their locations and regions. Make sure your locations match/align with the supporting fact tables.No Demand Inventory
This table contains data related to inventory with no demand, in a snapshot format.ME_Control
This table is a reference that aligns the actual/ current inventory as a control.Inventory Turns Target
This table contains the details related to the inventory turns target by day.Inventory Status
This table contains details related to the current and projected inventory. This table contains raw material as well as finished goods. It provides location, customer, and status of the inventory.This Best Practice includes
1 pbix, 1 instruction guide