Publication number: ELQ-71199-1
View all versions & Certificate

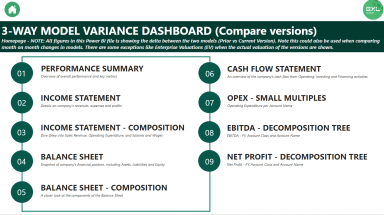
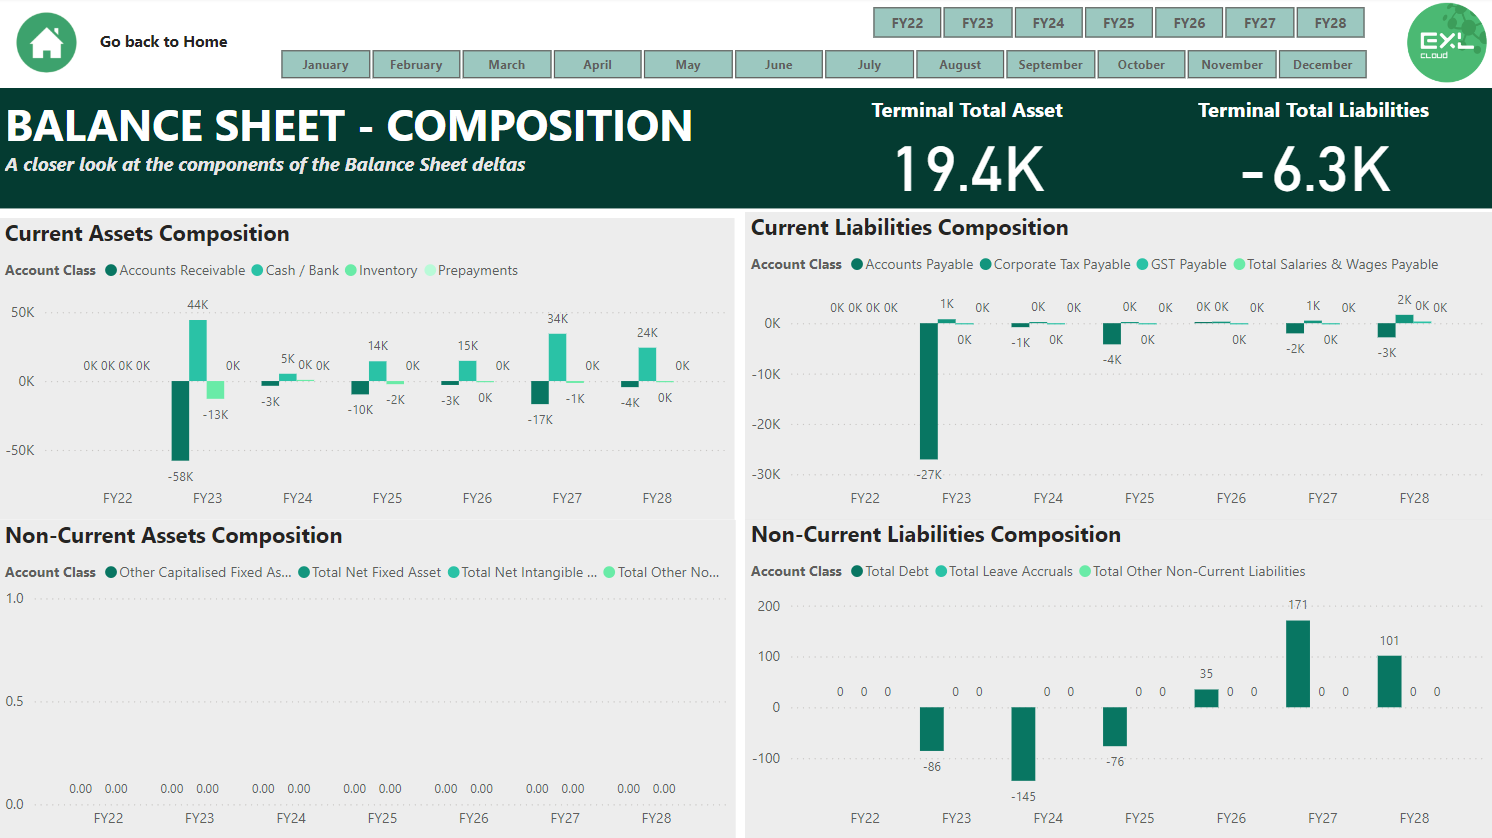
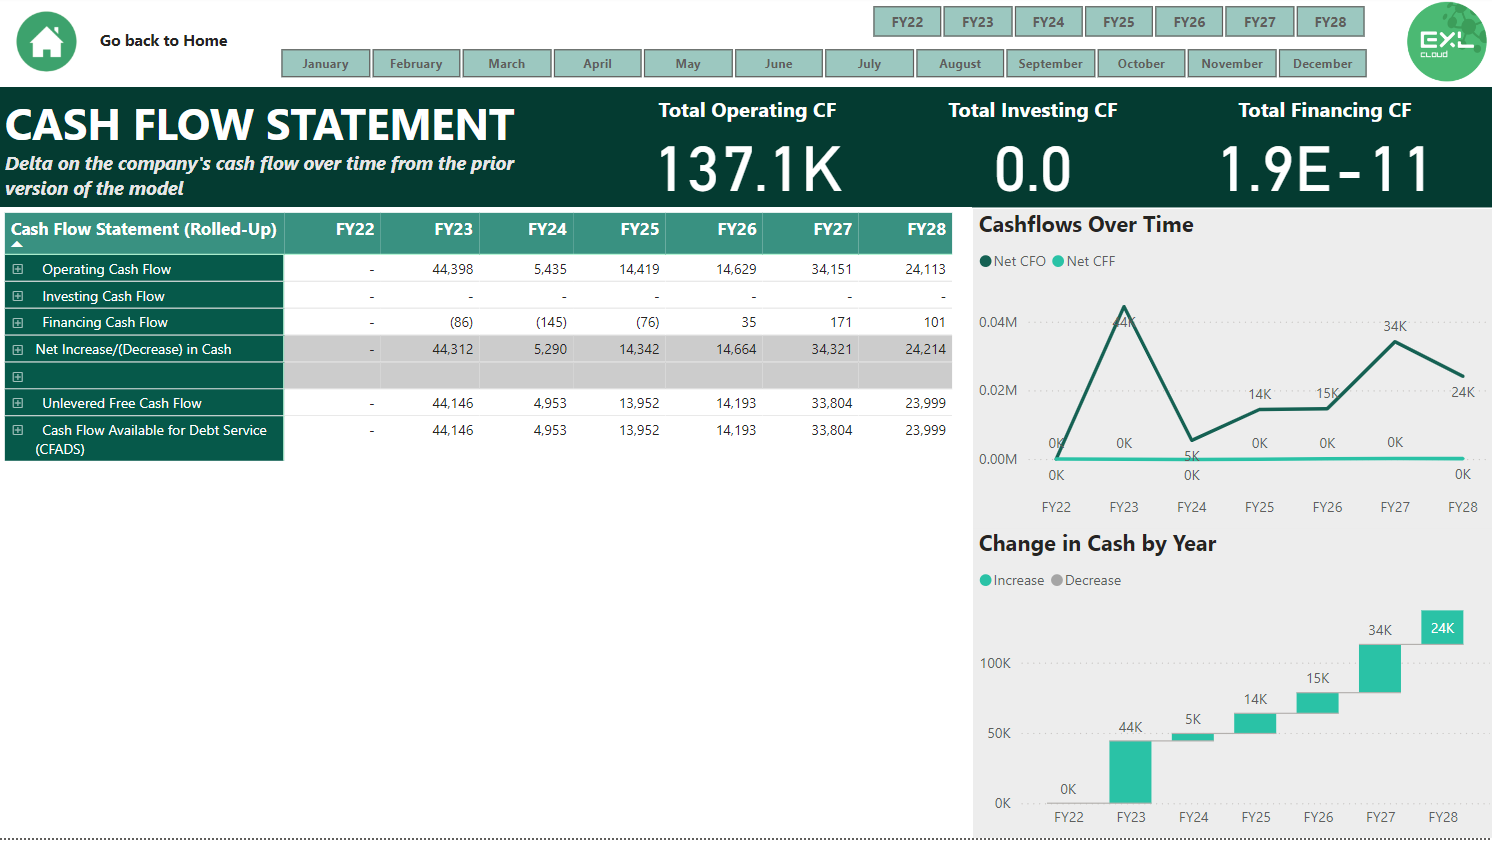
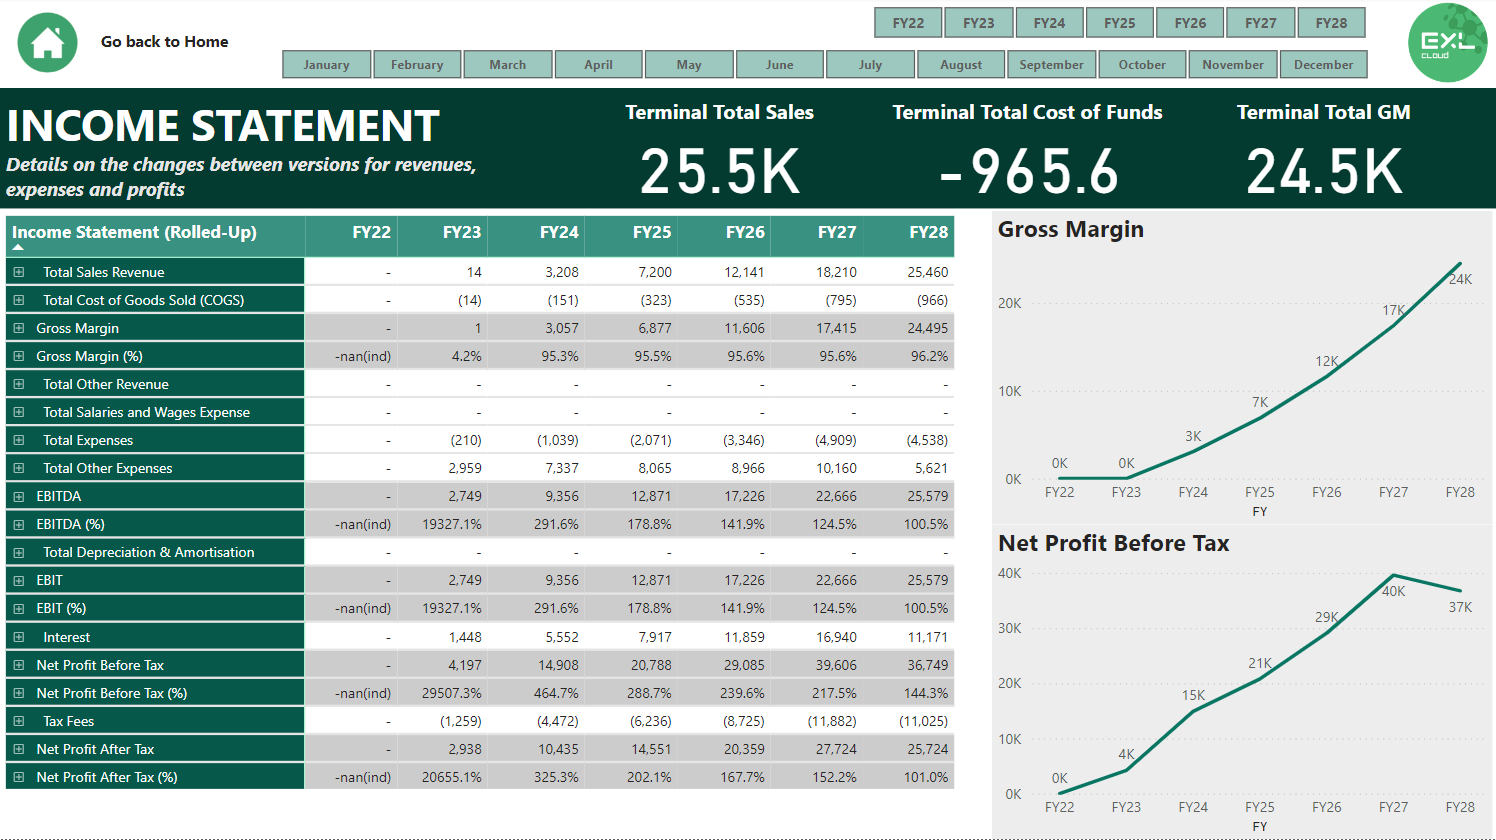
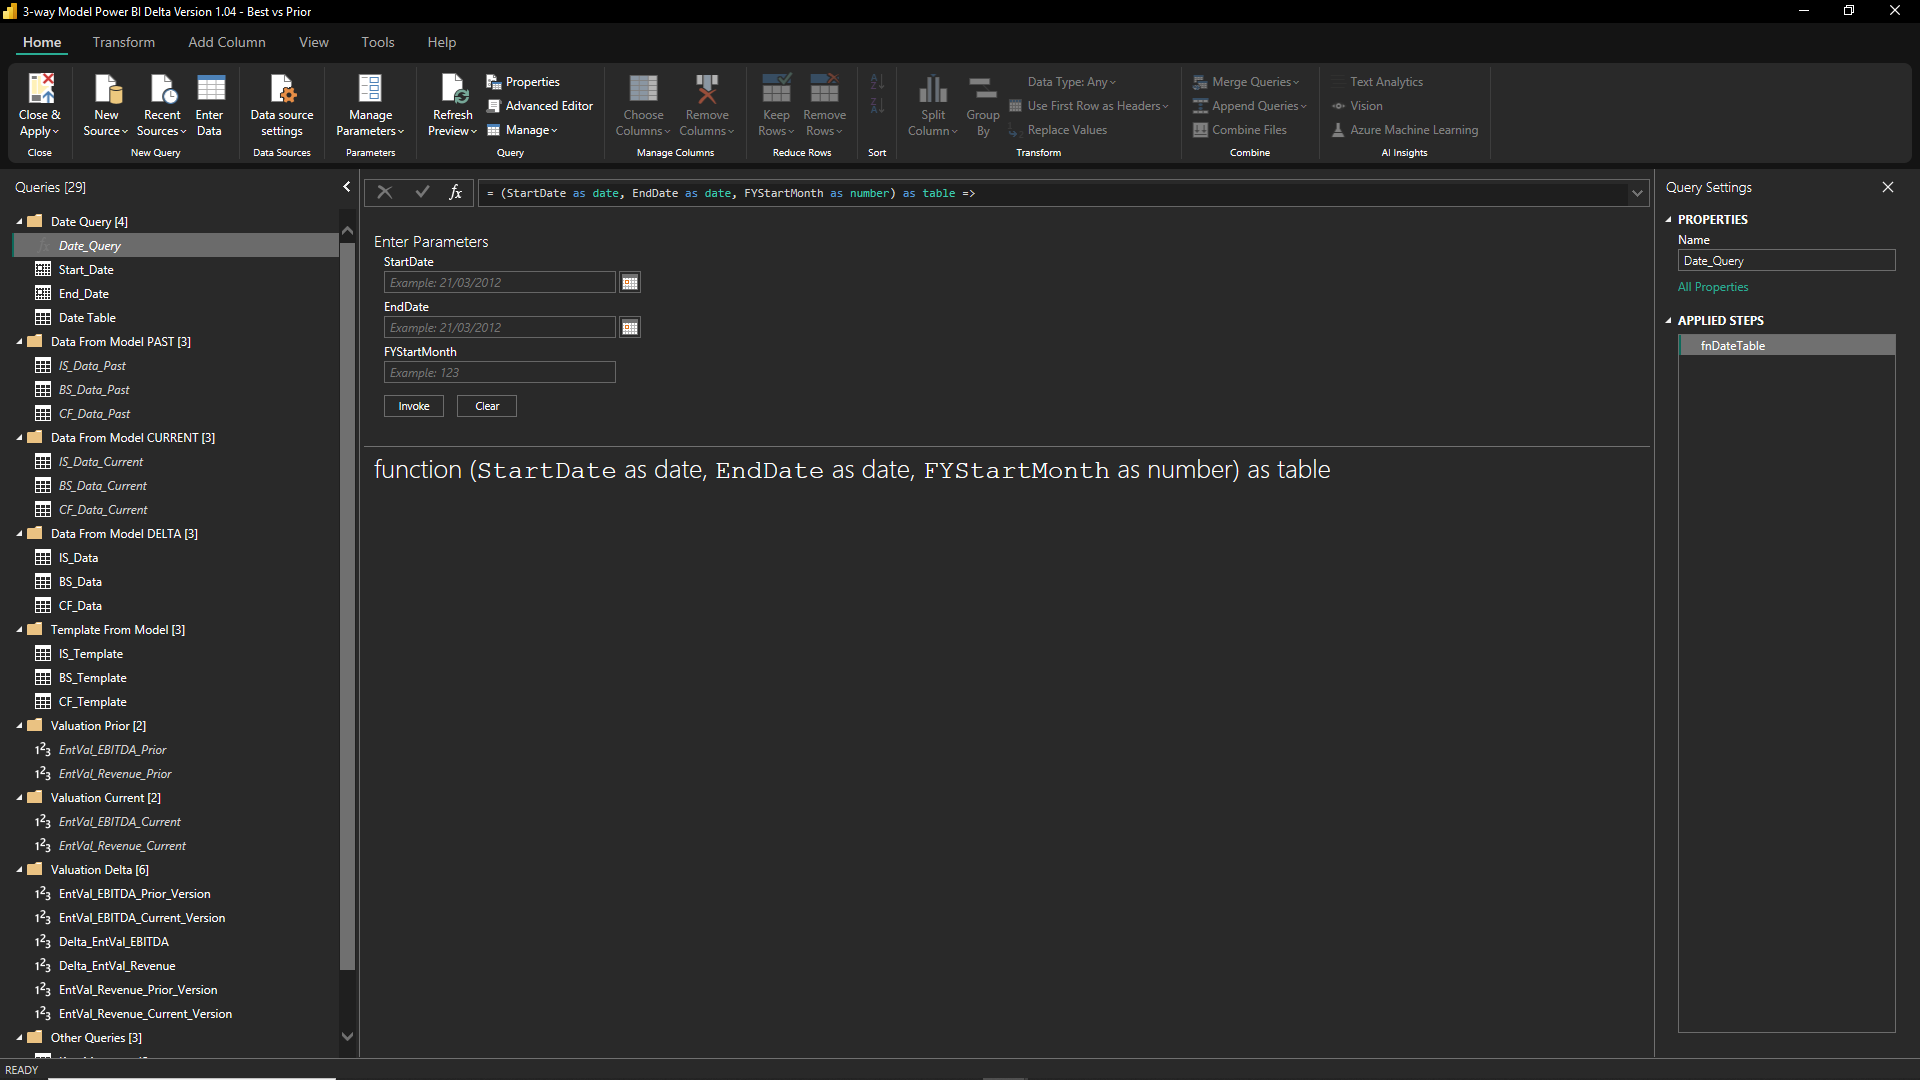
Comparing Rolling 3-Way Monthly Financial Models with Power BI
Discover an innovative approach to financial modeling by comparing 3-way monthly financial model to the latest version. Get pin point accuracy of all deltas.
CEO & Founder of Model Citizn, Chief Excel Officer of EXL Cloud, Chief Data Modeller of Potenza and professional financial modeler and trainer for FMIFollow 300
Further information
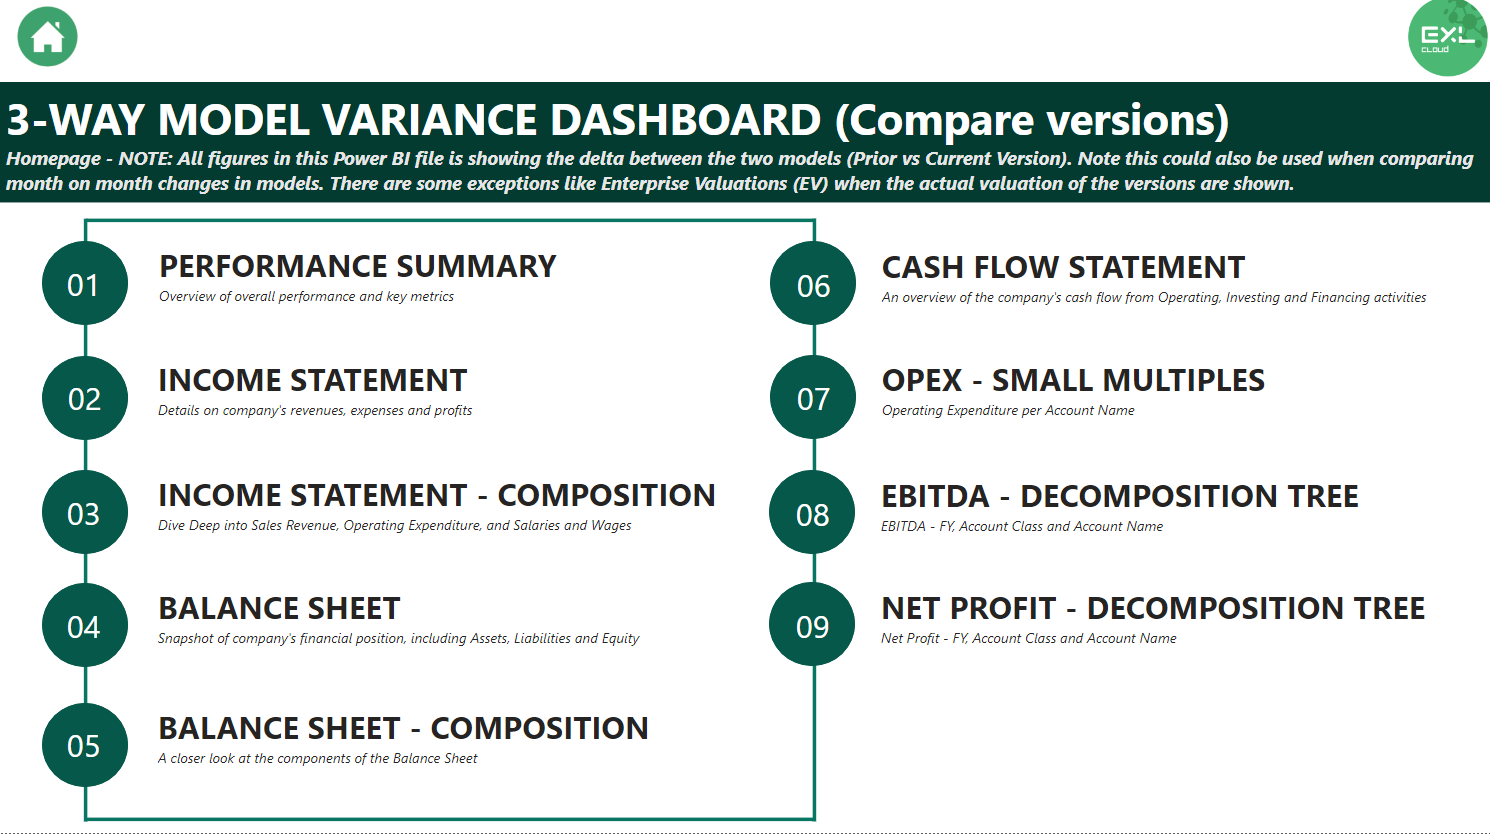
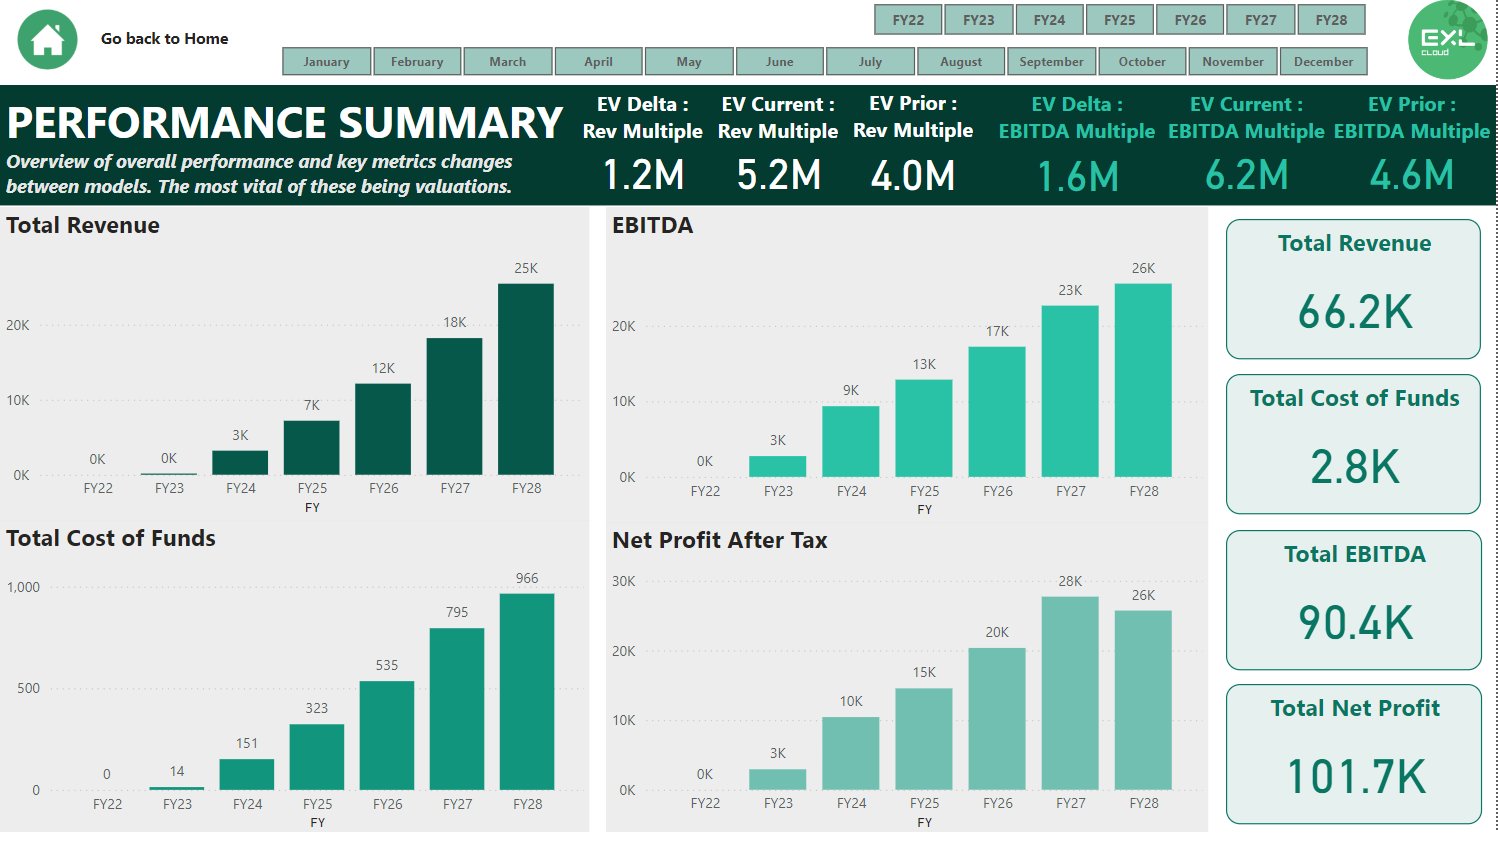
Provide a clear and structured methodology for comparing rolling 3-way monthly financial models.
Enhance the accuracy and efficiency of financial model comparisons.
Enable users to identify key variances and trends quickly, improving financial decision-making.
Organizations that use rolling 3-way monthly financial models for financial planning and analysis.
Financial analysts and accountants are looking to improve their model comparisons' accuracy and efficiency.
Teams that utilize Power BI for data analysis and visualization.
Companies that do not use rolling 3-way monthly financial models.
Users who do not have access to Power BI or are unfamiliar with its functionalities.
Situations where financial data is not available in a clean and structured format suitable for analysis.
