
Originally published: 12/05/2022 08:59
Publication number: ELQ-20582-1
View all versions & Certificate
Publication number: ELQ-20582-1
View all versions & Certificate

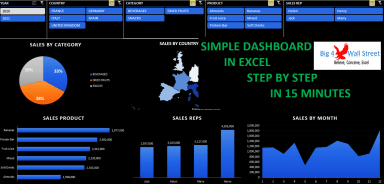
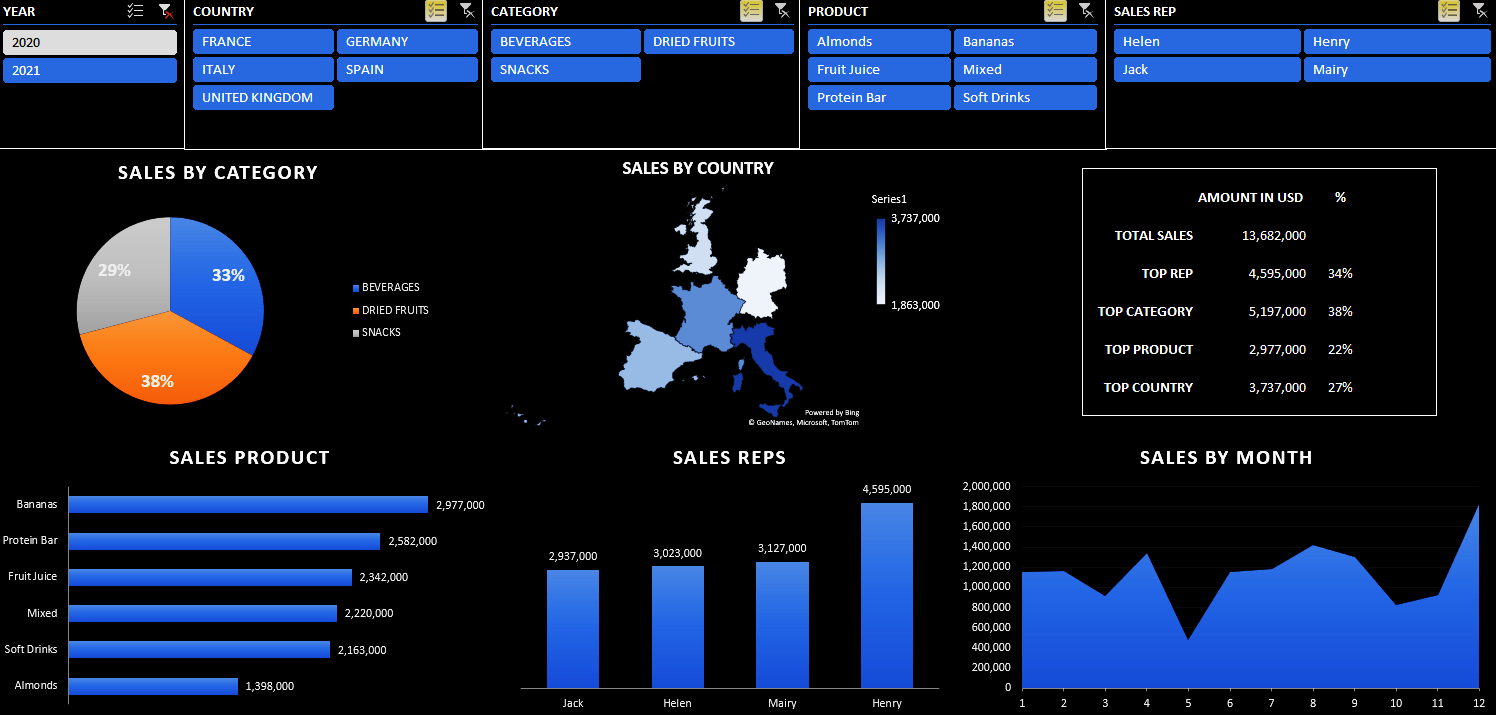
Simple Dashboard in Excel
We will present a quick way to make a simple dashboard in excel. You can download the excel file.
