

Originally published: 01/09/2022 08:01
Publication number: ELQ-13729-1
View all versions & Certificate
Publication number: ELQ-13729-1
View all versions & Certificate

Ride-Hailing Excel Financial Model
This Financial Model is specially designed for the Ride-hailing Startups or SMES who are seeking financial projections for their Ride-hailing business.
Our mission is to be the industrial leader and pioneer in our business domainFollow 17
ride hailingride hailing appfinancial modelfinancial modelingfinancial consultantfinancial analysisexcel model
Description
Ride-Hailing Business is becoming more important with the change in buying behavior towards online shopping and online businesses. It provides the customers with a fast, secure, and less costly mode of payment. The majority of the revenue comes from the commission earned from the transactions processed. However, to maintain profitability it is essential to monitor revenue and costs and plan the business accordingly. Our Ride-Hailing Excel Financial Model Template will give you a head start in the financial planning and forecasting process.
Introduction to our Ride-Hailing Excel Financial Model Template
Our Ride-Hailing Excel Financial Model Template is built on the revenue model similar to Stripe, which is the leading Ride-Hailing Platform. The model contains the 3 Financial statements: Income Statement, Cashflow, and Balance Sheet. Additionally, we also provide Breakeven Analysis, CAC/CLV Analysis, Scenario Analysis, and Company Valuation. The model also contains a Dashboard that provides a complete picture in one frame.
How to Use: Ride-Hailing Excel Financial Model
The ‘Table of Contents’ Tab gives you the full list of Tabs in the model. You can navigate to any of the tabs through this tab by clicking on the respective Tab Name. Moreover, the model follows a consistent color theme to assist the user. The input cells are displayed in peach cells, the call-ups (direct links from other cells) are colored in the grey background, while calculated cells have a white background. This color system helps the user identify where to enter inputs and where to avoid making changes.
Input Tab
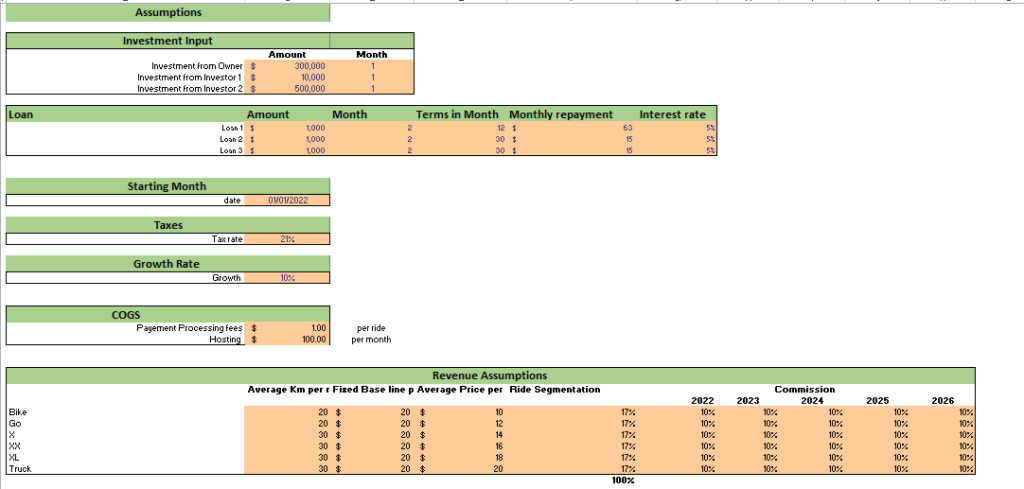
The Input Sheet is the main sheet where the user has to enter any information. Once the basic business information is entered, the rest of the financial information, including the financial statements, is automatically computed. The input sheet contains the following sections:
1. Funding Assumptions: contains tables for capital investments and loans taken
2. Sales Assumptions: contains revenue and cost tables where you can add the price and cost of the products/services you sell.
3. Operational Expenses: contains tables for department costs and payroll and benefits details.
4. Capital Expenditure: contains a table for tangible and intangible assets
Income Statement
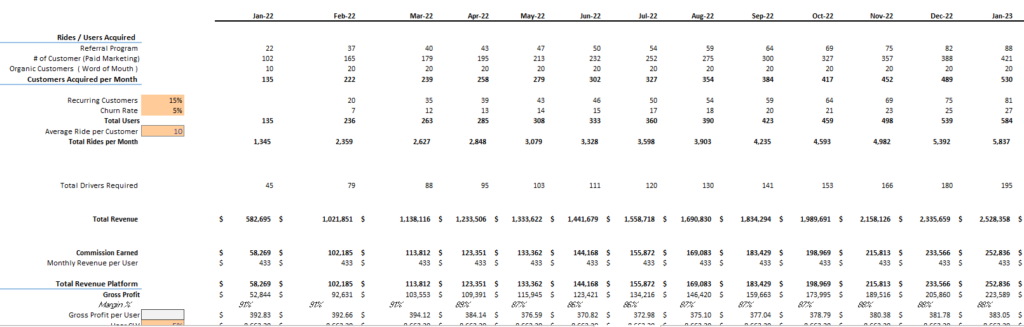
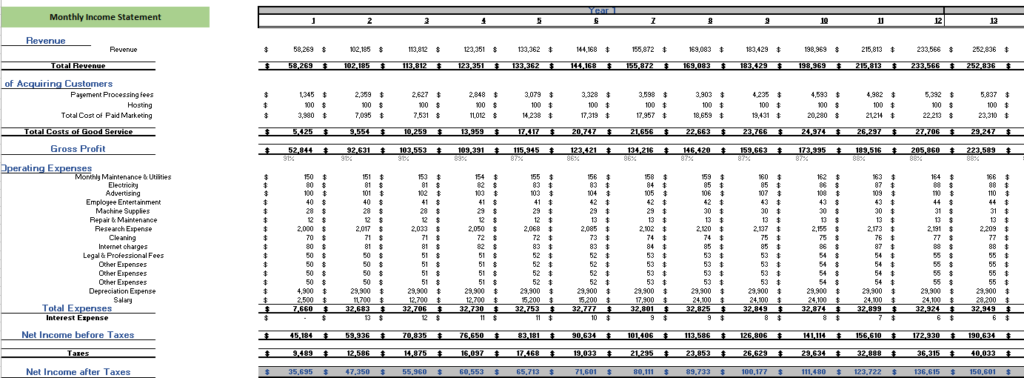
The Income Statement or the Profit/Loss Statement contains some of the core financial information required by a company. The ‘Revenue Analysis’ provides the data presented in this statement. First, the Revenue sheet calculates the revenue and costs details based on the data entered by the user in the input sheet. Simultaneously, the ‘Supporting Table’ calculates the operational expenses, depreciation/amortization, and interest details. Once, all these numbers are calculated, we compute the Operating and Net Profit.
An integrated financial model is powerful since it enables the Financial Model user to change any assumption in one part of the statement to see how it impacts all other parts of the statements accurately and consistently.
The monthly Income Statement sheet of the Ride Hailing Excel Financial Model Template is perfect for those who require regular reporting and details. Additionally, Income Statement contains all revenue streamlines with gross earnings, net earnings linked with a revenue analysis sheet to ensure accurate reporting. Oak Business Consultants understands every business’s goal. Therefore, we have developed a mechanism that helps business owners determine whether they are making profits or otherwise.
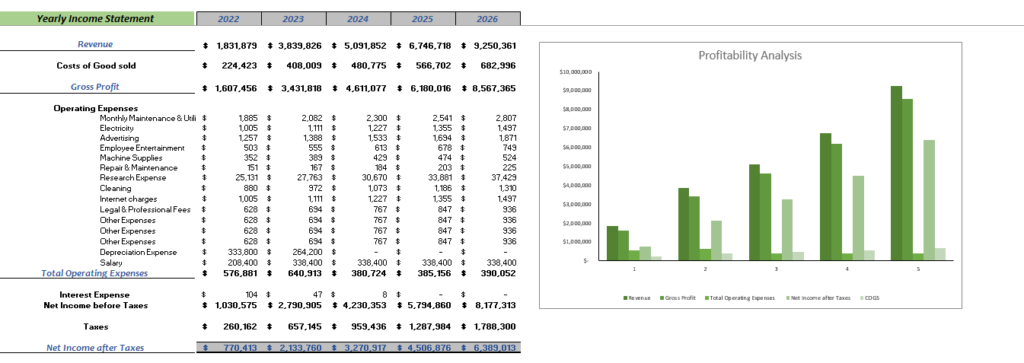
Furthermore, the Yearly Income Statement gives you complete insights into revenue and general & administrative expenses. The Yearly Income Statement also contains several graphs, assumptions, ratios, margins, net profit, earnings, cost of services, and profit after tax.
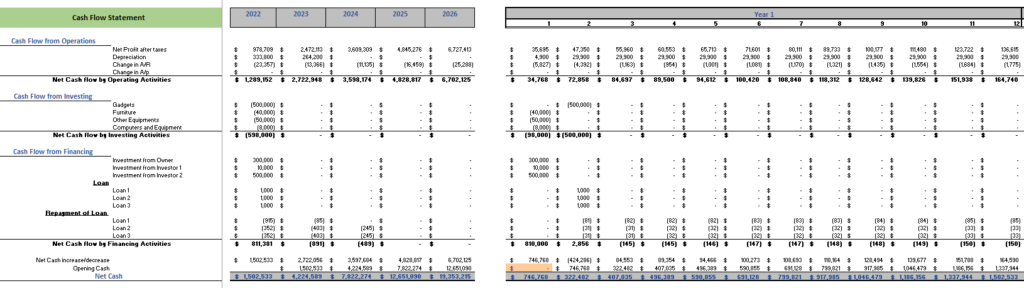
Cashflow Statement
The Cashflow Statement plays a critical part in financial planning and forecasting, as it shows how much money goes in and out of the business. You can analyze the following 3 critical activities of your business through our template: –
Operating Activities: cashflows related to basic company operations
Investing Activities: cashflows related to any investment going in or out of the business
Financing Activities: cashflow related to the financing utilized by the company to maintain its operations.
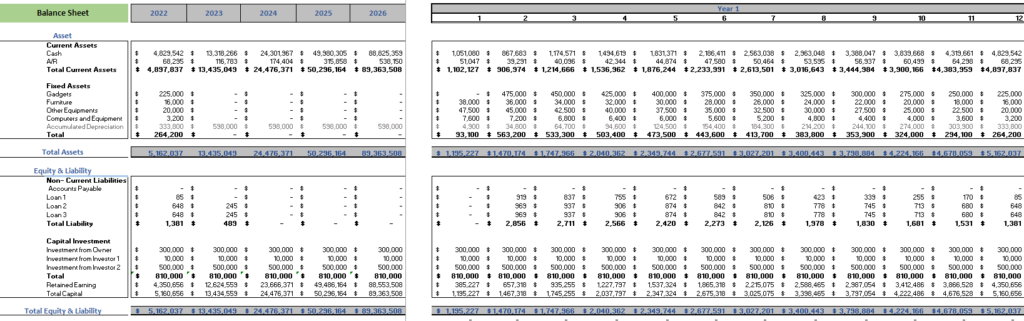
Balance Sheet
Our Ride-Hailing Excel Financial Model Template gives you an organized and simple look to analyze your key financial account balances. The Balance Sheet allows you to easily analyze your company account balances over time. You can monitor details on your current and fixed assets, current liabilities and Long-term Debts, and Equity Capital.
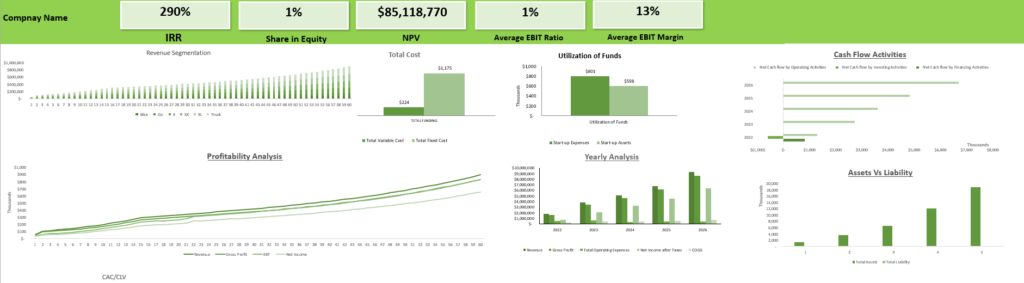
Dashboard
Dashboards play an important role in visually presenting all the important financial metrics and financial trends in one look. Hence, the Dashboard in Our Ride-Hailing Financial Model is designed in a way so that you can analyze the financial performance of your company, year by year, without looking into numbers. It makes the complete process easier and faster.
Company Valuation
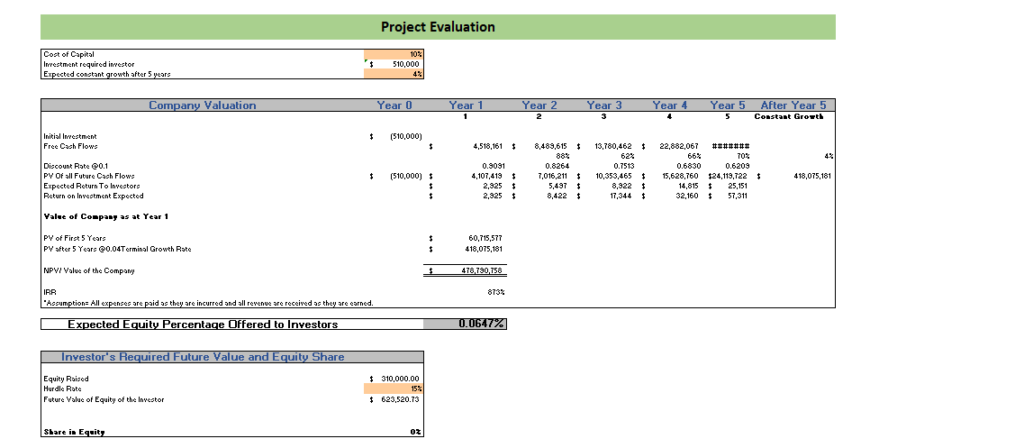
It is important to know how much return your company is generating based on the investments you have made. These returns determine the net present value of your company and are a critical factor which investors look into. Therefore, our ‘Company Valuation’ sheet provides you with all the determinants required to determine your company’s worth and effectiveness of your operations.
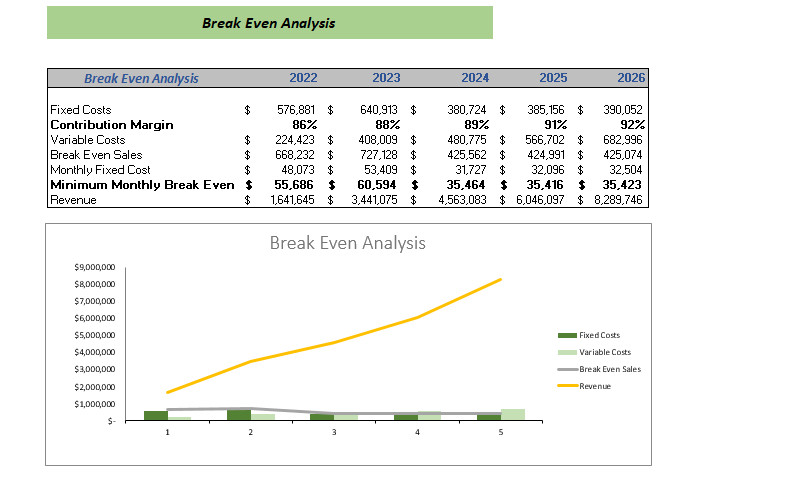
Break-Even Analysis
CLV/CAV
CLV is the customer lifetime value, and CAV is the customer acquisition cost. CLV is an essential driver for any SaaS company because it shows the amount of revenue a customer can generate over the course of the business relationship. Furthermore, CAV and CLV are closely monitored, and their ratio indicates the amount of revenue generated by a single customer against the cost of acquiring that customer. In CAV, you can add different costs based on your specific business.
These analyses provide critical information. Therefore, through our model you can monitor how well your company can achieve and maintain breakeven. Moreover, CAC/CLV gives you a good picture of how effective your marketing strategy is working to gain and retain customers.
Benefits of Ride-Hailing Excel Financial Model
Our Ride-Hailing Excel Financial Model Template gives you the perfect start you need for your business. It speeds up the business planning and most essentially the financial planning process.
The revenue and costs are determined after a complete market research on the business model. Therefore, the model gives you a good estimate of your future profitability based on your particular business needs.
Additionally, the Ride-Hailing Excel Financial Model Template can be the perfect document to share with your investors. It not only provides the 5 Year financial projections, but also the Company Valuation which is a critical factor to assess Company’s future.
The Model’s Design ensures ease in understanding and usability. Therefore, it requires minimal effort from the user. Any change in the input sheet automatically updates the rest of the model. Moreover, the formatting is simple and consistent throughout the model. Each sheet has clear and distinct headings to ensure ease in understanding.
Ride-Hailing Business is becoming more important with the change in buying behavior towards online shopping and online businesses. It provides the customers with a fast, secure, and less costly mode of payment. The majority of the revenue comes from the commission earned from the transactions processed. However, to maintain profitability it is essential to monitor revenue and costs and plan the business accordingly. Our Ride-Hailing Excel Financial Model Template will give you a head start in the financial planning and forecasting process.
Introduction to our Ride-Hailing Excel Financial Model Template
Our Ride-Hailing Excel Financial Model Template is built on the revenue model similar to Stripe, which is the leading Ride-Hailing Platform. The model contains the 3 Financial statements: Income Statement, Cashflow, and Balance Sheet. Additionally, we also provide Breakeven Analysis, CAC/CLV Analysis, Scenario Analysis, and Company Valuation. The model also contains a Dashboard that provides a complete picture in one frame.
How to Use: Ride-Hailing Excel Financial Model
The ‘Table of Contents’ Tab gives you the full list of Tabs in the model. You can navigate to any of the tabs through this tab by clicking on the respective Tab Name. Moreover, the model follows a consistent color theme to assist the user. The input cells are displayed in peach cells, the call-ups (direct links from other cells) are colored in the grey background, while calculated cells have a white background. This color system helps the user identify where to enter inputs and where to avoid making changes.
Input Tab
The Input Sheet is the main sheet where the user has to enter any information. Once the basic business information is entered, the rest of the financial information, including the financial statements, is automatically computed. The input sheet contains the following sections:
1. Funding Assumptions: contains tables for capital investments and loans taken
2. Sales Assumptions: contains revenue and cost tables where you can add the price and cost of the products/services you sell.
3. Operational Expenses: contains tables for department costs and payroll and benefits details.
4. Capital Expenditure: contains a table for tangible and intangible assets
Income Statement
The Income Statement or the Profit/Loss Statement contains some of the core financial information required by a company. The ‘Revenue Analysis’ provides the data presented in this statement. First, the Revenue sheet calculates the revenue and costs details based on the data entered by the user in the input sheet. Simultaneously, the ‘Supporting Table’ calculates the operational expenses, depreciation/amortization, and interest details. Once, all these numbers are calculated, we compute the Operating and Net Profit.
An integrated financial model is powerful since it enables the Financial Model user to change any assumption in one part of the statement to see how it impacts all other parts of the statements accurately and consistently.
The monthly Income Statement sheet of the Ride Hailing Excel Financial Model Template is perfect for those who require regular reporting and details. Additionally, Income Statement contains all revenue streamlines with gross earnings, net earnings linked with a revenue analysis sheet to ensure accurate reporting. Oak Business Consultants understands every business’s goal. Therefore, we have developed a mechanism that helps business owners determine whether they are making profits or otherwise.
Furthermore, the Yearly Income Statement gives you complete insights into revenue and general & administrative expenses. The Yearly Income Statement also contains several graphs, assumptions, ratios, margins, net profit, earnings, cost of services, and profit after tax.
Cashflow Statement
The Cashflow Statement plays a critical part in financial planning and forecasting, as it shows how much money goes in and out of the business. You can analyze the following 3 critical activities of your business through our template: –
Operating Activities: cashflows related to basic company operations
Investing Activities: cashflows related to any investment going in or out of the business
Financing Activities: cashflow related to the financing utilized by the company to maintain its operations.
Balance Sheet
Our Ride-Hailing Excel Financial Model Template gives you an organized and simple look to analyze your key financial account balances. The Balance Sheet allows you to easily analyze your company account balances over time. You can monitor details on your current and fixed assets, current liabilities and Long-term Debts, and Equity Capital.
Dashboard
Dashboards play an important role in visually presenting all the important financial metrics and financial trends in one look. Hence, the Dashboard in Our Ride-Hailing Financial Model is designed in a way so that you can analyze the financial performance of your company, year by year, without looking into numbers. It makes the complete process easier and faster.
Company Valuation
It is important to know how much return your company is generating based on the investments you have made. These returns determine the net present value of your company and are a critical factor which investors look into. Therefore, our ‘Company Valuation’ sheet provides you with all the determinants required to determine your company’s worth and effectiveness of your operations.
Break-Even Analysis
CLV/CAV
CLV is the customer lifetime value, and CAV is the customer acquisition cost. CLV is an essential driver for any SaaS company because it shows the amount of revenue a customer can generate over the course of the business relationship. Furthermore, CAV and CLV are closely monitored, and their ratio indicates the amount of revenue generated by a single customer against the cost of acquiring that customer. In CAV, you can add different costs based on your specific business.
These analyses provide critical information. Therefore, through our model you can monitor how well your company can achieve and maintain breakeven. Moreover, CAC/CLV gives you a good picture of how effective your marketing strategy is working to gain and retain customers.
Benefits of Ride-Hailing Excel Financial Model
Our Ride-Hailing Excel Financial Model Template gives you the perfect start you need for your business. It speeds up the business planning and most essentially the financial planning process.
The revenue and costs are determined after a complete market research on the business model. Therefore, the model gives you a good estimate of your future profitability based on your particular business needs.
Additionally, the Ride-Hailing Excel Financial Model Template can be the perfect document to share with your investors. It not only provides the 5 Year financial projections, but also the Company Valuation which is a critical factor to assess Company’s future.
The Model’s Design ensures ease in understanding and usability. Therefore, it requires minimal effort from the user. Any change in the input sheet automatically updates the rest of the model. Moreover, the formatting is simple and consistent throughout the model. Each sheet has clear and distinct headings to ensure ease in understanding.
This Best Practice includes
1 Excel File (17 Tabs)
