
Originally published: 21/09/2018 16:12
Last version published: 27/11/2019 13:52
Publication number: ELQ-10807-2
View all versions & Certificate
Last version published: 27/11/2019 13:52
Publication number: ELQ-10807-2
View all versions & Certificate

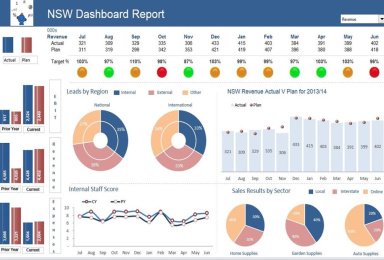
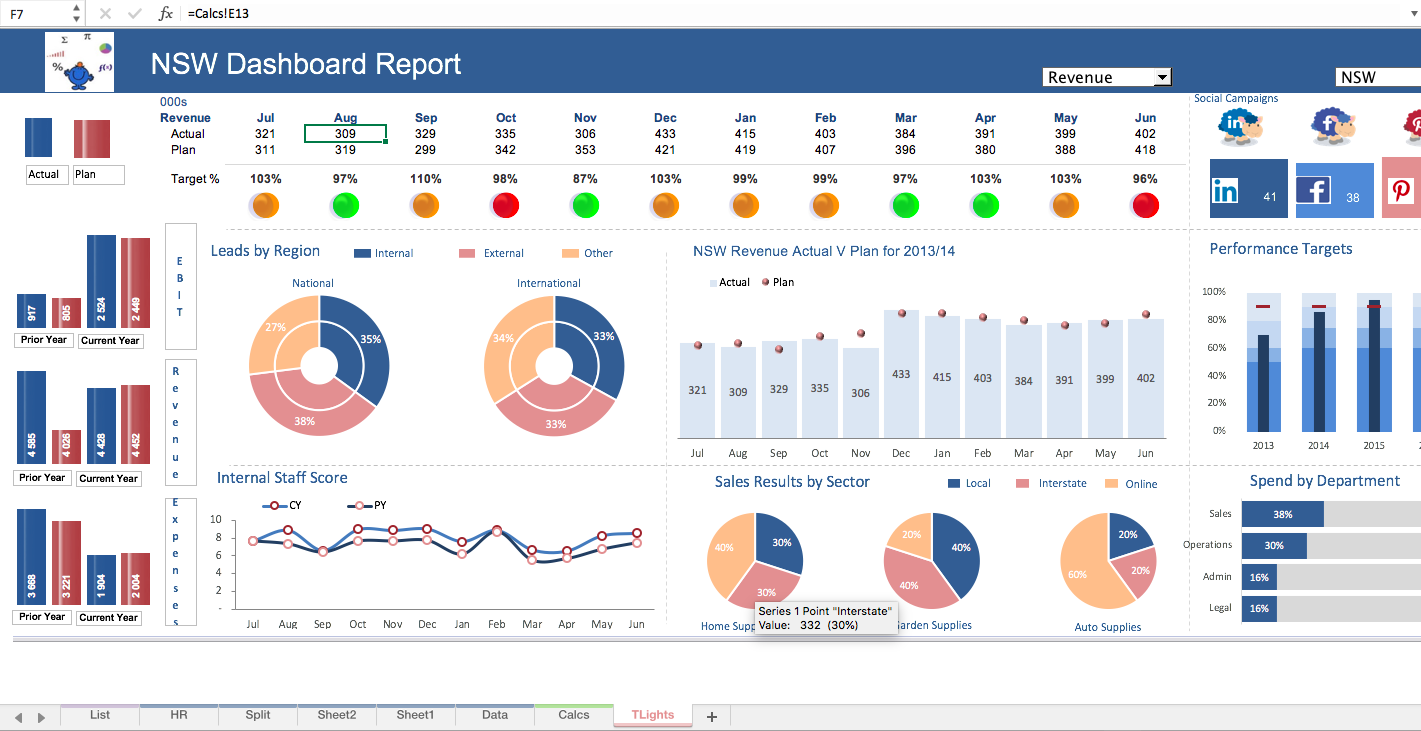
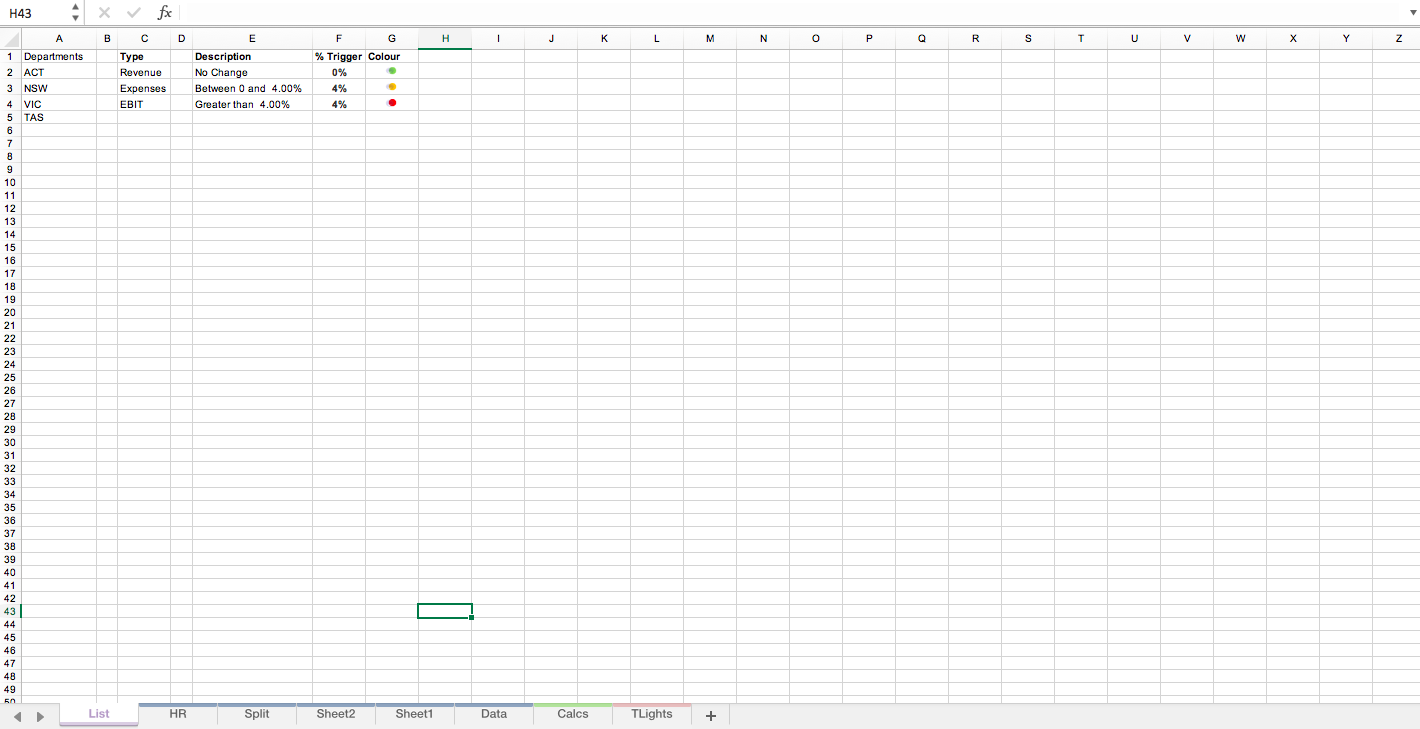
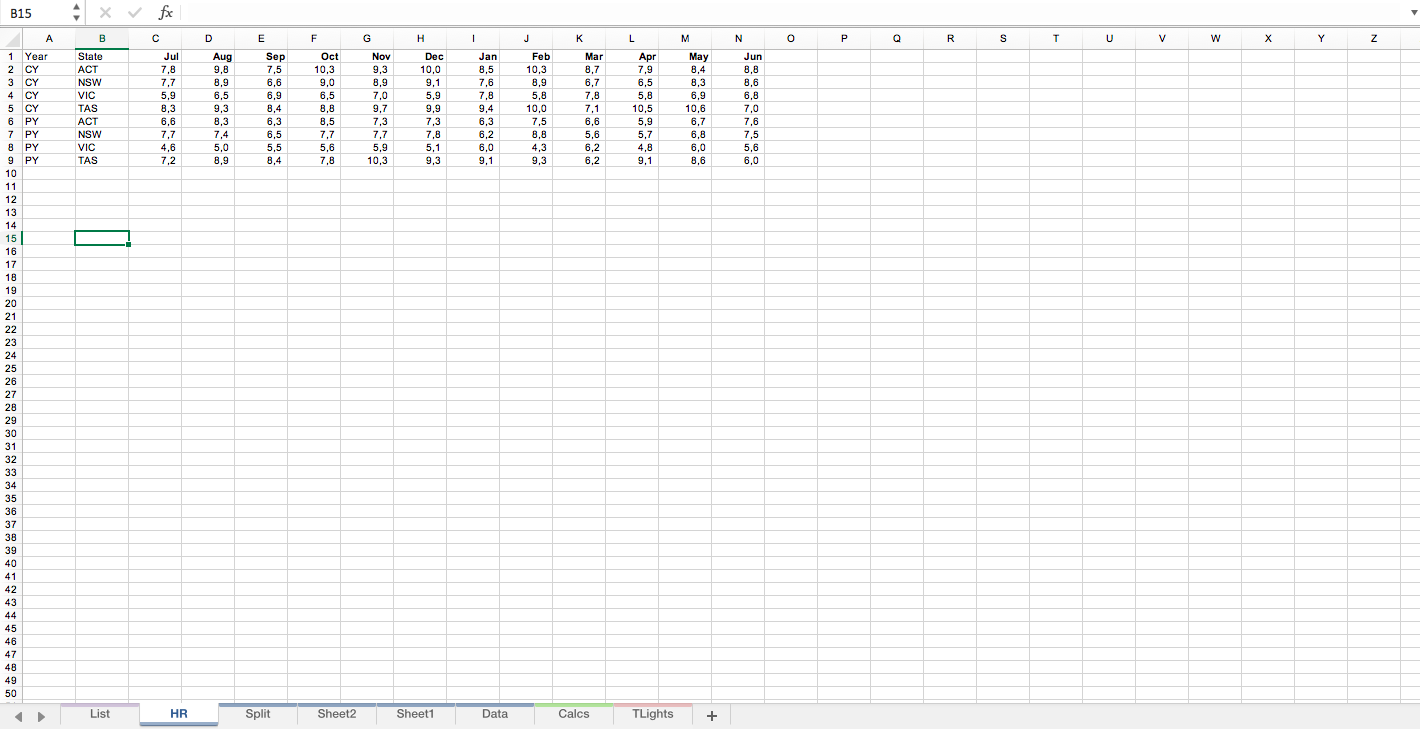
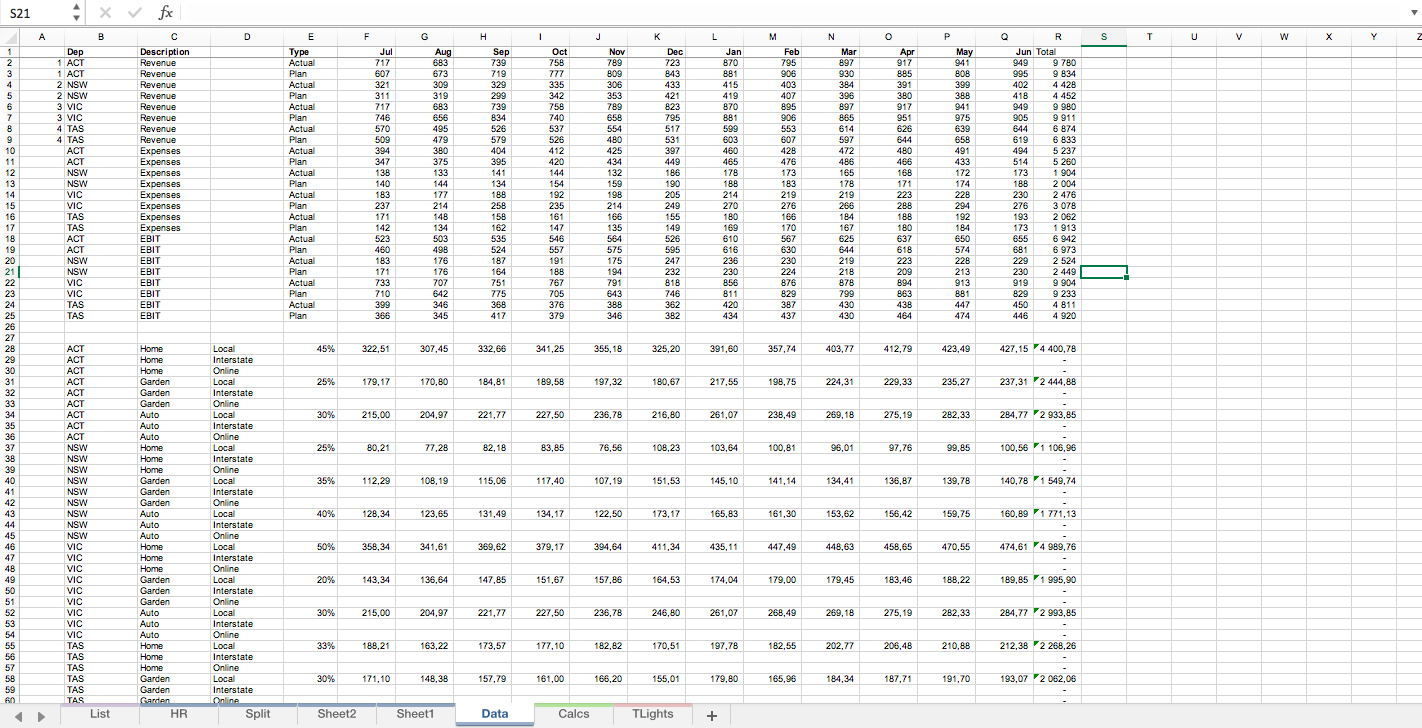
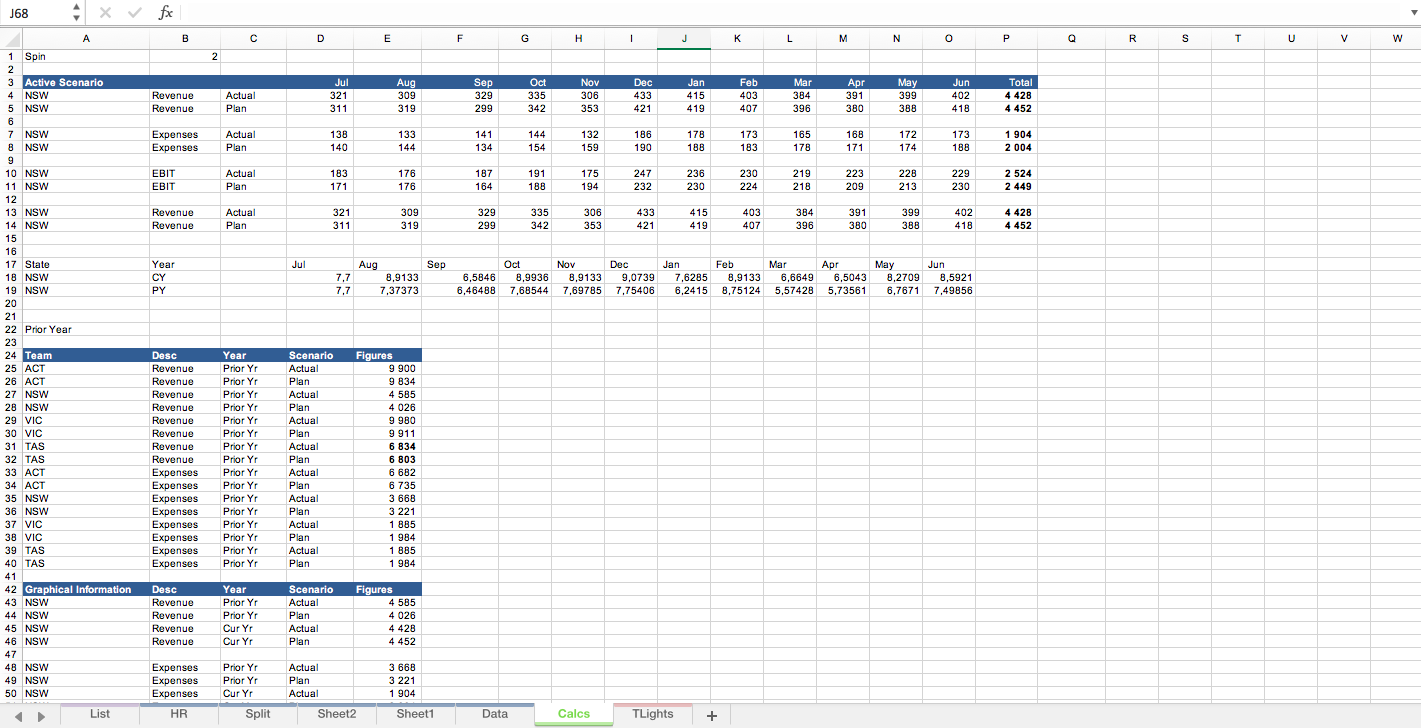
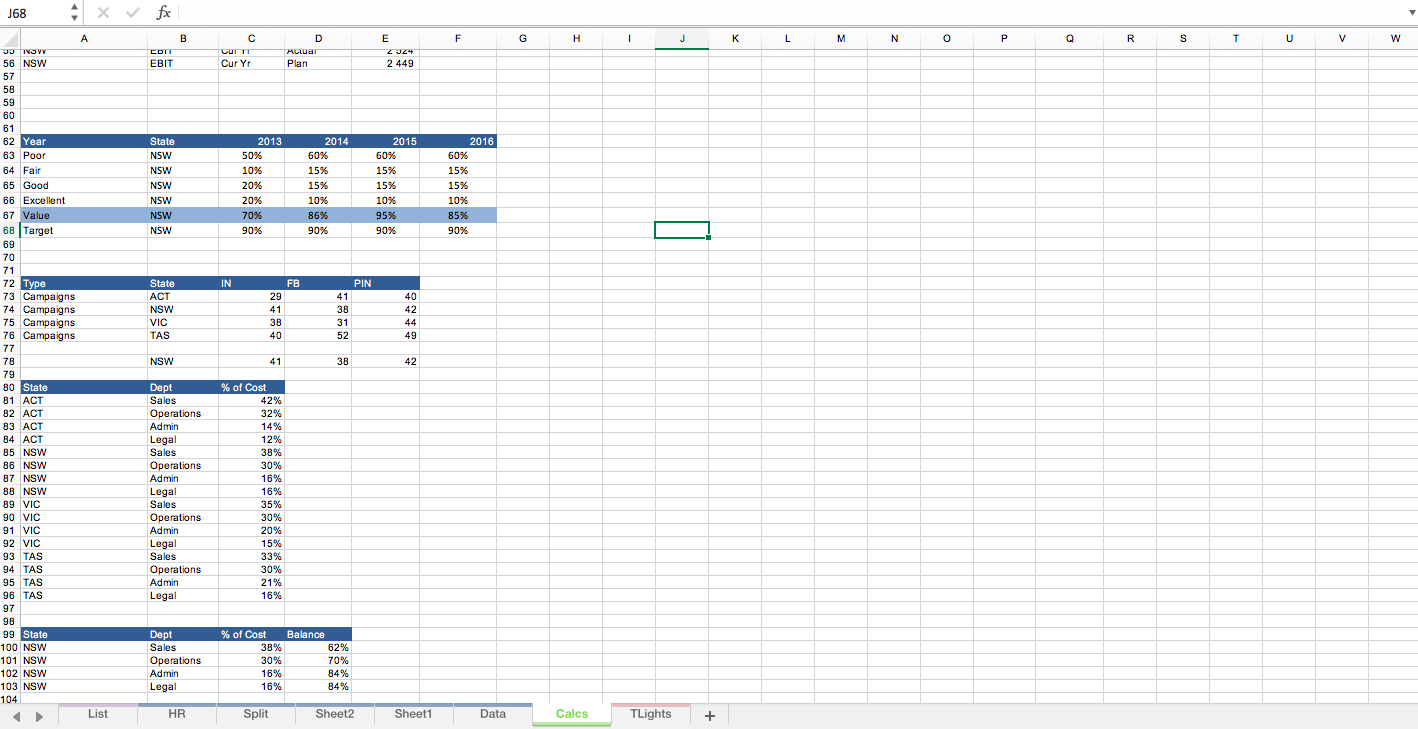
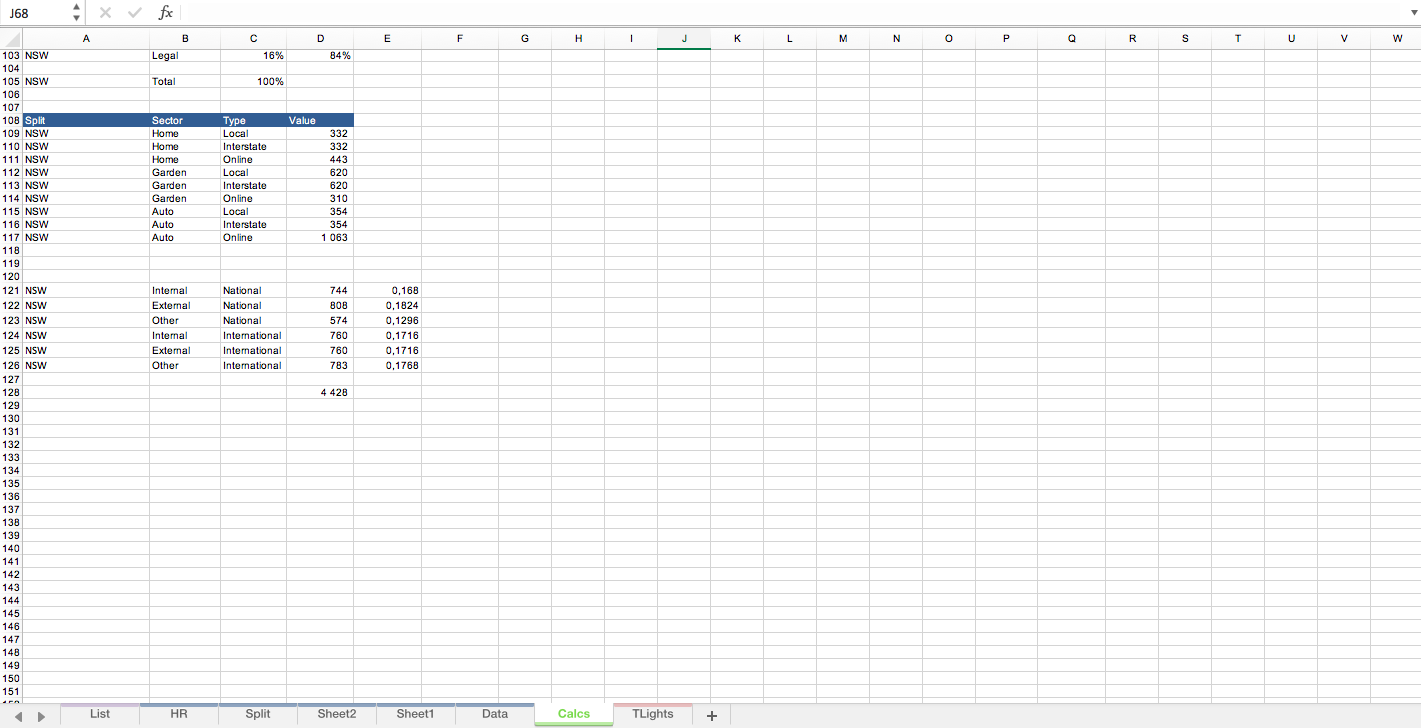
Traffic Light Excel Dashboard
This Excel doc. is a dashboard with great aesthetics.
