Publication number: ELQ-74469-1
View all versions & Certificate

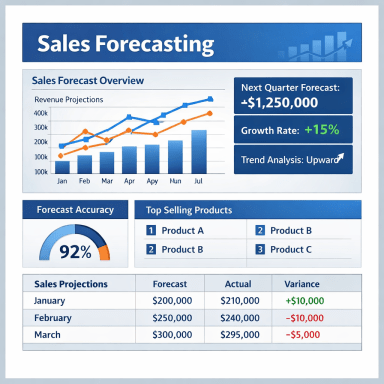
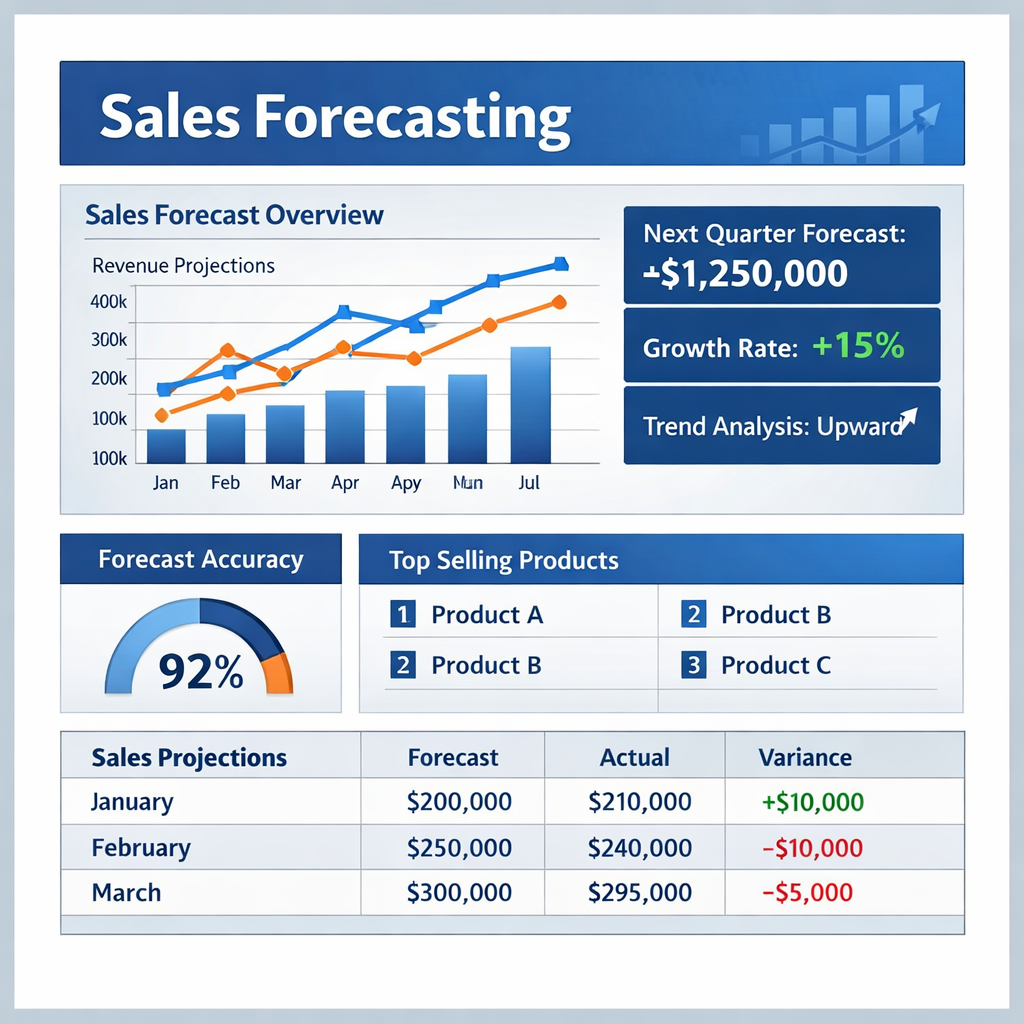
Sales Forecasting Toolkit
The same techniques used by professional demand planners and forecasting analysts, in a single Excel file you can use in under an hour.
📊 Sales Forecasting Toolkit — Excel Template
By Data'sOk
━━━━━━━━━━━━━━━━━━━━━━━━
Stop guessing next month's sales. Start forecasting them.
Every business needs a sales forecast. Most businesses make one by taking last year's number and adding a percentage. This toolkit does something better — it applies four industry-standard statistical methods to your actual historical data, compares their accuracy, and produces a 12-period forecast with three scenarios.
The same techniques used by professional demand planners and forecasting analysts, in a single Excel file you can use in under an hour.
━━━━━━━━━━━━━━━━━━━━━━━━
WHAT YOU GET
9-tab Excel workbook, fully unlocked:
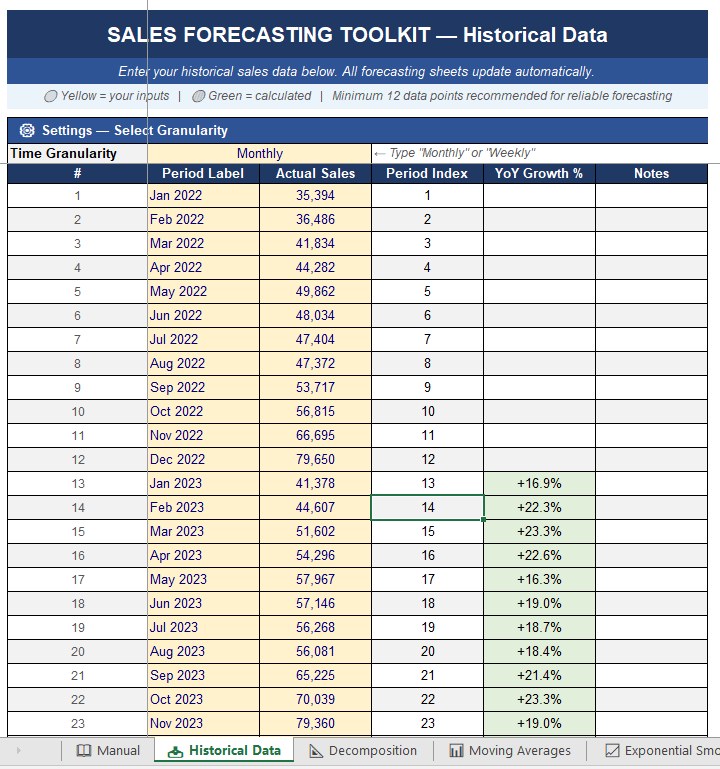
📥 Historical Data — Enter your monthly or weekly sales figures (36 months of e-commerce sample data included). Auto-calculates YoY growth, mean, standard deviation, CAGR, and coefficient of variation.
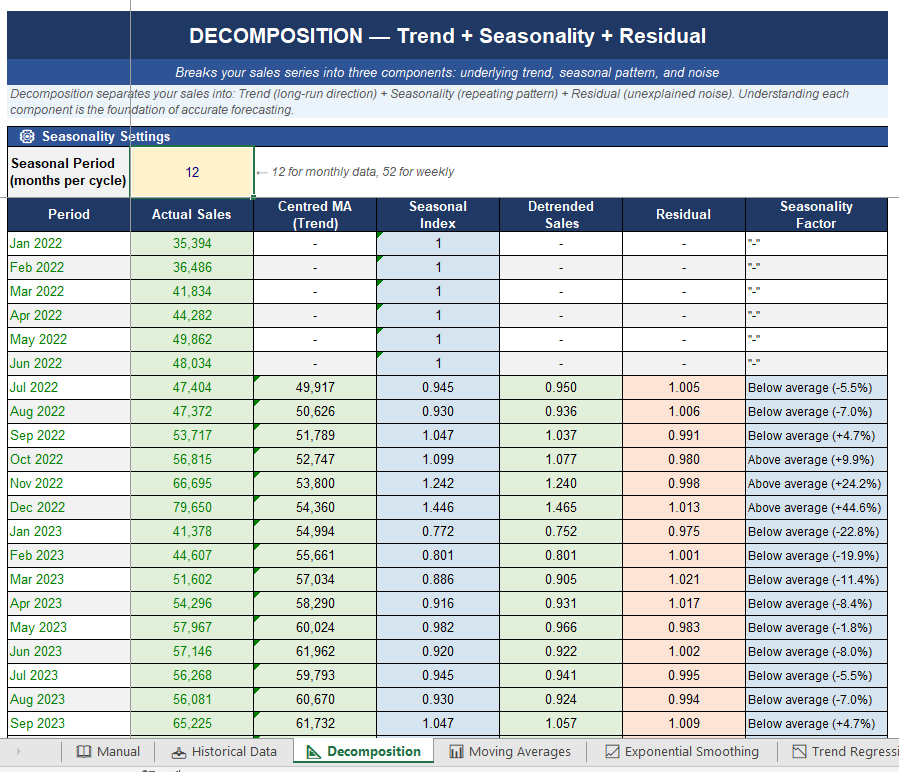
📐 Decomposition — Separates your sales into three components: Trend (long-run direction) + Seasonality (repeating pattern) + Residual (noise). Shows you exactly which months are your strongest and weakest.
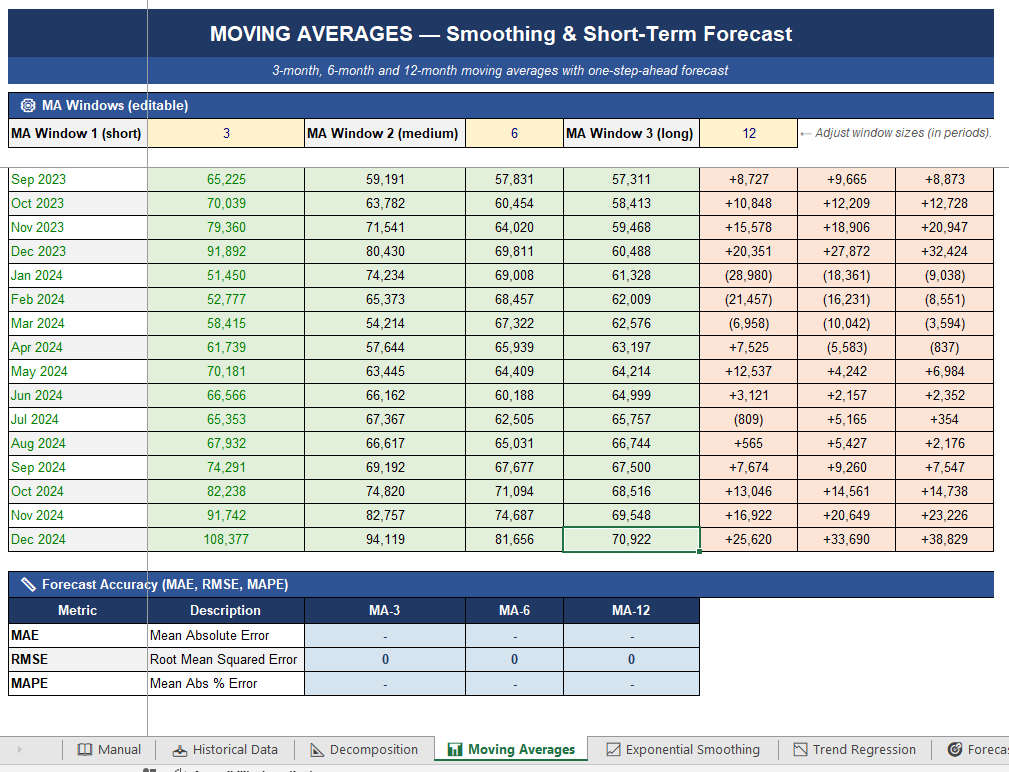
📊 Moving Averages — MA-3, MA-6, and MA-12 with adjustable windows. One-step-ahead forecast errors and accuracy metrics (MAE, RMSE, MAPE) for each.
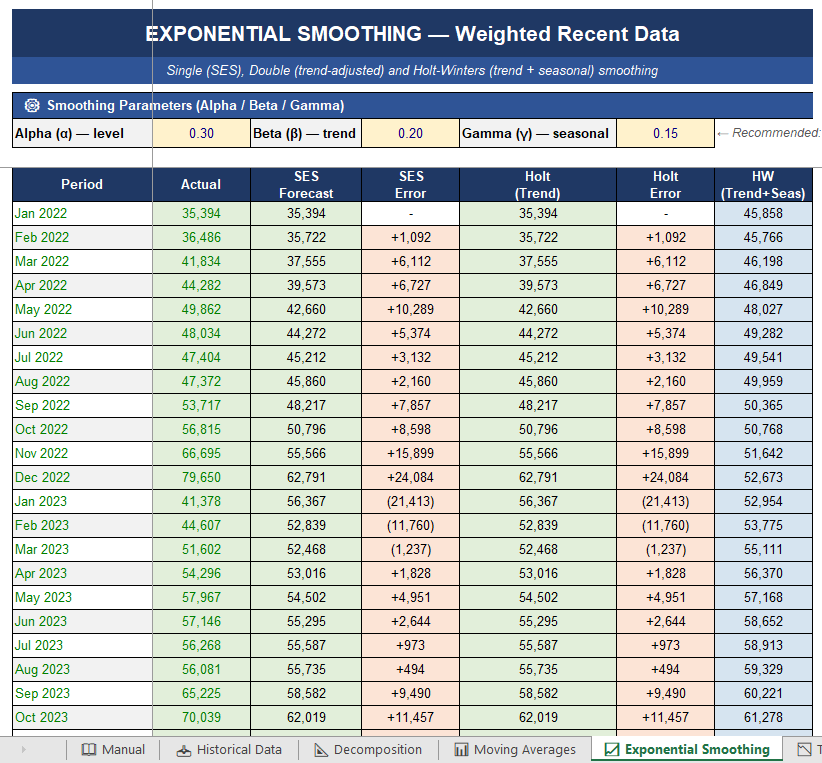
📈 Exponential Smoothing — Three methods side by side: SES (level), Holt (level + trend), and Holt-Winters (level + trend + seasonal). All smoothing parameters adjustable. Accuracy comparison included.
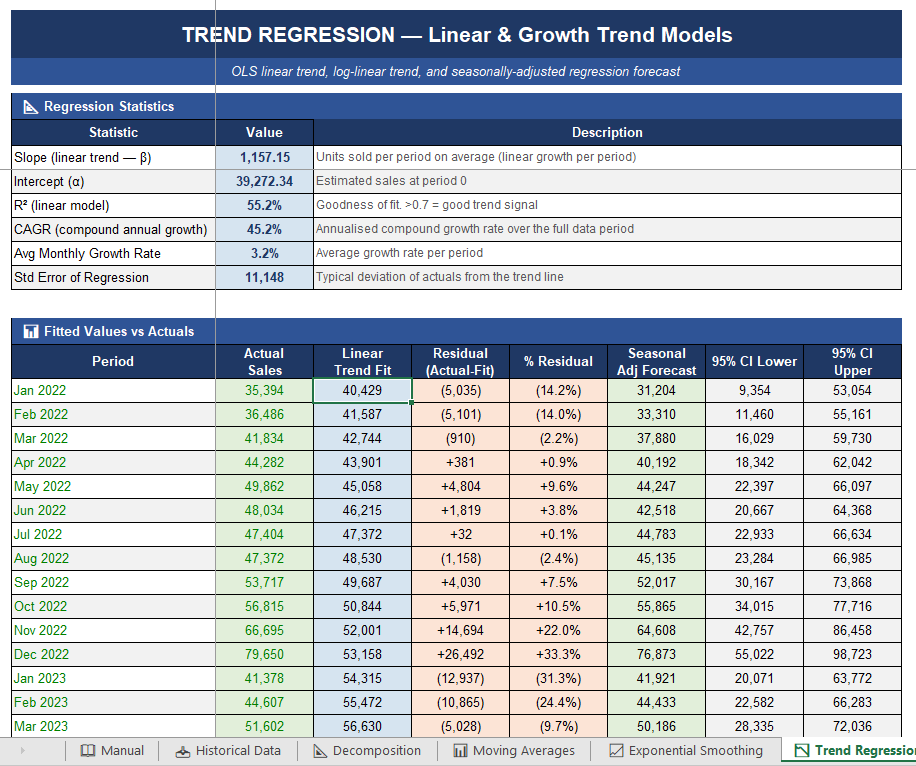
📉 Trend Regression — OLS linear trend with slope, R², CAGR, standard error, fitted values, residuals, and seasonally-adjusted forecasts with 95% confidence intervals.
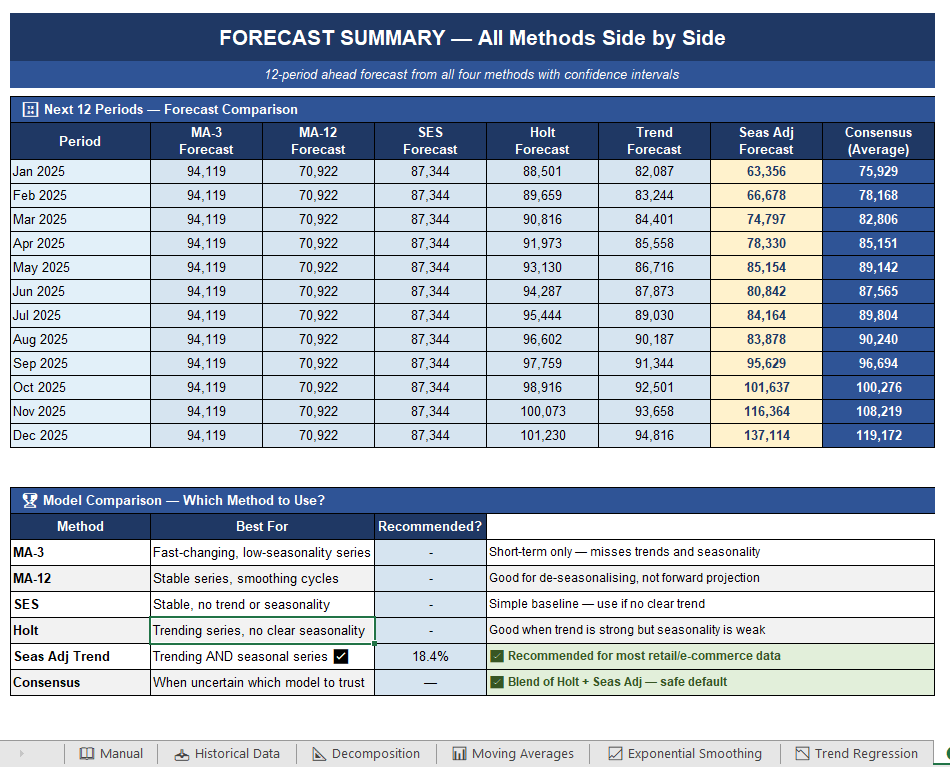
🎯 Forecast Summary — All four methods side by side for the next 12 periods, with a Consensus column and a model recommendation table.
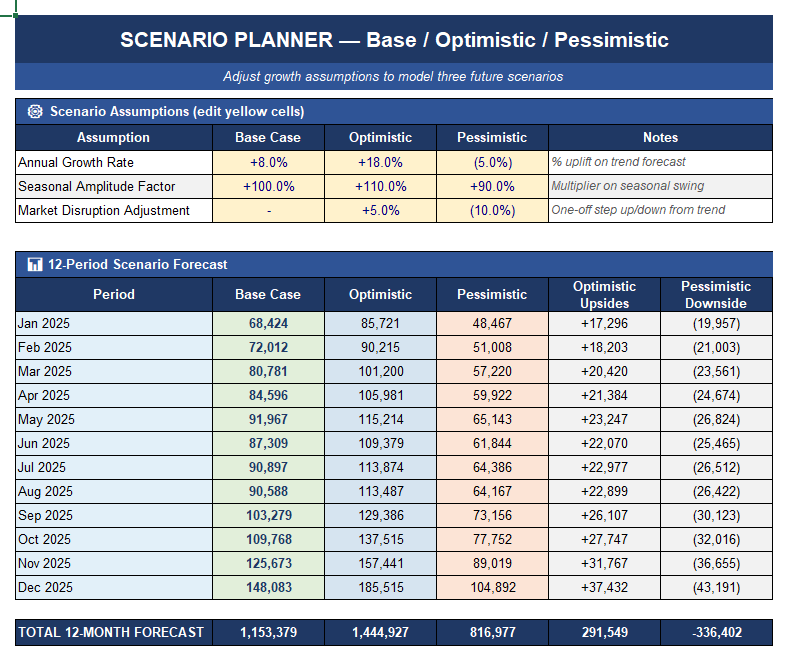
🔮 Scenario Planner — Base, Optimistic, and Pessimistic scenarios with three adjustable assumptions: growth rate, seasonal amplitude, and market disruption adjustment.
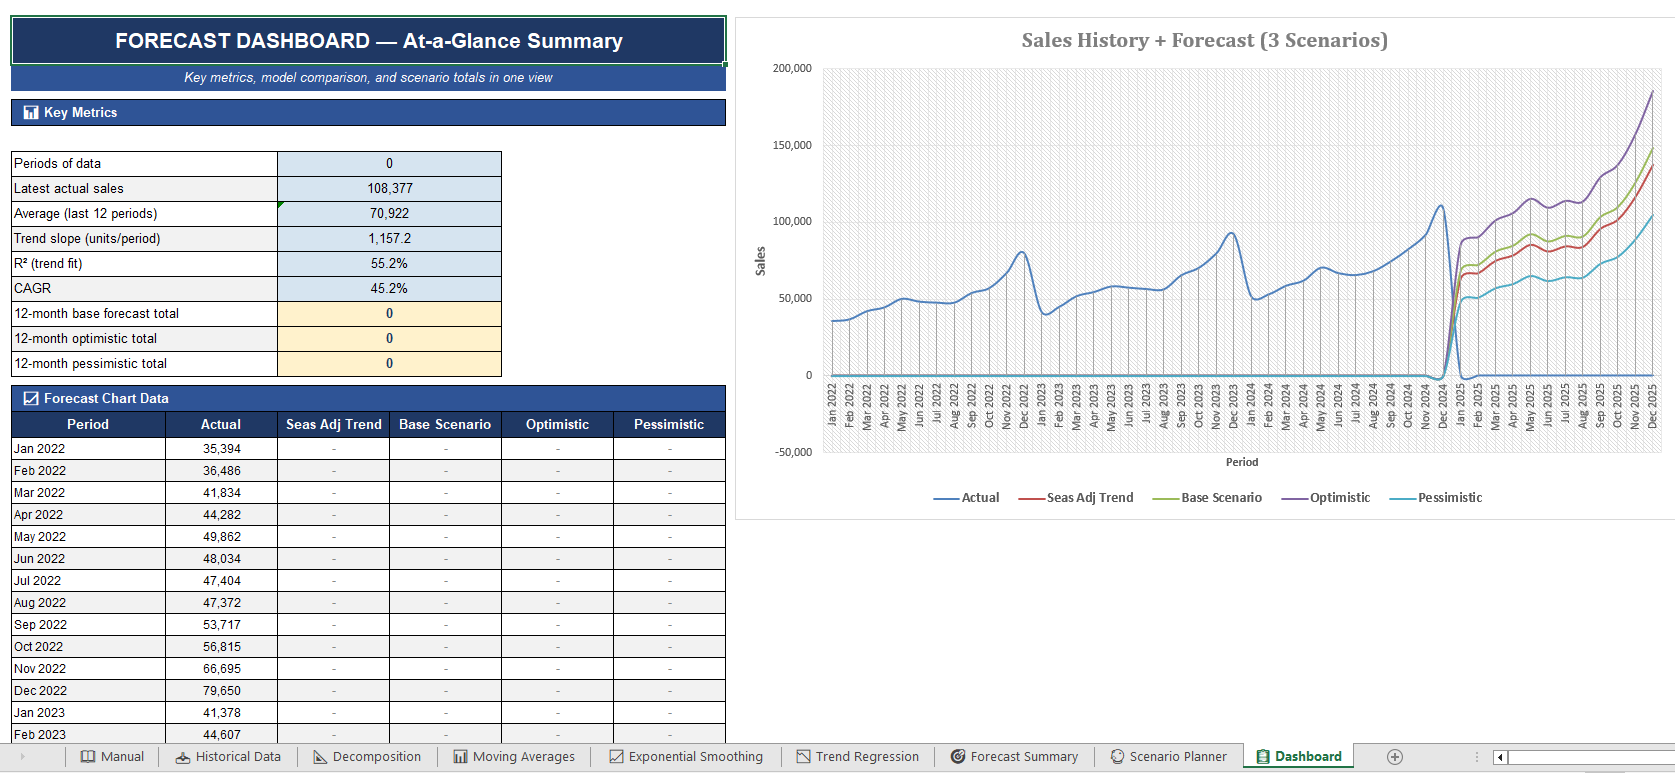
📋 Dashboard — Key metrics panel and a full historical + forecast chart showing all three scenarios.
📖 Manual — Plain-English guide covering all four methods, accuracy metrics, parameter tuning, and data tips.
━━━━━━━━━━━━━━━━━━━━━━━━
WHO IT'S FOR
→ E-commerce and retail managers building a monthly or annual sales plan
→ Category managers who need a defensible, data-driven forecast for leadership
→ Small business owners who want to move beyond gut-feel revenue projections
→ Consultants who need a fast, credible forecasting model for a client
→ Anyone who has ever been asked "what are your sales going to be next quarter?"
━━━━━━━━━━━━━━━━━━━━━━━━
WHY IT'S DIFFERENT
Most forecasting templates offer one method — usually a simple moving average — and call it a day. This toolkit gives you four methods, compares their accuracy on your actual data, and tells you which one to trust. It also separates trend from seasonality, so your forecast reflects both the long-run direction of your business and the repeating patterns within each year.
No subscription. No software to install. No data uploaded anywhere. Just Excel.
━━━━━━━━━━━━━━━━━━━━━━━━
REQUIREMENTS
Microsoft Excel 2016 or later (Windows or Mac). Not tested in Google Sheets.
Minimum 12 data points recommended. 24–36 periods gives the best seasonal accuracy.
This Best Practice includes
1 Excel file.
