OpEx Budget vs. Actuals Variance Commander — Cash Runway Sheet
Originally published: 22/12/2025 21:48
Last version published: 13/07/2026 20:16
Publication number: ELQ-74408-2
View all versions & Certificate
certified

OpEx Budget vs. Actuals Variance Commander — Cash Runway Sheet

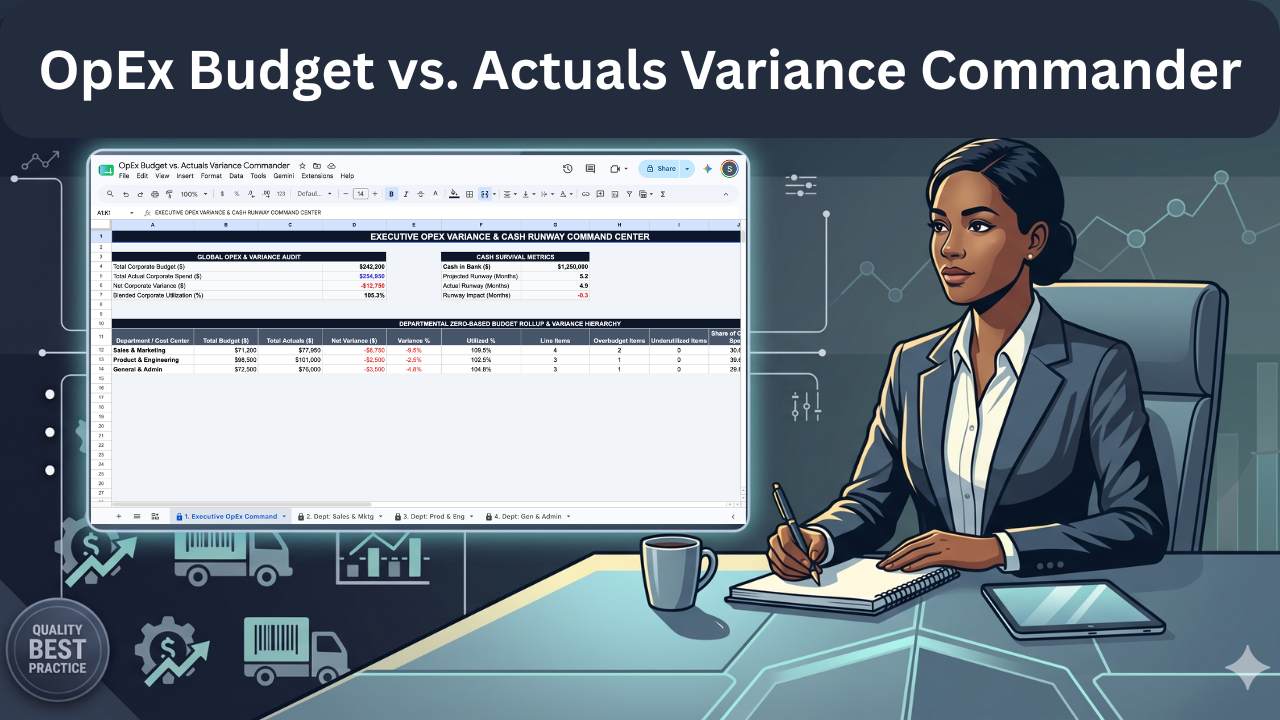
Stop OpEx bloat and track departmental variance. Zero-based budgeting that translates line-item overspend into lost cash runway, natively in Google Sheets.

Description

Operating expense (OpEx) bloat is the silent killer of growth-stage companies. Department heads often treat their budgets as abstract targets rather than strict capital boundaries, tracking expenses in isolated, static spreadsheets that never connect to a master ledger. Because of this, founders and CFOs rarely realize how a $5,000 SaaS overspend in Marketing combined with a $12,000 travel overage in Sales mathematically shaves critical weeks off the entire company's survival.


The OpEx Budget vs. Actuals Variance Commander translates line-item overspending directly into lost cash runway. Built natively and exclusively for Google Sheets, it forces zero-based accountability across your entire organization and elevates basic budget tracking into an executive-grade financial survival tool:


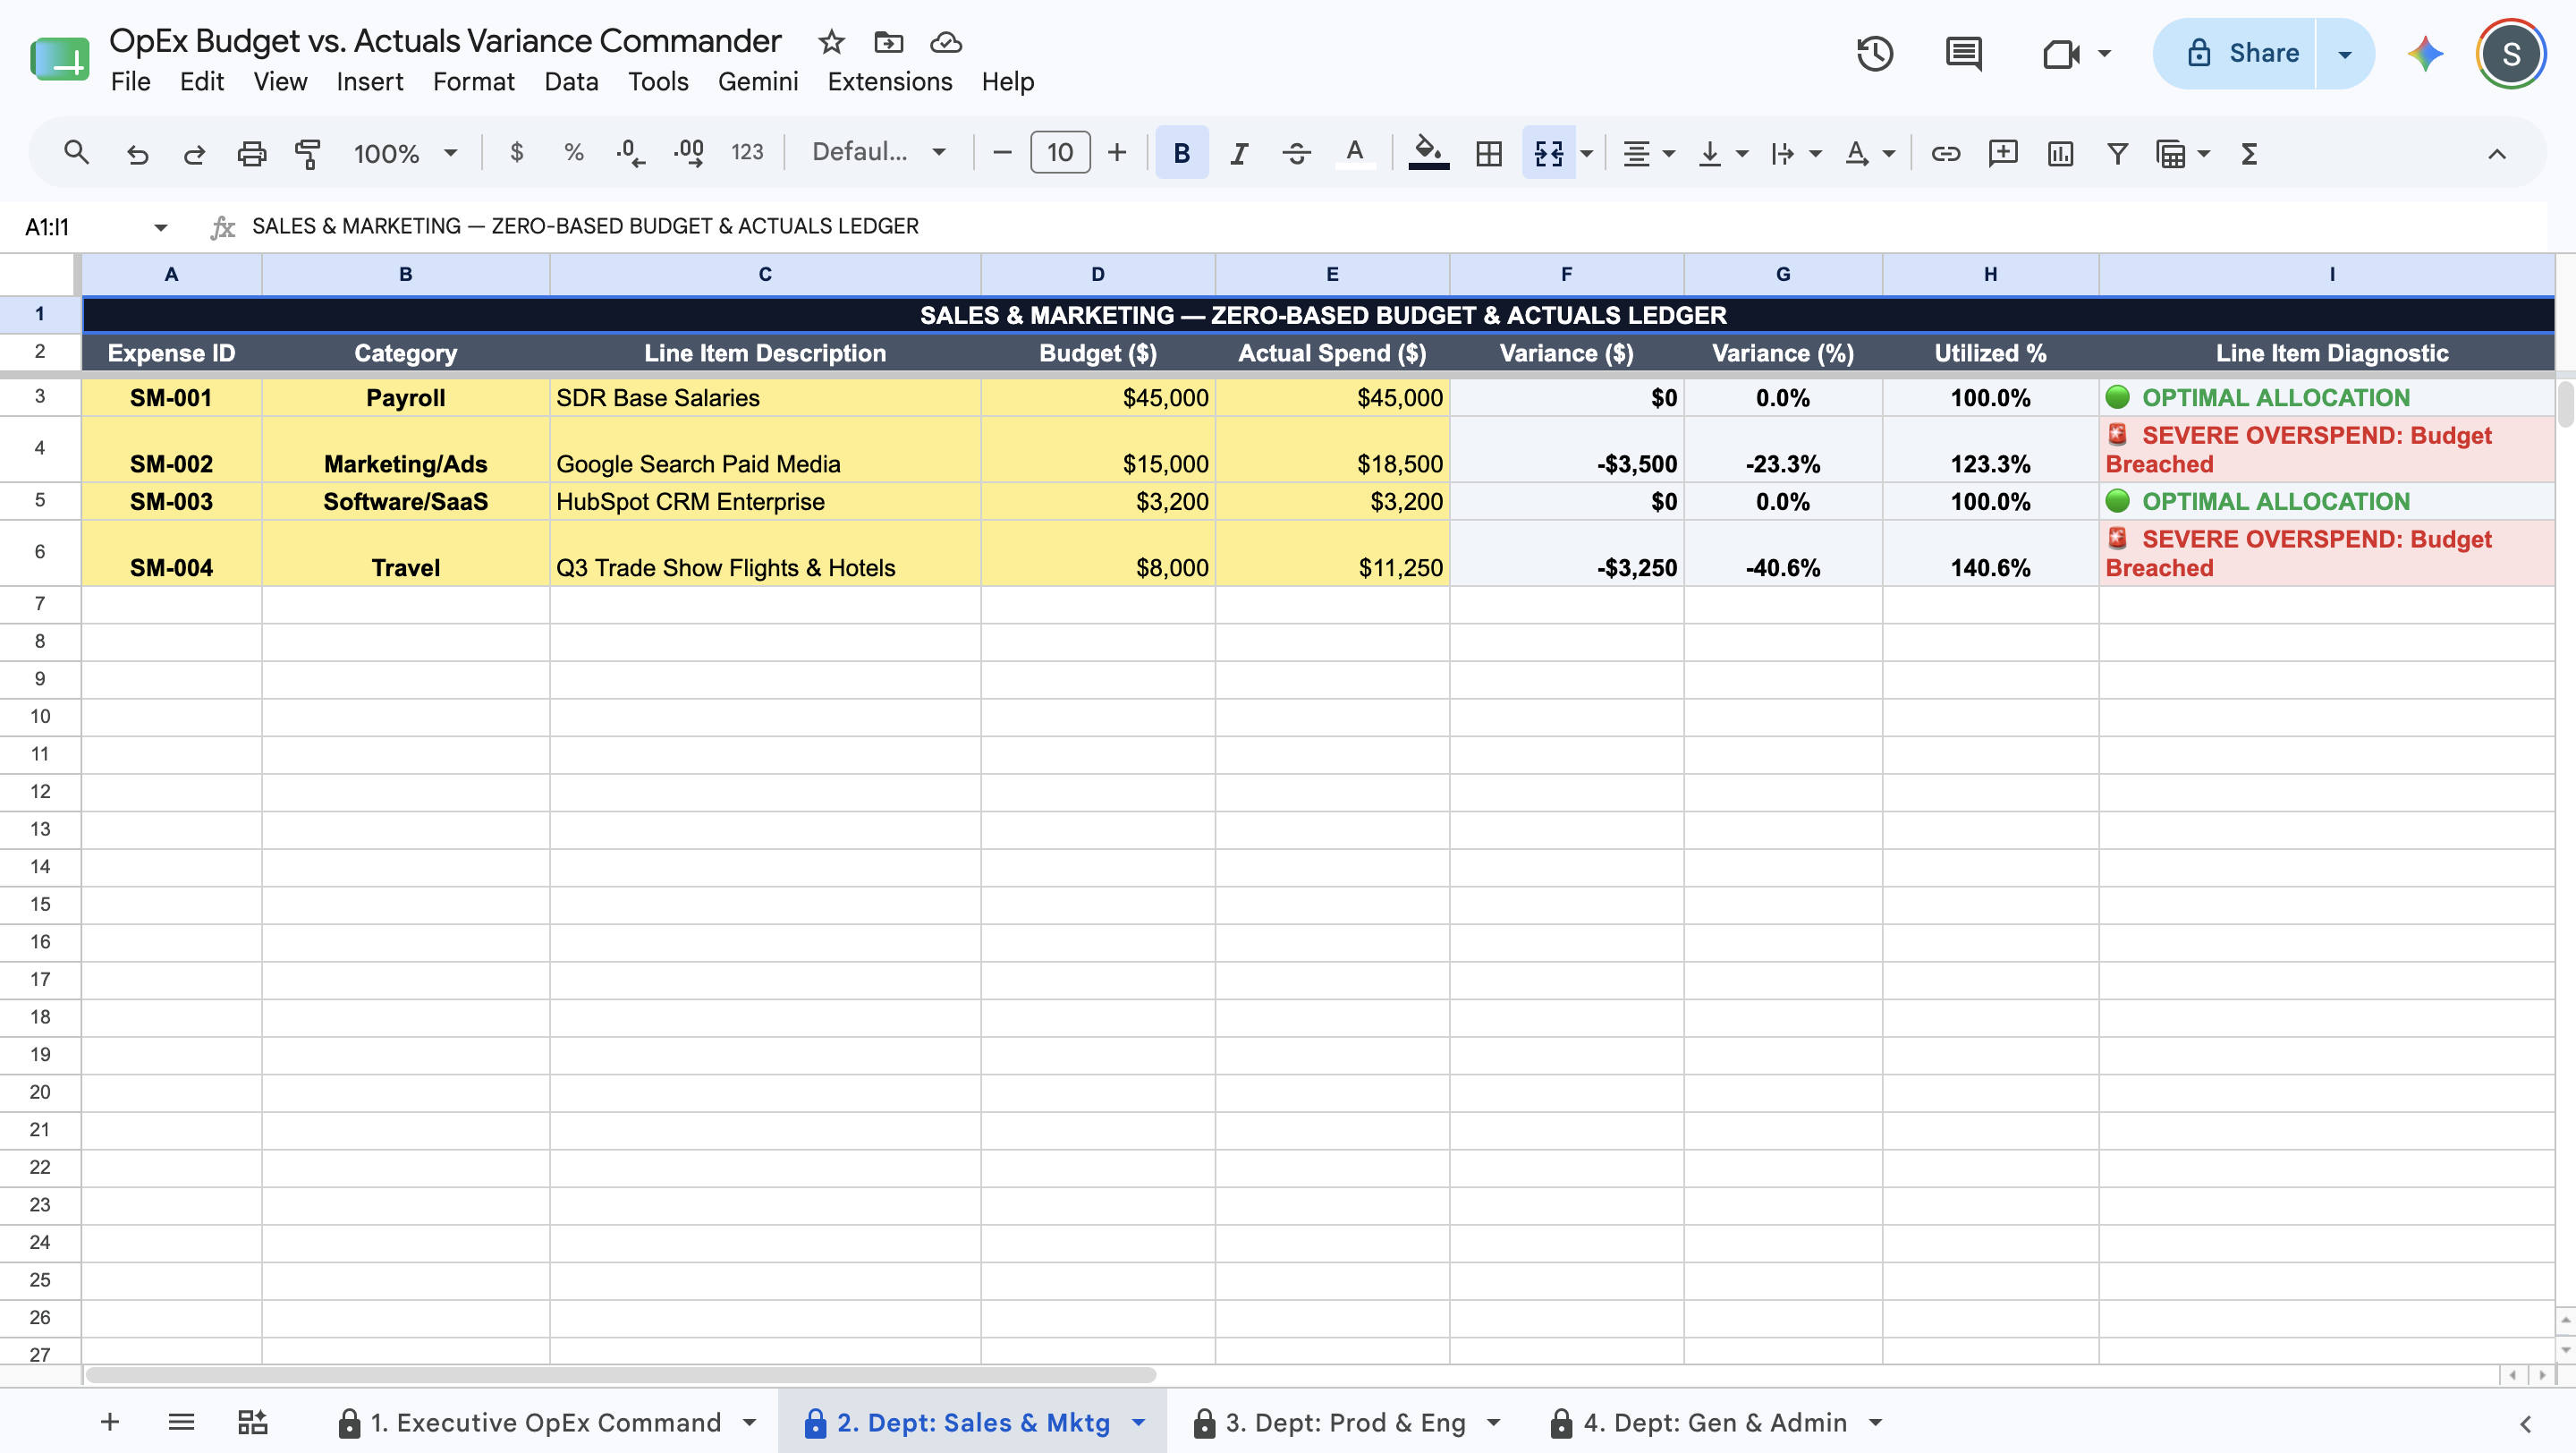
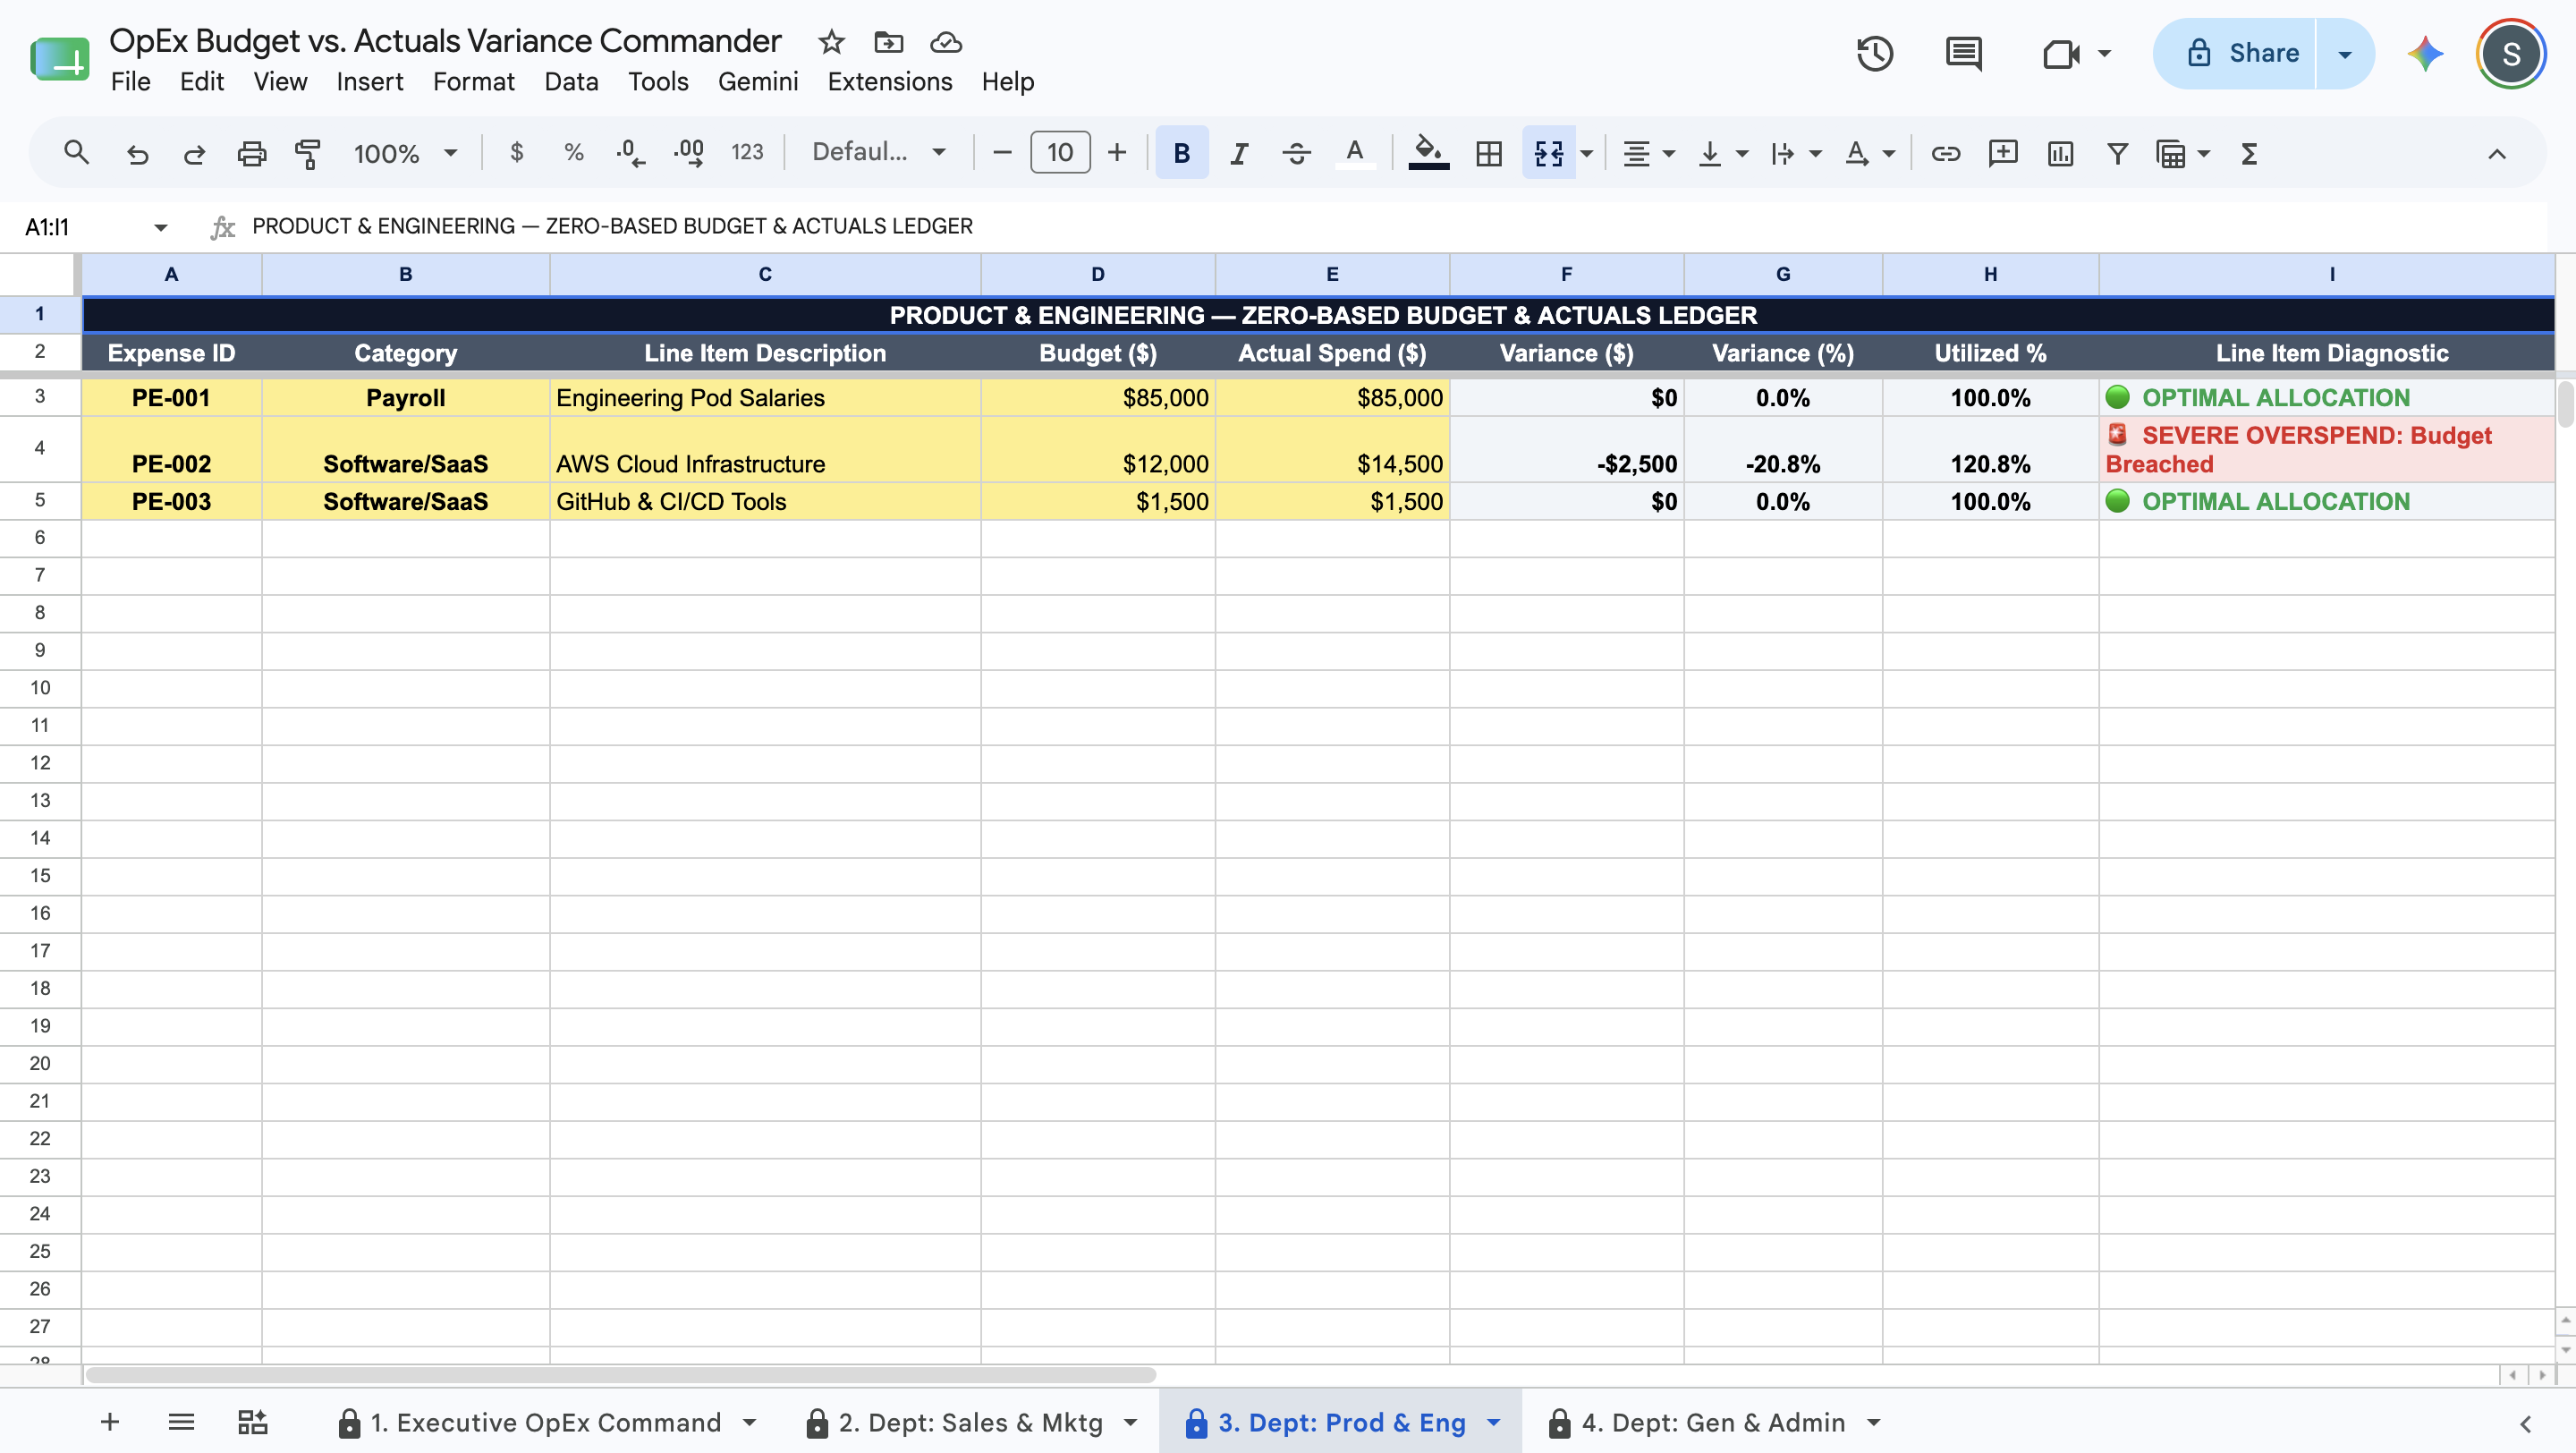
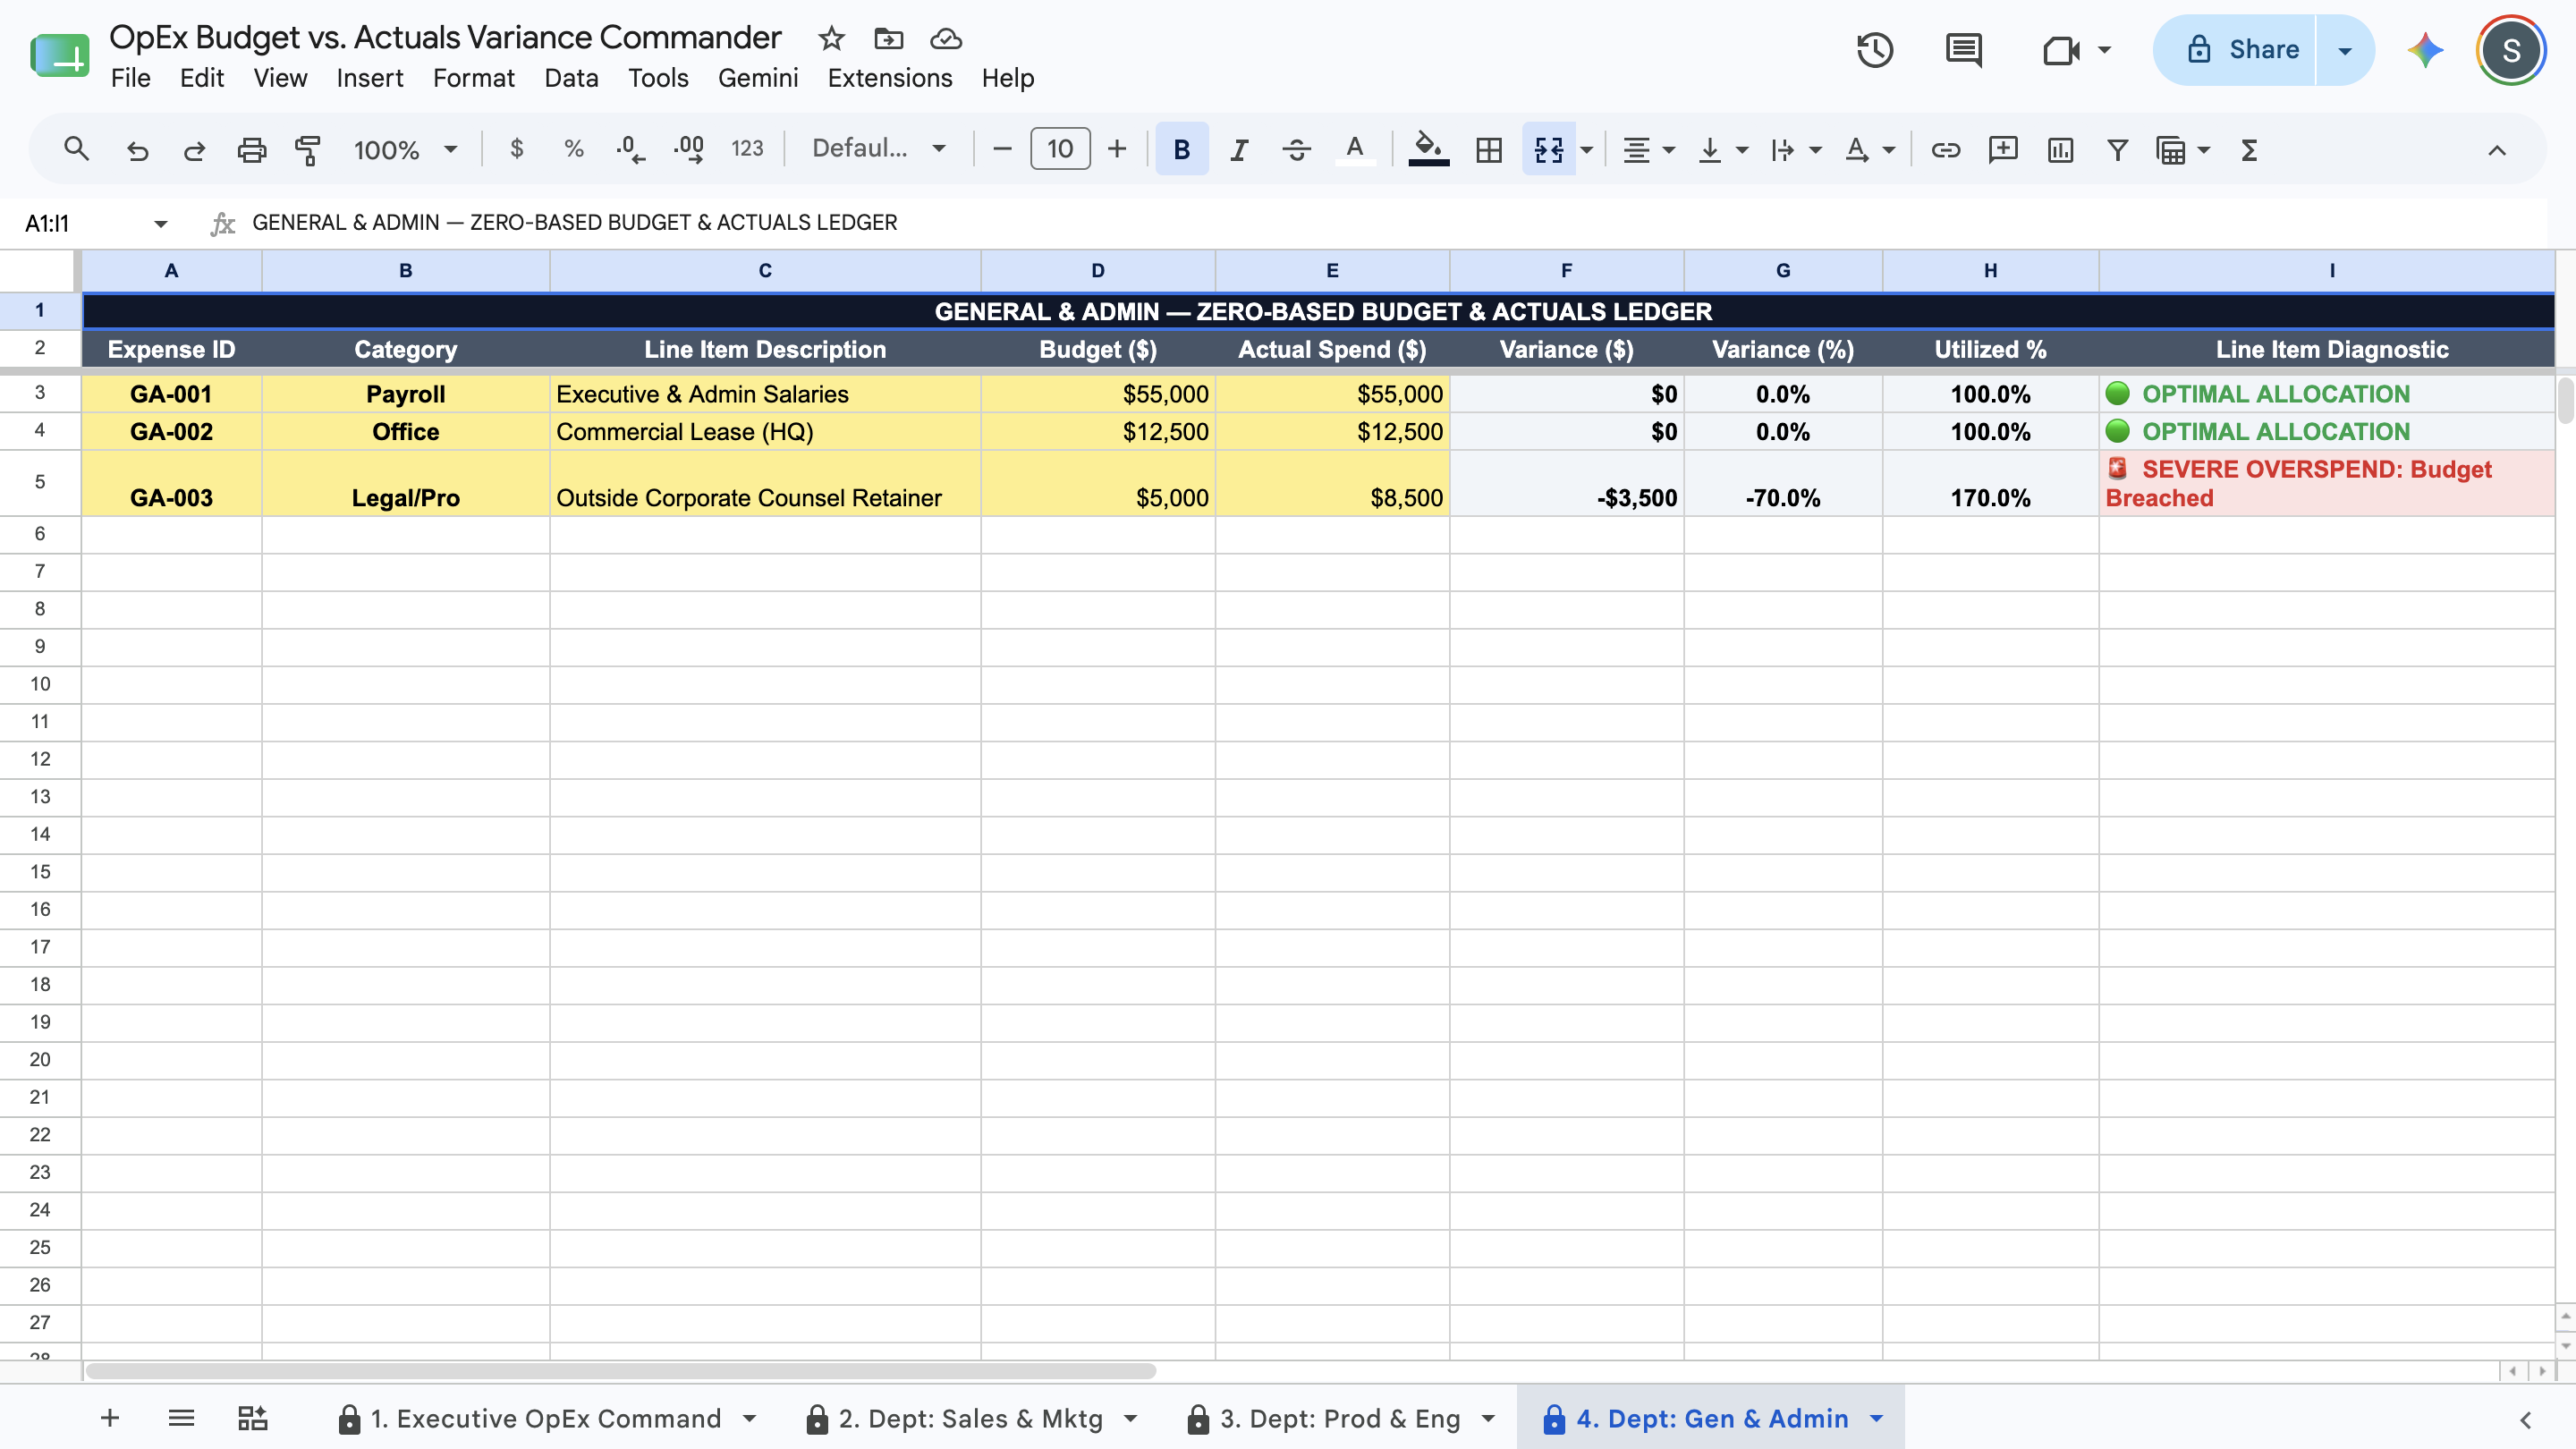
  • Zero-Based Departmental Ledgers: Pre-configured tracking environments for Sales & Marketing, Product & Engineering, and General & Admin. Department heads log actuals against line-item budgets, instantly generating Variance ($), Variance (%), and Utilized (%) metrics.

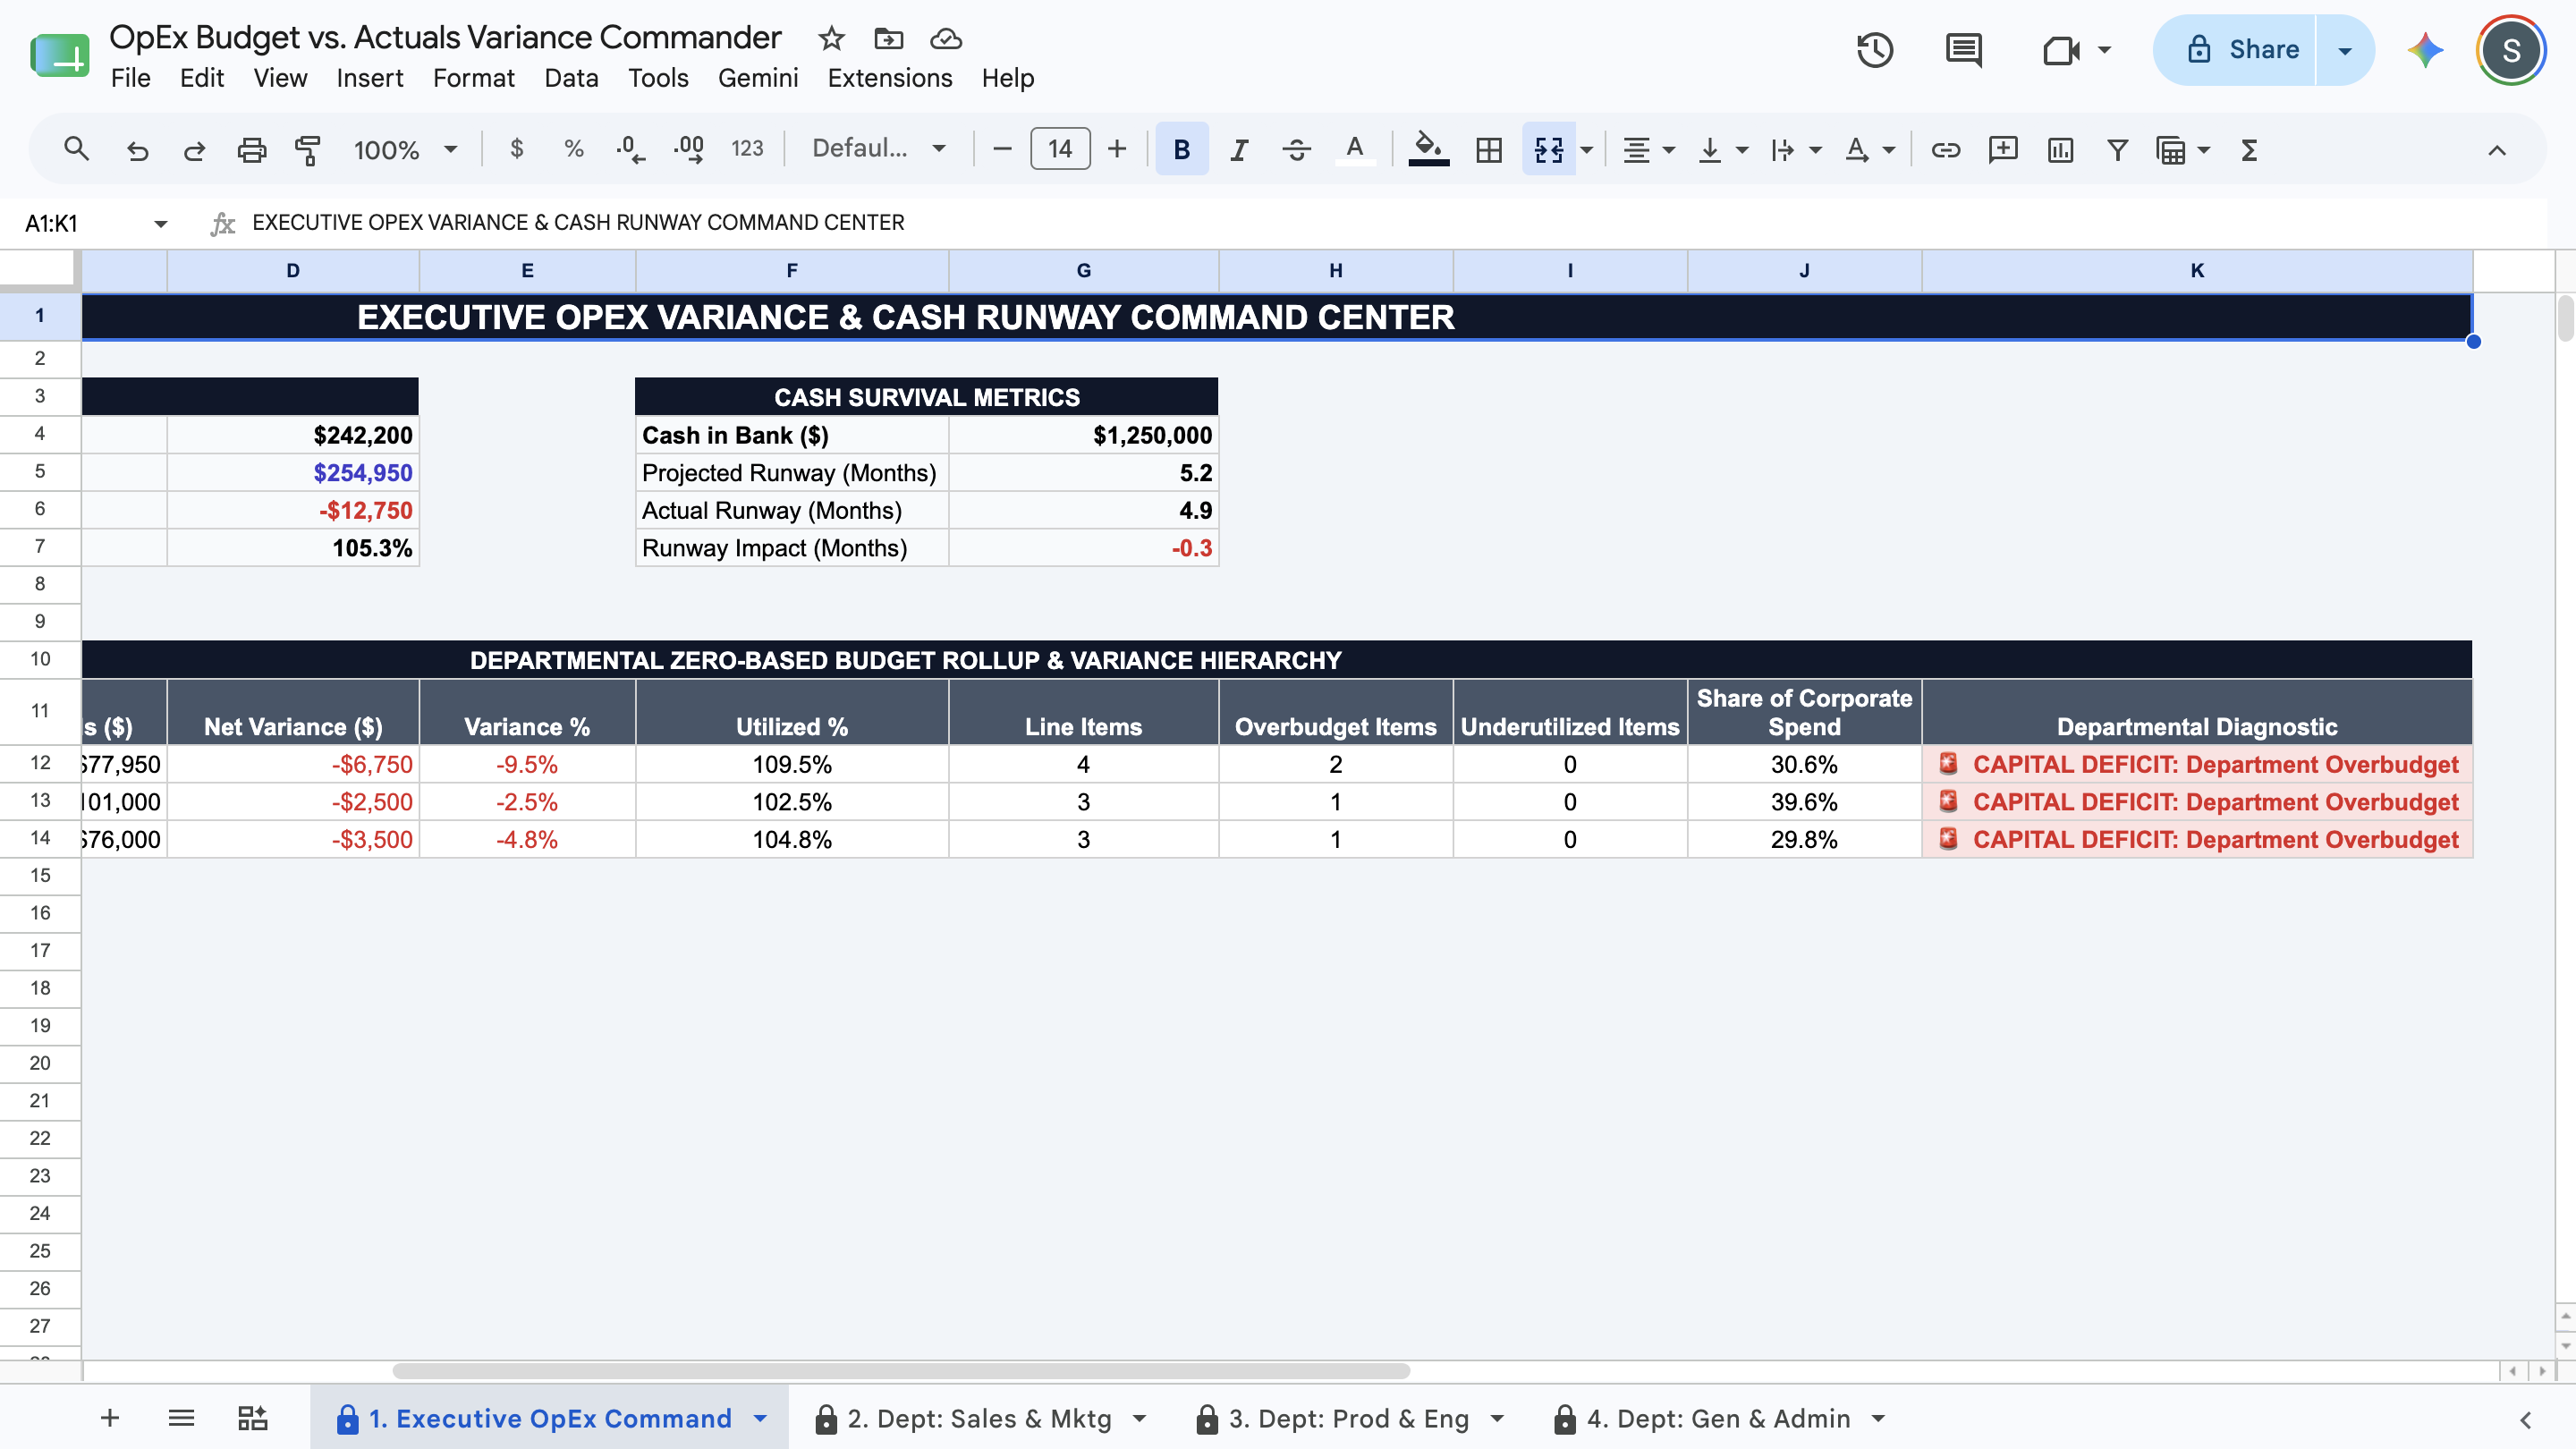
  • Automated Spending Diagnostics: The engine continuously audits spending velocity. Line items dynamically trigger explicit visual alerts: 🟢 OPTIMAL ALLOCATION for healthy spend, 🟡 UNDER UTILIZED to flag stagnant capital, and 🚨 SEVERE OVERSPEND to highlight breached budgets requiring immediate CFO justification.

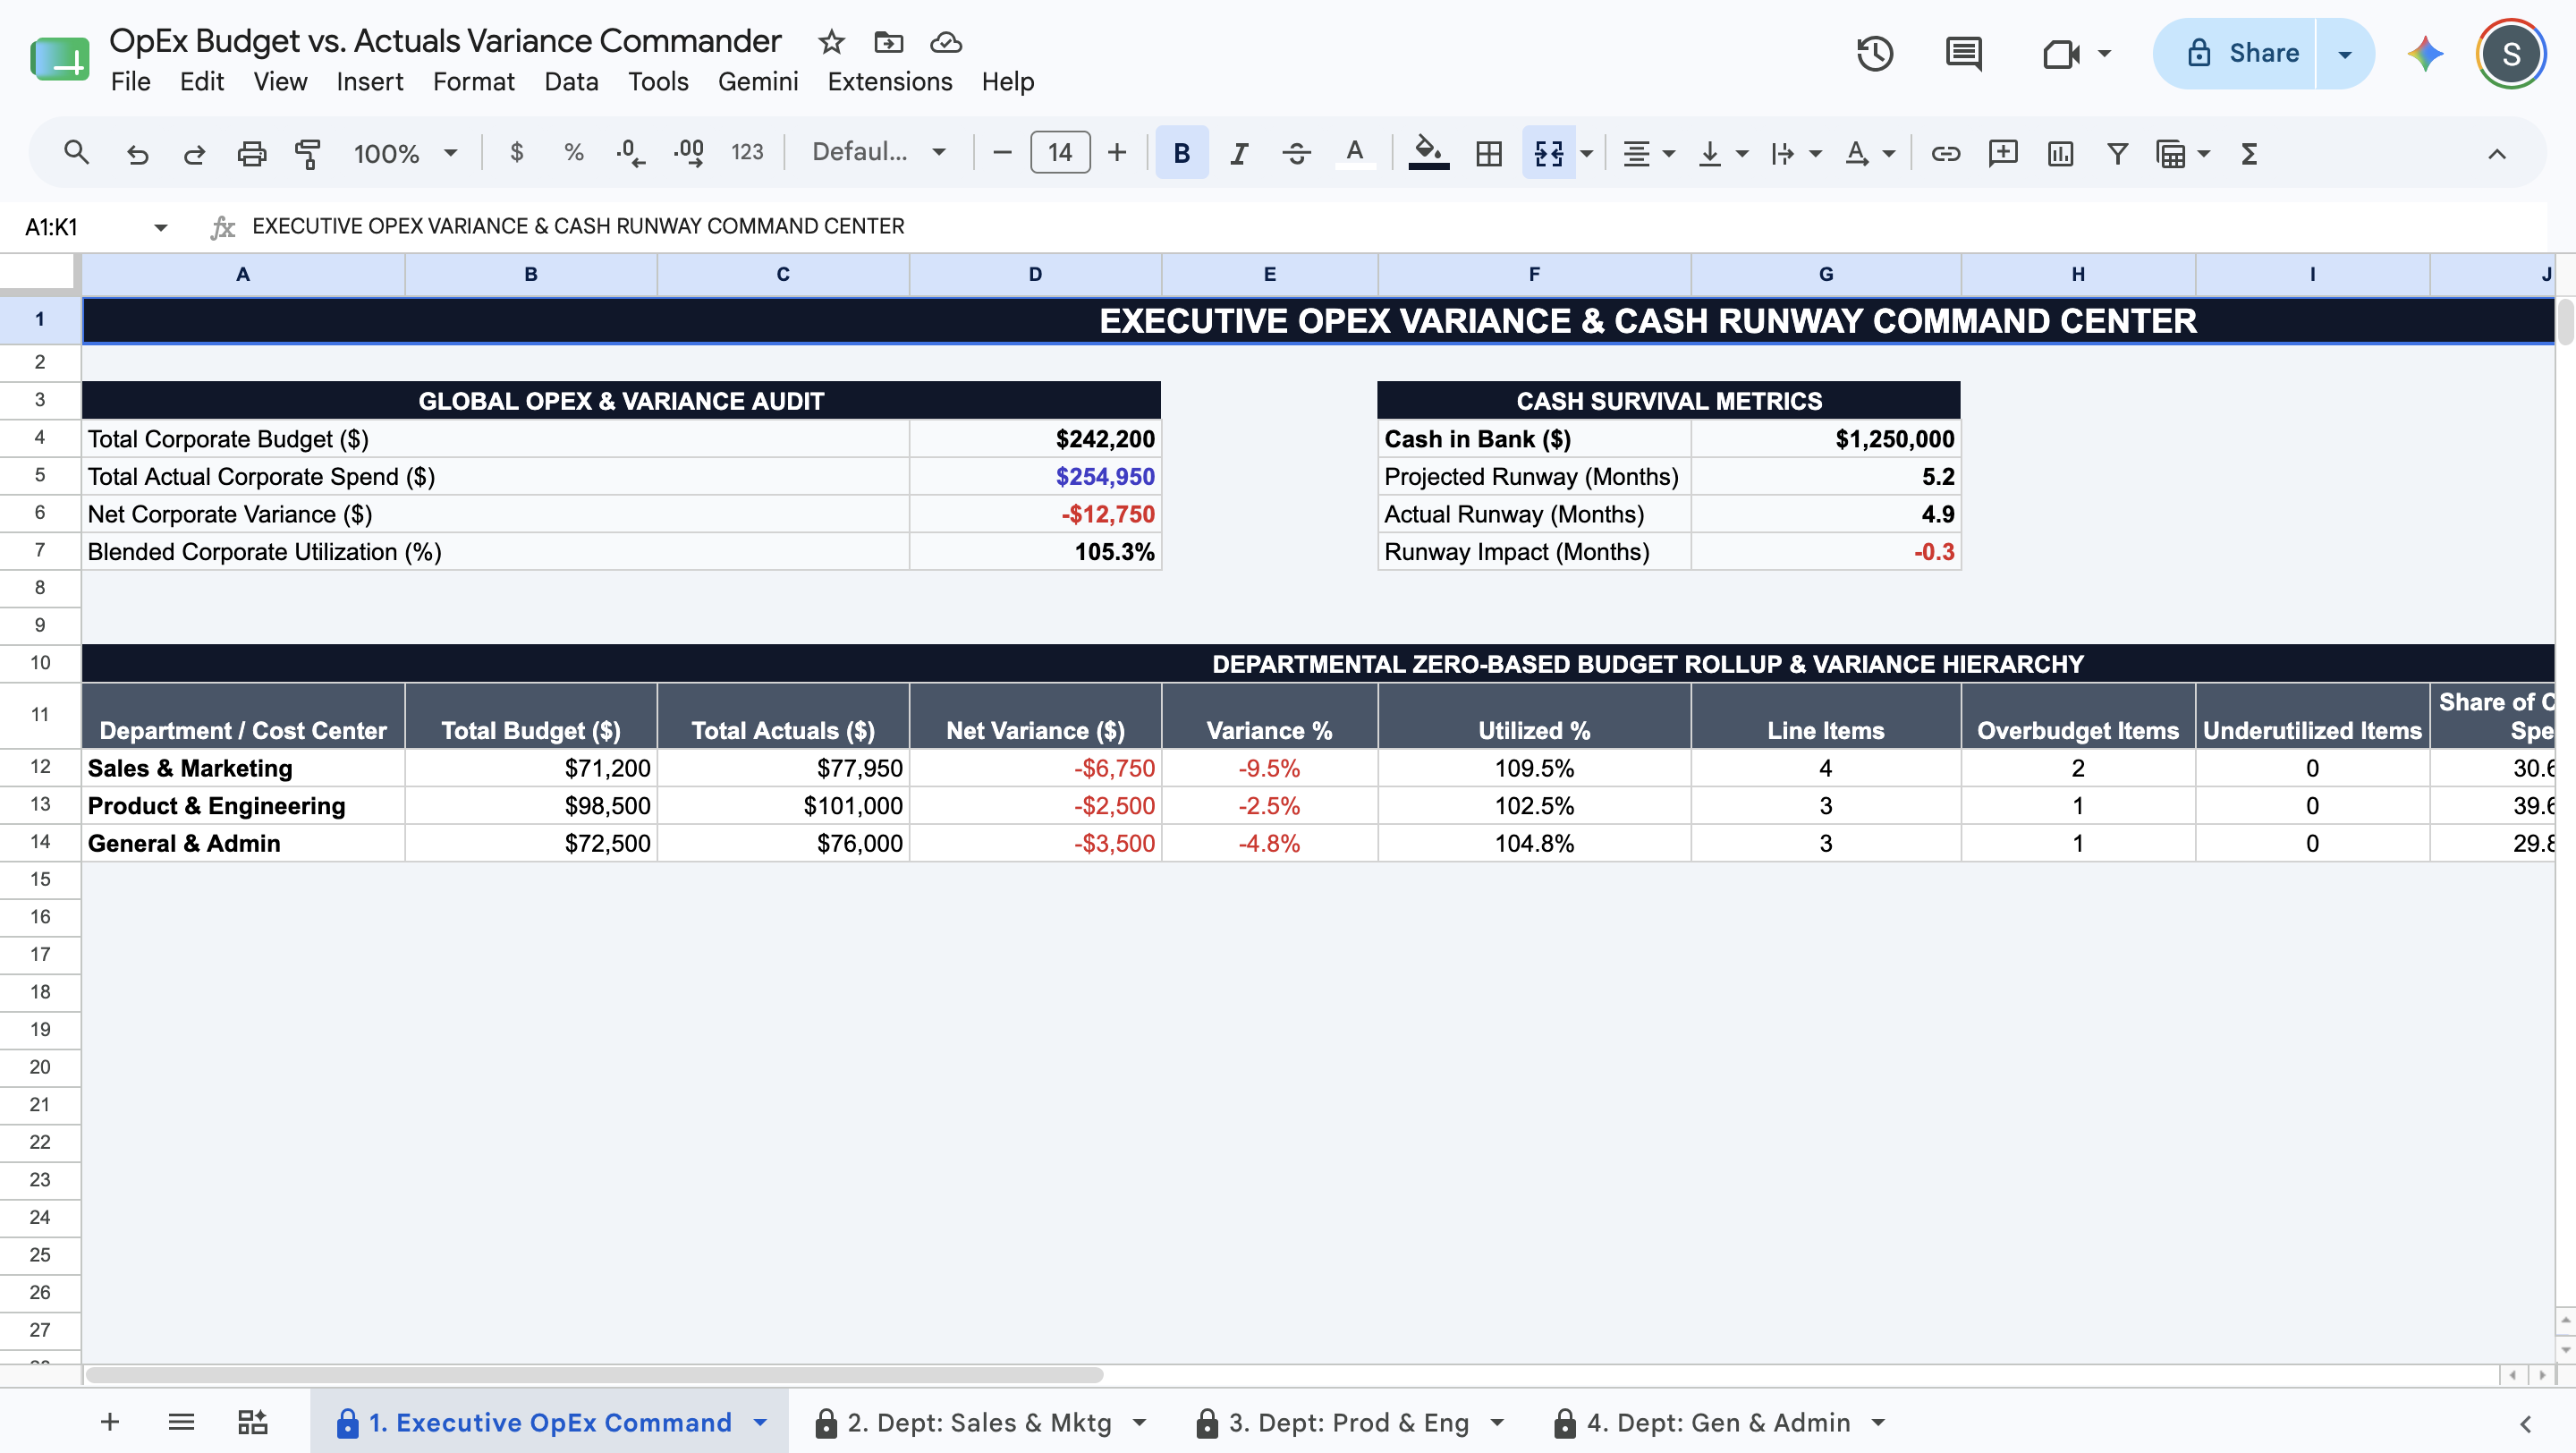
  • The "Trojan Horse" Cash Survival Math: Go beyond simple variance. The system divides your Cash in Bank against authorized budgets and actual spend to calculate your baseline versus actual runway. It then isolates the exact Runway Impact (Months)—showing you precisely how much corporate life was lost due to departmental overspending.

  • The CFO War Room Dashboard: Get an instant, bird's-eye view of your corporate cash efficiency. Monitor Total Corporate Budget ($), Total Actual Corporate Spend ($), Net Corporate Variance ($), and Blended Corporate Utilization (%) in real time. If the variance goes negative, the dashboard bleeds red.

  • Departmental Rollup Hierarchy: A software-grade executive summary table that ranks your cost centers side-by-side. Pinpoint exact counts of overbudget items, calculate each department's Share of Corporate Spend (%), and issue institutional status tags like 🚨 CAPITAL DEFICIT: Department Overbudget.

  • Digitally Shrink-Wrapped Architecture: Engineered strictly as a cloud-native Google Sheet. Only the soft yellow (#FEF08A) input cells are unprotected. Your master variance equations, runway algorithms, and presentation grids are entirely locked down to guarantee zero calculation drift or #REF! errors.


Stop guessing your burn rate, fighting with broken budget templates, or paying recurring monthly subscriptions for heavy FP&A software. Establish institutional command over your OpEx, force departmental accountability, and export clean, grid-free PDF financial memorandums natively from your web browser.

This Best Practice includes
1 Google Sheet, 1 User Guide

Acquire business license for $19.00 $1.90

Add to cart

Add to bookmarks

Discuss

Further information

Track zero-based departmental budgets against actual spend to calculate precise line-item Variance ($) and Variance (%)

Translate corporate overspending into concrete financial risk by calculating exact Cash Runway Impact (Months)

Automate line-item diagnostics to instantly flag capital deficits and underutilized funds across all cost centers

Aggregate portfolio-wide OpEx, Blended Corporate Utilization (%), and department-level summaries into a centralized CFO dashboard

Evaluate departmental capital discipline side-by-side to hold managers accountable for line-item overages

Export an immutable, grid-free PDF budget memorandum for executive syncs, board meetings, or investor reporting

CFOs, founders, and FP&A leads managing departmental operating expenses across startups, agencies, and mid-market companies

Department heads needing a transparent, cloud-sharable budget ledger to log monthly actuals and monitor remaining allocations

Companies utilizing a zero-based budgeting (ZBB) approach where every line item requires justification and tracking

Teams looking to replace expensive, recurring financial planning SaaS platforms with an institutional, flat-fee cloud spreadsheet

Enterprise accounting departments requiring real-time, bi-directional API integrations with ERPs or corporate credit card feeds (e.g., Ramp, Brex, NetSuite)

Organizations looking for complex, multi-year three-statement financial forecasting (Refer to the B2B SaaS Financial Model for full multi-year modeling)

Users looking for a standard Microsoft Excel (.xlsx) file workbook (This asset is built natively and exclusively for Google Sheets)


0.0 / 5 (0 votes)

please wait...