Budget vs Actual Model—Driver-Based FP&A Reforecast with Price/Volume/Mix, Rolling Forecast & Scenarios | Excel & Sheets
Originally published: 03/08/2026 13:02
Publication number: ELQ-27995-1
View all versions & Certificate
certified

Budget vs Actual Model—Driver-Based FP&A Reforecast with Price/Volume/Mix, Rolling Forecast & Scenarios | Excel & Sheets

A 17-tab Excel & Google-Sheets FP&A model: driver-based revenue (units × price), three scenarios, a rolling latest estimate, and a price/volume/mix split

Description
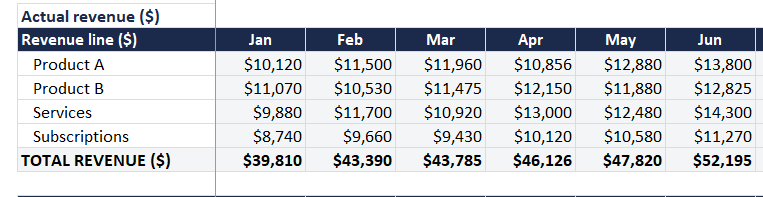
The Annual Budget & Reforecast Model (Advisor edition) is a self-contained, driver-based annual operating model for finance practitioners who need to explain a variance and defend the explanation. Enter your revenue lines as units × price, your cost categories, and each month's actuals as it closes — and the model flexes the entire plan with one scenario switch, produces a rolling full-year latest estimate, decomposes every revenue variance into price, volume and mix, allocates cost across departments, extends three years, stress-tests EBITDA on a two-way grid, and converts the budget P&L to cash. It ships pre-filled with a complete, tied-out worked year.

The differentiator is that the analysis holds up under inspection. The price/volume/mix decomposition is the standard CIMA/ACCA three-way split valued on the turnover basis, and it sums back to the revenue variance exactly — the tab carries its own check column so a reviewer can watch it tie. Comparisons are like-for-like: actuals through the closed months are measured against the budget for those same months. Every figure traces to a blue input and no result is hard-coded, including the sensitivity grid axes; the three fixed constants (the 0.5pp Departments check tolerance, the 30-day DSO/DPO cap and the zero opening receivables and payables) are disclosed on their own tabs. All 829 formulas were independently recomputed in a separate engine, in both editions.

Model Structure — 17 tabs
START HERE · Setup · Scenario Drivers · Revenue Build · Expense Budget · Actuals · Reforecast · Budget vs Actual · Annual Summary · Dashboard · 3-Year Plan · Departments · Sensitivity · Variance Bridge · Cash Bridge · Exec Summary · AI Commentary
(Full tab-by-tab detail as in the Eloquens block above.)

Key Features
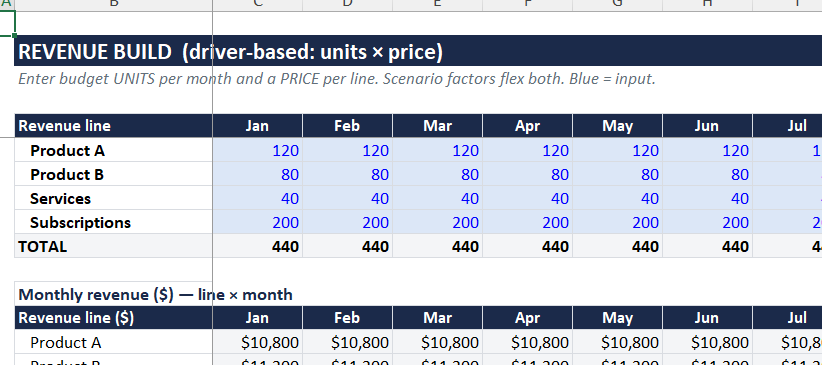
- Driver-based revenue planned from units × price per line, flexed by the active scenario
- Three-scenario engine (Base / Upside / Downside) for volume, price and cost inflation, driven by one cell
- Rolling reforecast: closed months pull actuals, open months keep budget
- Genuine three-way price/volume/mix split (turnover basis), phased and scenario-flexed, with a built-in tie-out check
- Four-department cost-centre allocation with a 100%-allocation guard
- 3-Year Plan, two-way EBITDA sensitivity with live axes, variance waterfall, and a DSO/DPO cash bridge
- Board-ready Exec Summary with a narrative generated from your own figures
- 7 CFO-voice AI prompts with worked sample outputs and a self-updating figure block
- 2-page Methodology PDF: every formula written out, conventions table, how to defend each number
- Arithmetic only — runs unchanged in Excel 2016+ and Google Sheets; no macros, no add-ins
**Worked Example**
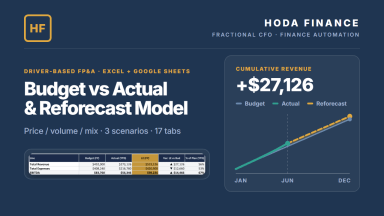
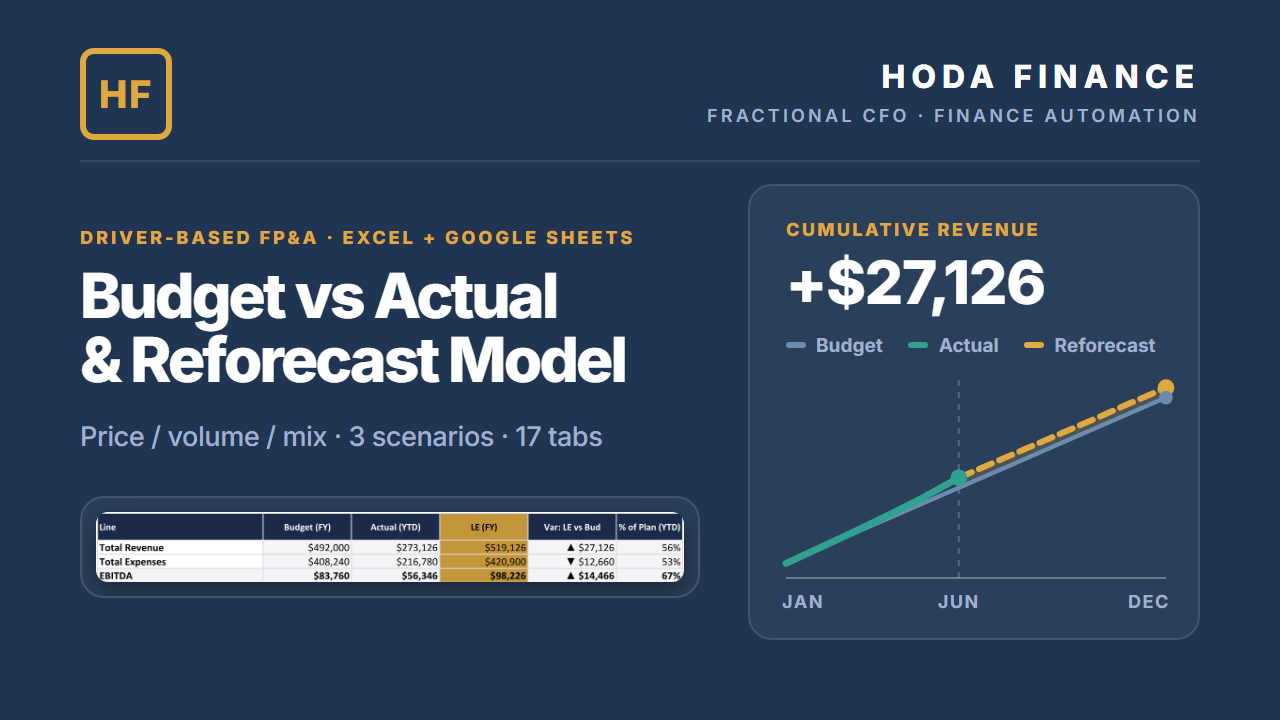
"Acme Studio LLC", month 6 of 12: revenue budget $492,000, actual to date $273,126, latest estimate $519,126 (+$27,126), splitting into price +$3,036, mix +$2,751, volume +$21,339. EBITDA budget $83,760, actual to date $56,346 (20.6% margin). Upside re-prices to $578,592 / $133,924; Downside to $419,971 / $11,669. Cash Bridge: +$72,273 full-year net cash, $122,273 closing, on DSO 25 / DPO 20.

Scope
EBITDA-level planning model: interest, tax and depreciation are not modelled and there is no balance sheet or 3-statement build. Actual COGS is derived at the budget rate, so no separate gross-margin variance appears. Single currency and single entity. The Cash Bridge is a working-capital approximation with zero opening receivables/payables and DSO/DPO capped at 30 days. The variance split is valued at price rather than contribution. Enter actuals only through the month set as "Current month" on Setup — months entered beyond it misstate every year-to-date figure until you advance it; the Actuals tab raises a REVIEW warning when that happens.

Suitable For
Fractional CFOs and finance consultants · FP&A managers and analysts · founders and operators reporting to a board or lender · bookkeepers and accountants extending into budgeting services.

ABOUT THE AUTHOR:

Built by Hoda Elmorshidy — Financial Controller & Fractional CFO, 9+ years in IFRS reporting, FP&A, commodity trading, CFO/board reporting, UAE VAT & Corporate Tax, and finance automation. Also the author of the FP&A Variance & Forecast Toolkit and the CFO Board Reporting System on Eloquens. Practitioner-grade tools, not generic templates.DISCLAIMERThis template is an analytical and educational planning tool, not professional financial, investment, tax, accounting, audit or legal advice, and its use creates no professional relationship.

All assumptions and figures are illustrative — outputs are only as good as your assumptions, and past or sample results are not indicative. Verify every figure before use in any decision. The sample company "Acme Studio LLC" and all of its figures are fictional. AI commentary drafts text from the numbers you provide — verify every figure in the output before sharing it. Liability is limited as set out in the licence terms below.

LICENSE & LIABILITYLICENSE GRANT: Multi-client / commercial licence — use internally and to deliver budgeting and FP&A work for your own clients, including client-branded copies of the outputs. No resale, redistribution, sublicensing or repackaging of the file or its templates as a template. One purchase covers one practitioner.AS IS: Provided "as is" without warranty of any kind, express or implied, including merchantability or fitness for a particular purpose.LIMITATION OF LIABILITY: To the maximum extent permitted by law, total liability for any claim arising from this product is limited to the amount you paid for it. Not liable for indirect, incidental or consequential losses.NON-WAIVABLE RIGHTS: Nothing here limits rights that cannot be excluded under the consumer-protection law of your jurisdiction.GOVERNING LAW: Governed by the terms of the platform you bought it on and by the consumer-protection law of your country of residence. Where those permit, the limitations above apply to the maximum extent allowed.REFUNDS: Digital download — handled per the platform's refund policy for digital/instant-download items.T

RADEMARKS & NON-AFFILIATION: Microsoft Excel and Google Sheets are trademarks of Microsoft Corporation and Google LLC respectively; this product is not affiliated with, endorsed by or sponsored by either. CIMA and ACCA are referenced for methodological attribution only.

This Best Practice includes
Format .xlsx (Excel) + .xlsx (Google Sheets) + .pdf · Excel 2016/2019/2021/365 (Windows & Mac) and Google Sheets · no ma

Acquire business license for $149.00

Add to cart

Add to bookmarks

Discuss

Further information

Build a driver-based annual operating budget you can defend line by line, then keep it live as the year closes.

The model plans revenue from units × price per line rather than as a typed total, flexes the entire plan — revenue, expenses, reforecast, dashboard, sensitivity and the board narrative — from a single scenario cell, and rolls a latest estimate that swaps closed months to actuals while open months stay at plan. Its core objective is to answer why revenue moved, not just that it moved: every revenue variance is decomposed into price, volume and mix on the CIMA turnover basis, phased and scenario-flexed so the comparison is like-for-like, with a check column on the tab that re-derives the total independently and proves the three components sum back to the revenue variance exactly.

Beyond the variance work it allocates cost across four cost centres with a 100%-allocation guard, extends the base year into a three-year plan, stress-tests EBITDA on a two-way volume × cost-inflation grid whose base cell is wired to equal Annual Summary EBITDA in every scenario, converts the accrual budget to cash via DSO/DPO with the reconciliation shown, and produces a board one-pager whose narrative sentence writes itself from your own figures.

17 tabs, 829 live formulas, built from exactly thirteen functions so it runs unchanged in Excel 2016+ and Google Sheets. Ships pre-filled with a complete, tied-out worked year you can study before overwriting.

Best suited to a single operating entity in one currency that sells identifiable product or service lines at a unit price — up to four revenue lines and nine expense categories, on a 12-month fiscal year starting in any month. It fits practitioners who close and reforecast monthly and have to explain a variance to a board, a lender or a client: fractional CFOs and finance consultants running budgets across a client book (the multi-client commercial licence is included), FP&A managers and analysts, founders and operators, and bookkeepers extending into budgeting work. It applies best where units and price are separable in your source data, because that separation is what makes a genuine price/volume/mix decomposition possible — you cannot recover it from a revenue total after the fact. It also suits mixed Excel and Google Sheets environments, teams on older Excel installs, and any setting where macros or add-ins are blocked, since a formula-identical Sheets edition is included and the workbook uses no XLOOKUP, LET, LAMBDA, dynamic arrays or VBA. Cost profiles where COGS behaves as a percentage of revenue and the remaining costs are direct monthly lines will map cleanly; so will businesses on collection and payment terms of roughly a month.

The profit line is EBITDA by construction, so interest, tax and depreciation are not modelled and there is no balance sheet or three-statement build

— add below-the-line items yourself if you need statutory net income. Actual COGS is derived at the budget rate rather than entered, so no separate gross-margin variance appears; under a scenario cost factor other than 1.00 the resulting COGS movement is an artifact of that derivation, not cost performance, and the Actuals tab states this directly. Single entity and single currency only: no consolidation, no FX, no headcount or payroll module. The Cash Bridge is a working-capital approximation, not a treasury forecast

— it opens at zero receivables and payables, applies a single-month lag and caps DSO and DPO at 30 days, so 45- or 60-day terms need to be modelled separately. The variance split is valued at budgeted price (turnover basis), which is what makes it tie back to the revenue variance exactly; a contribution-basis bridge answers a different question and is not included. Structural limits are four revenue lines, nine expense categories, four cost centres and one budget year with an optional three-year extension. One operating rule matters: enter actuals only through the month set as Current month on Setup

— months keyed beyond it misstate every year-to-date figure until you advance it, which is why the Actuals tab raises a REVIEW warning exactly when that happens. If your general ledger gives you only a revenue total for a line, you can still use the decomposition by backing into a units-weighted average price, but a simple average will distort the split.


0.0 / 5 (0 votes)

please wait...