Originally published: 20/06/2016 14:00
Publication number: ELQ-91661-1
View all versions & Certificate
Publication number: ELQ-91661-1
View all versions & Certificate

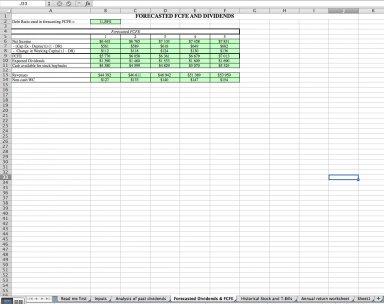
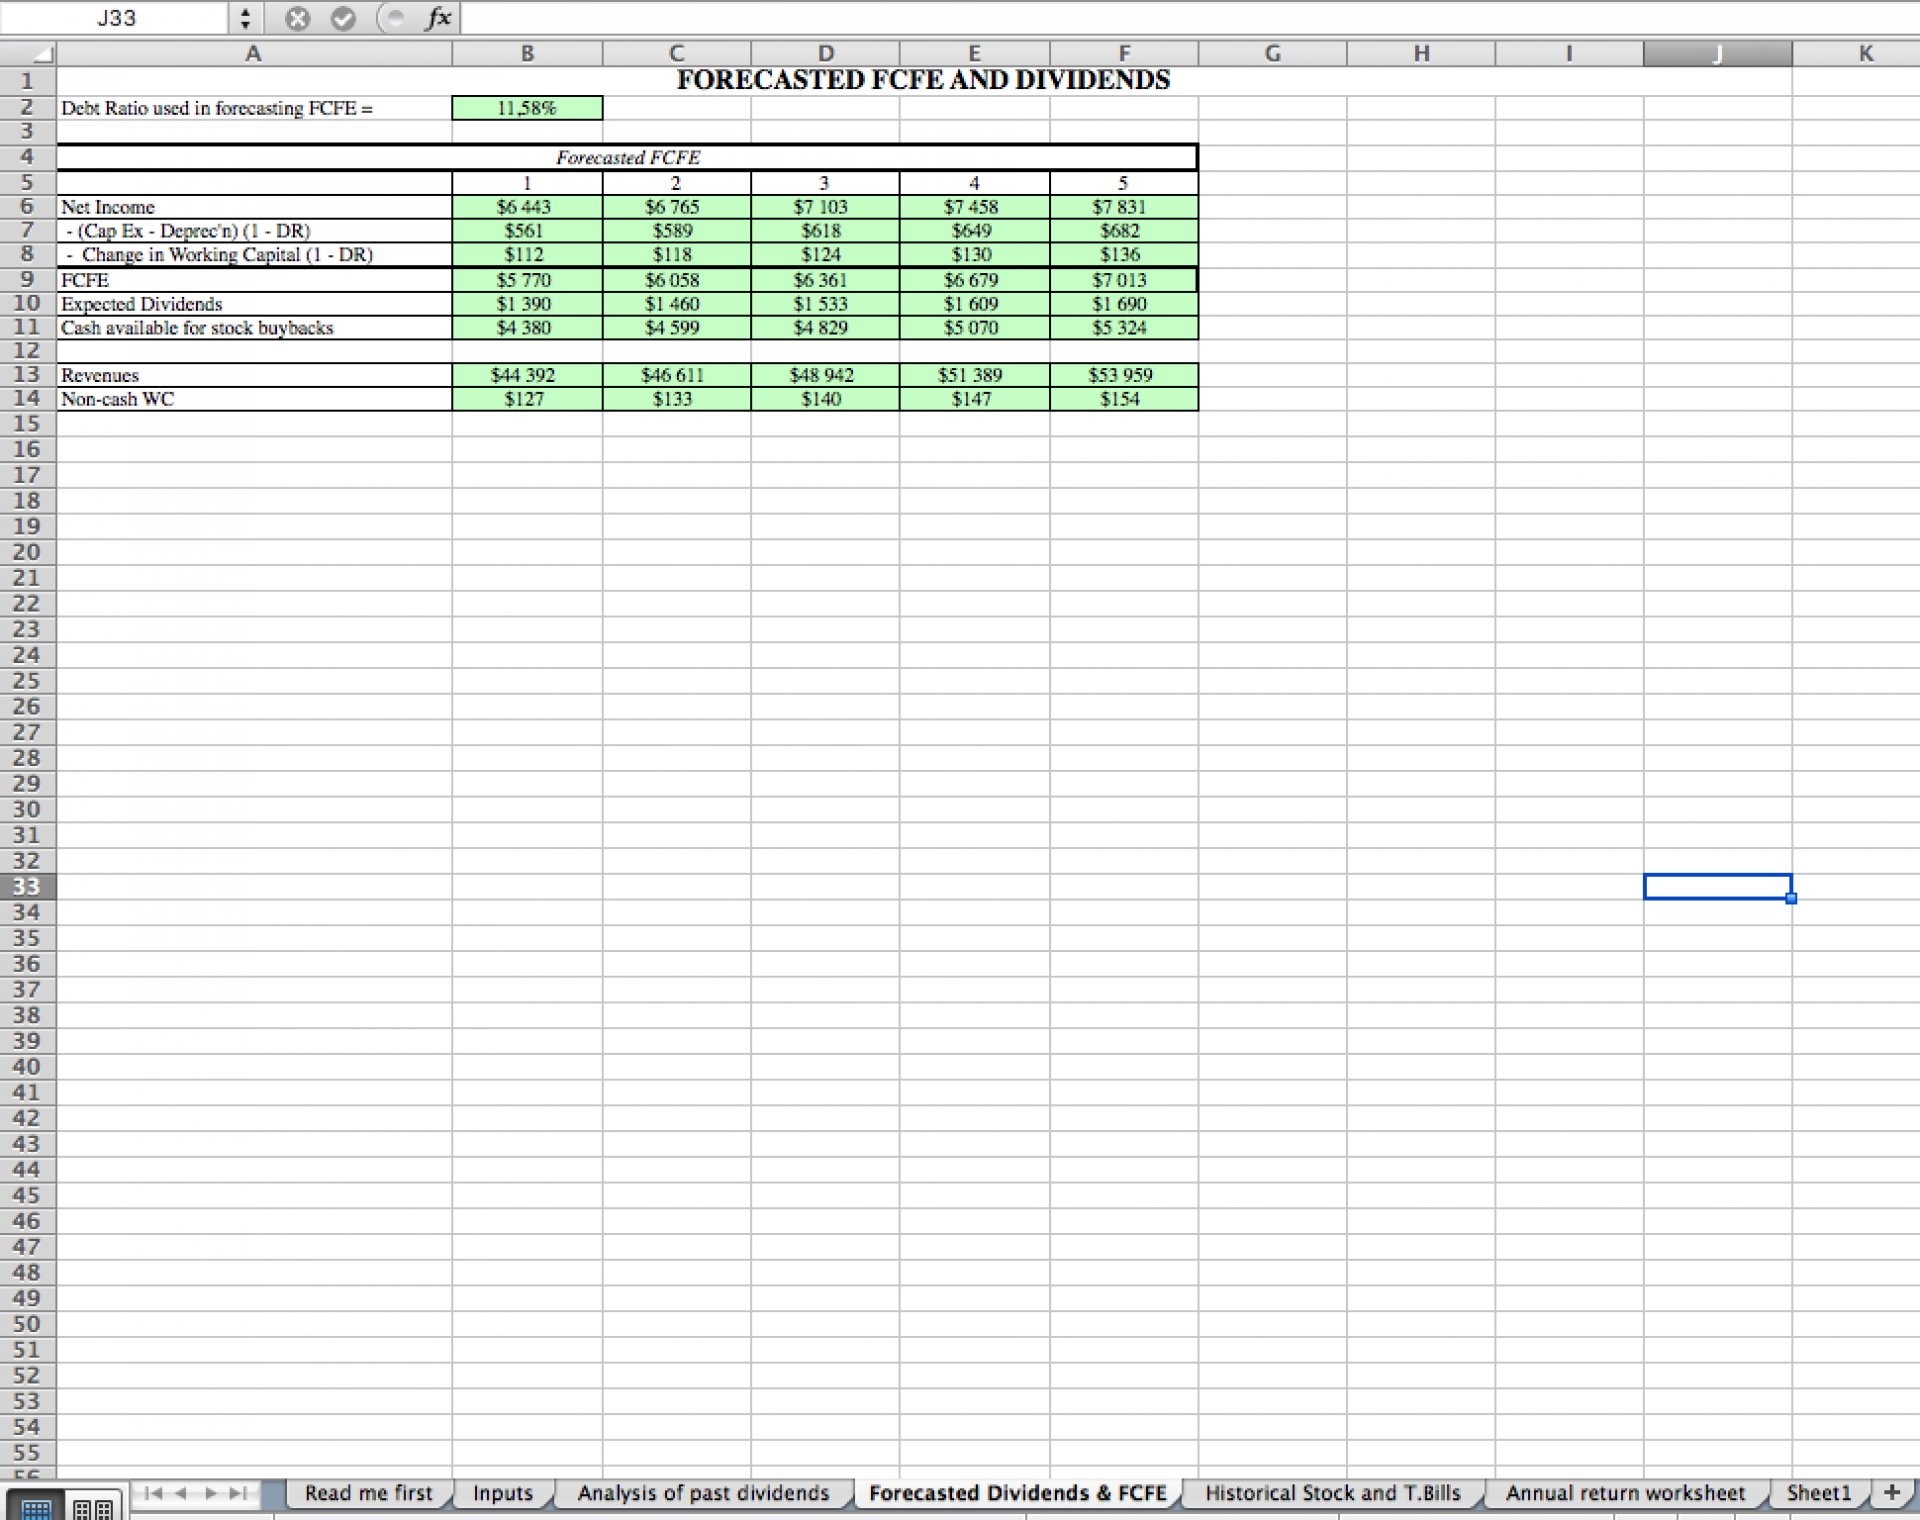
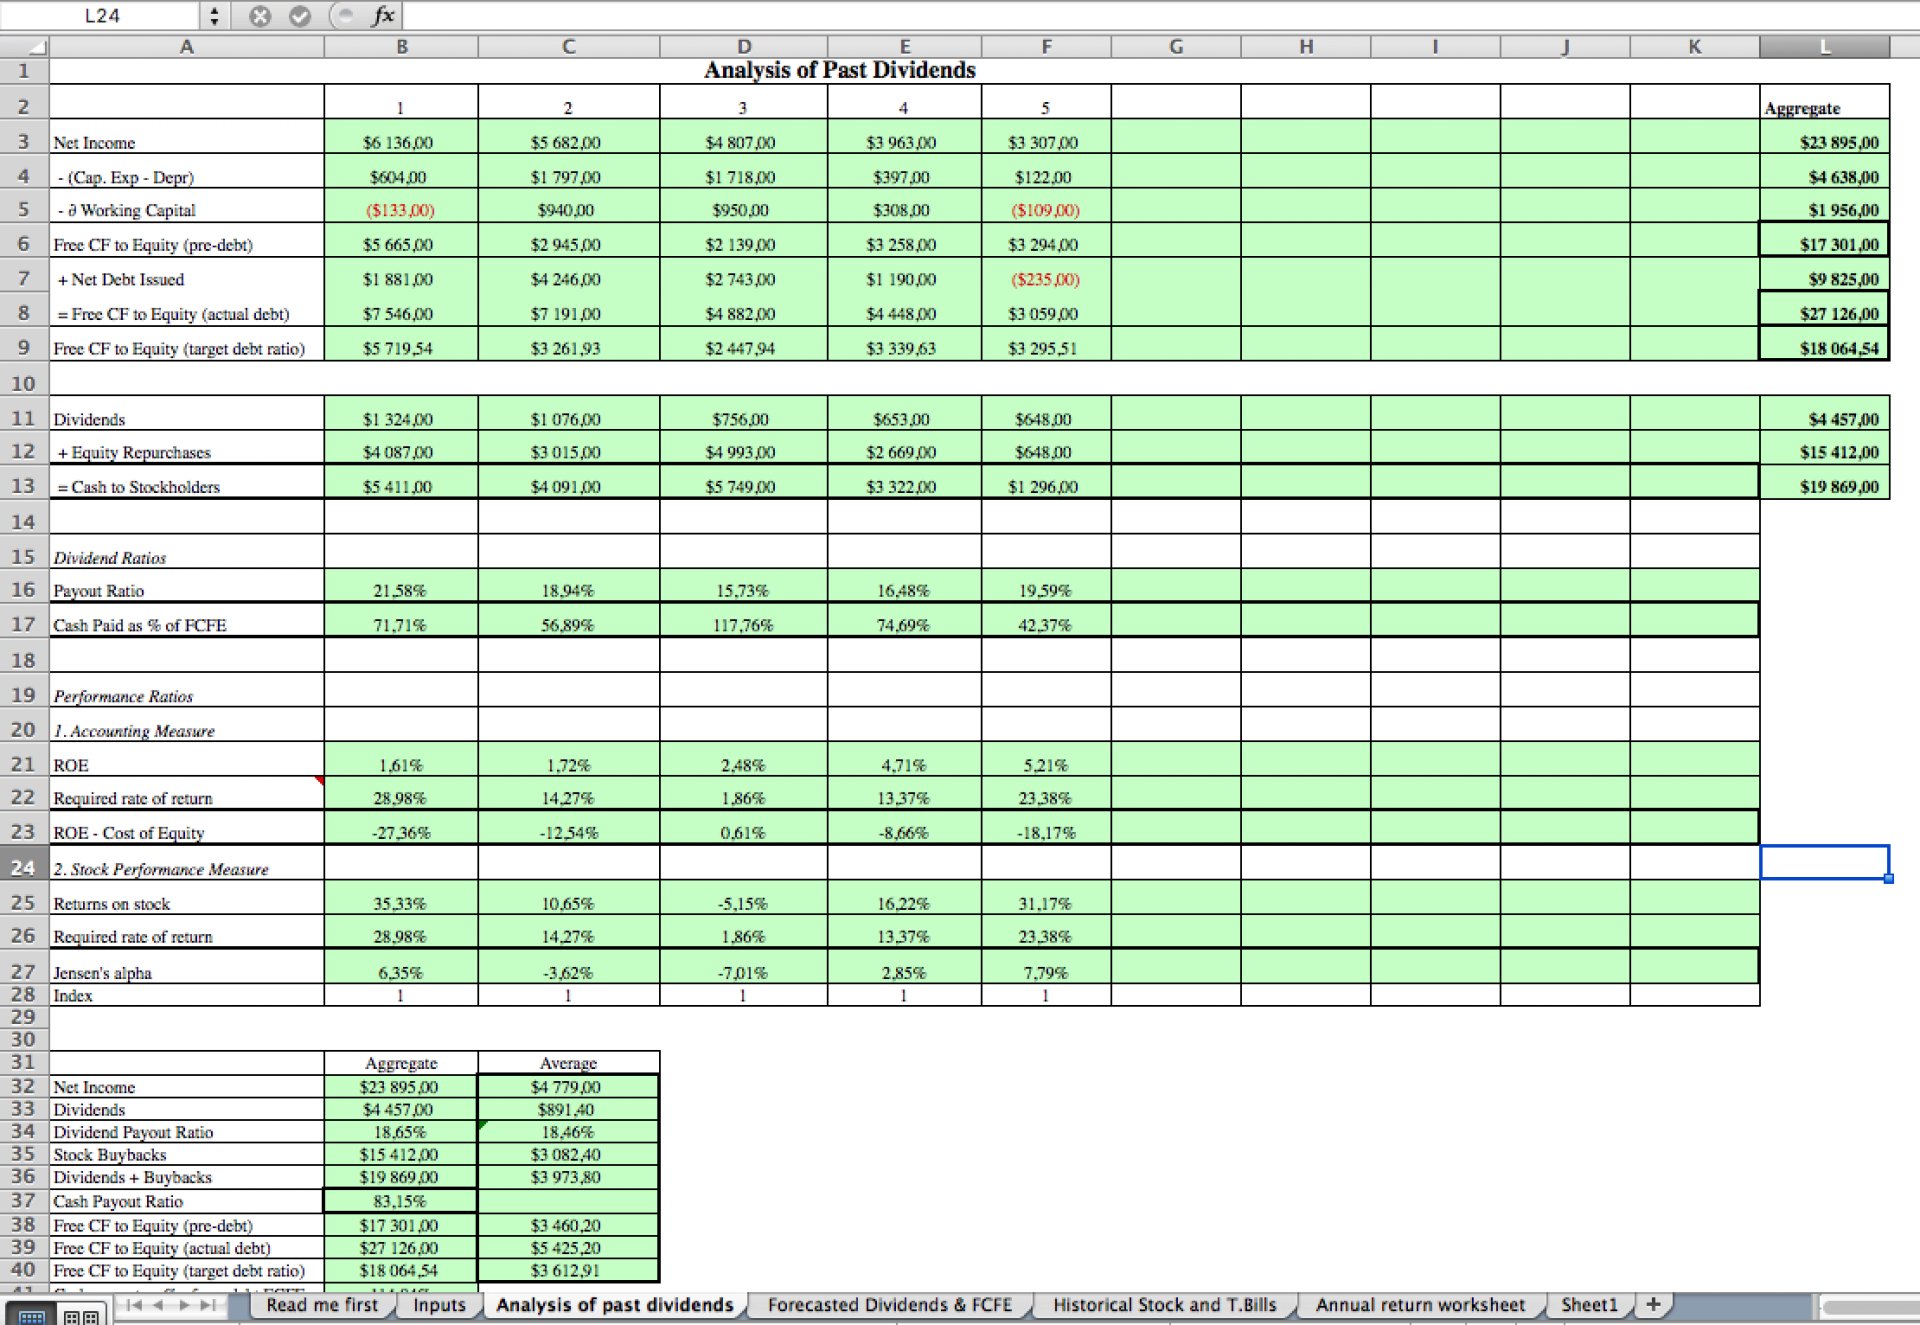
Actual vs Potential Dividends
Compares the dividends paid to what a firm could have paid, by estimating the free cash flow to equity
Prof. Aswath Damodaran offers you this Best Practice for free!
download for free
Add to bookmarks
Further information
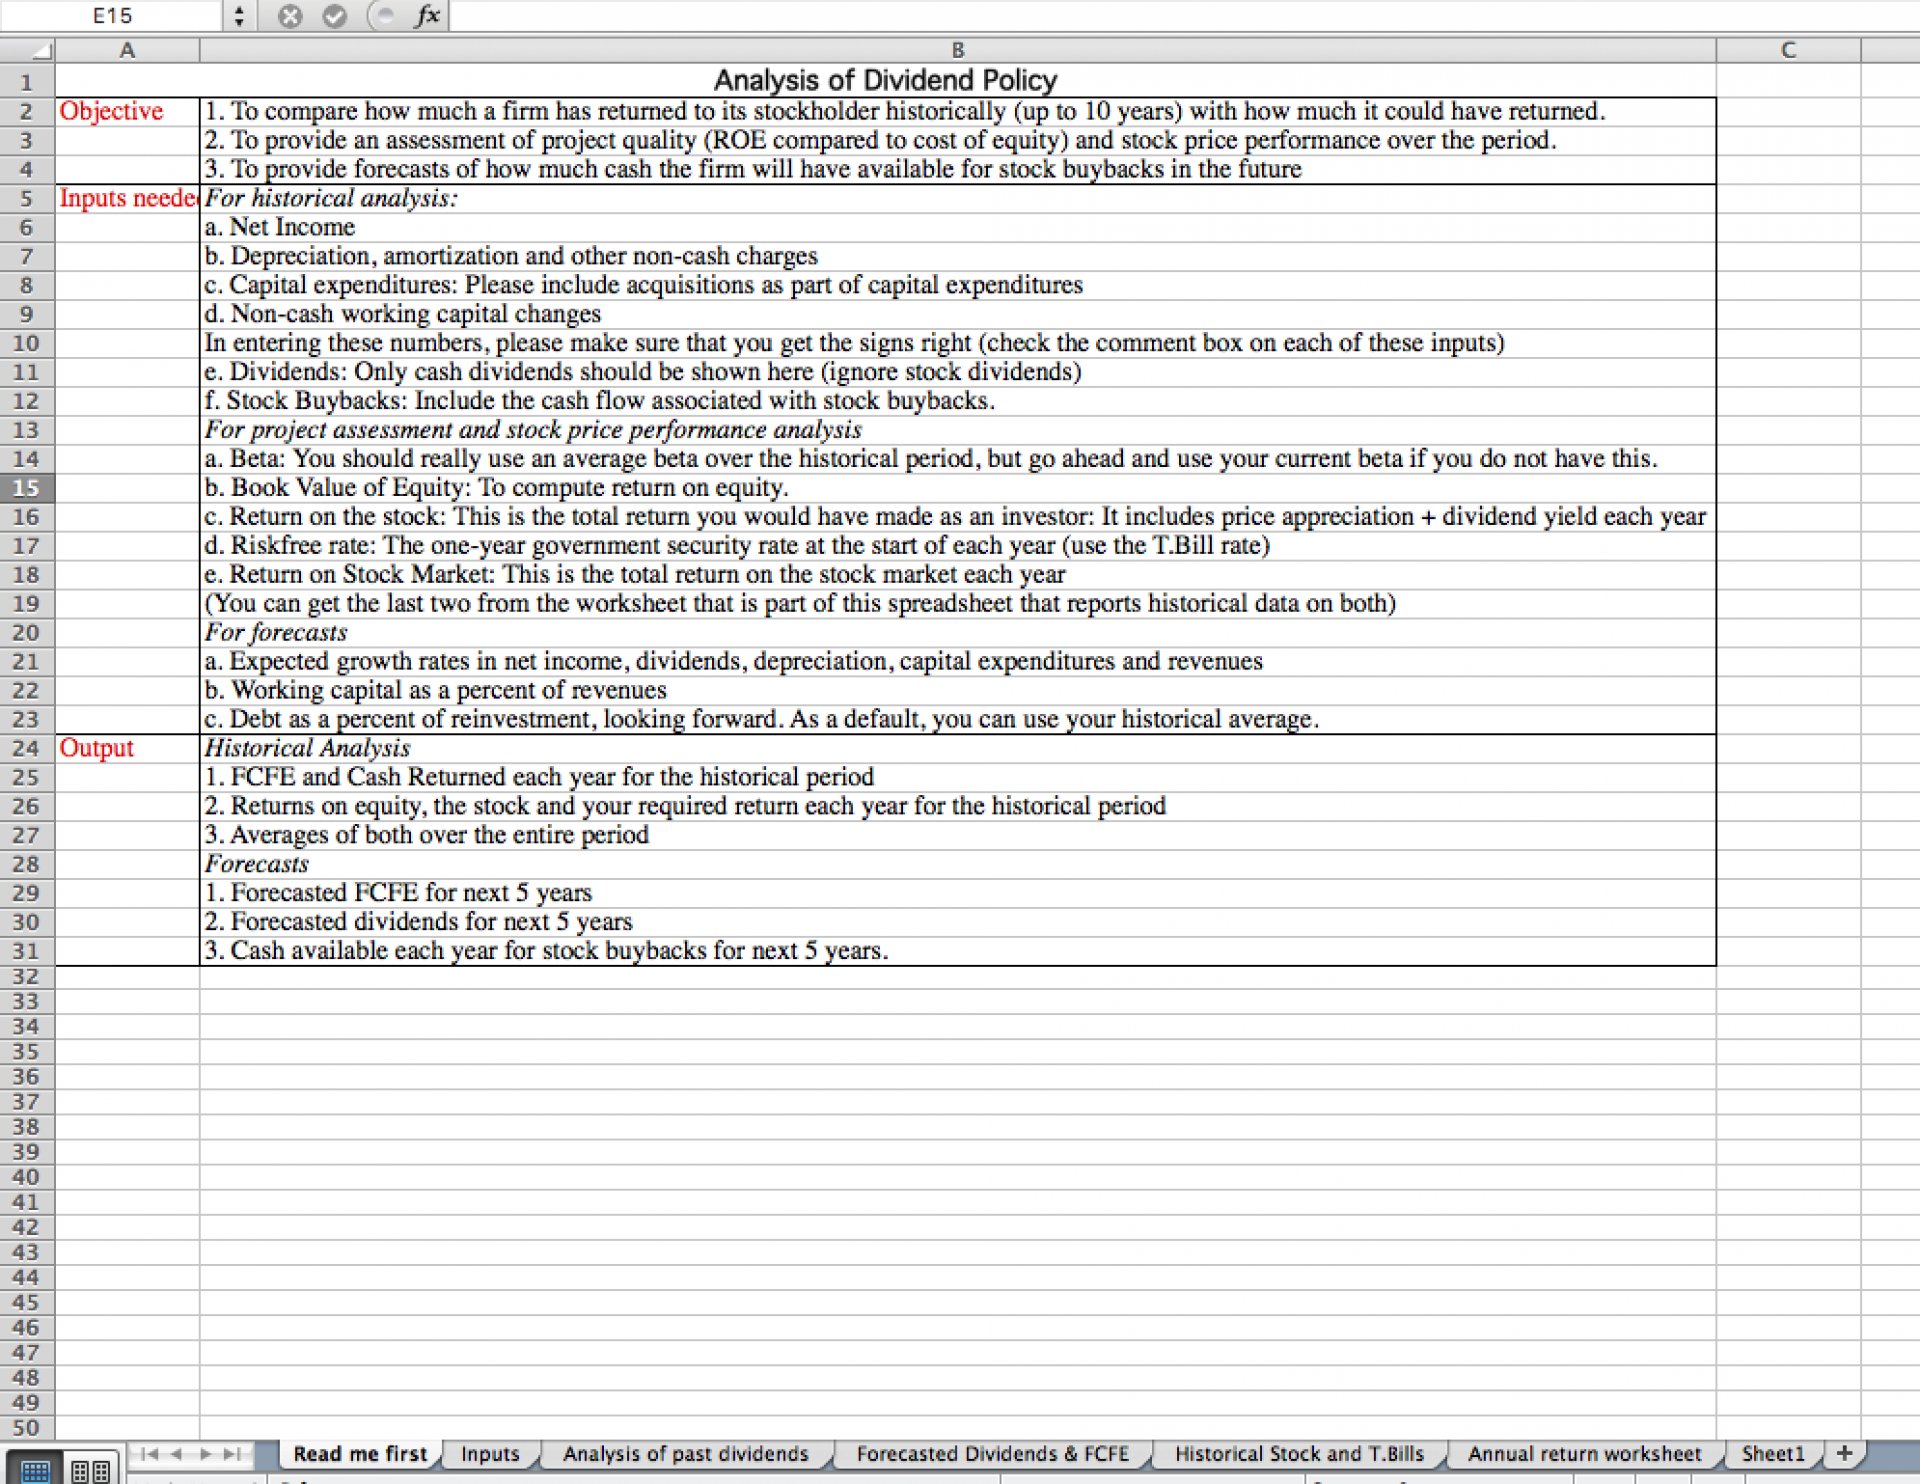
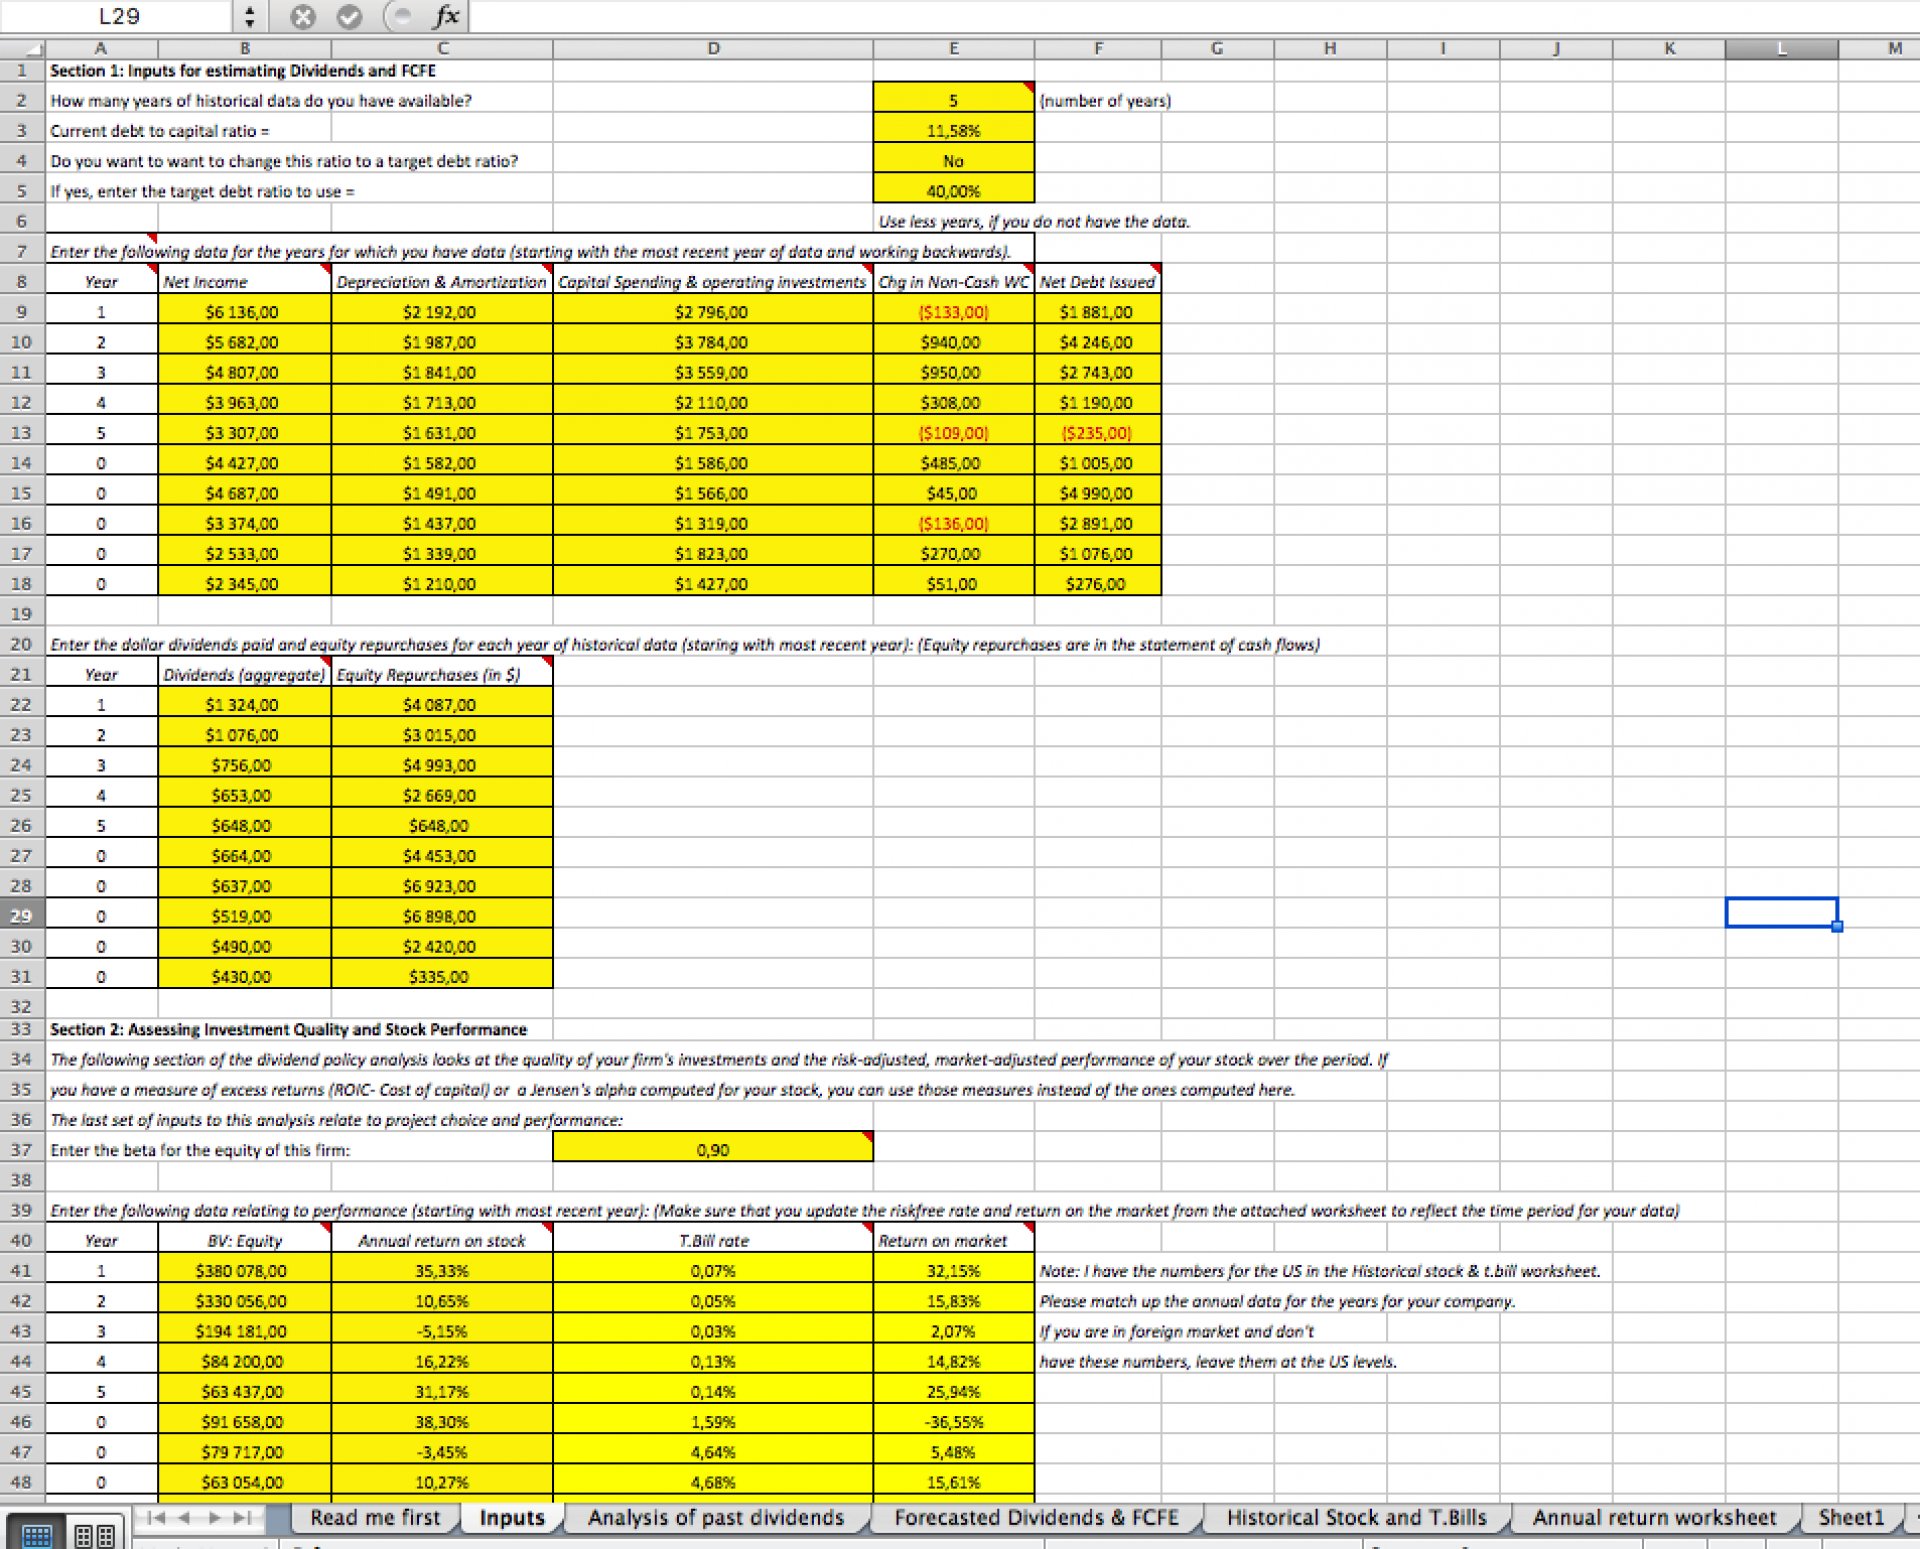
The objective of this model is to get the following output values:
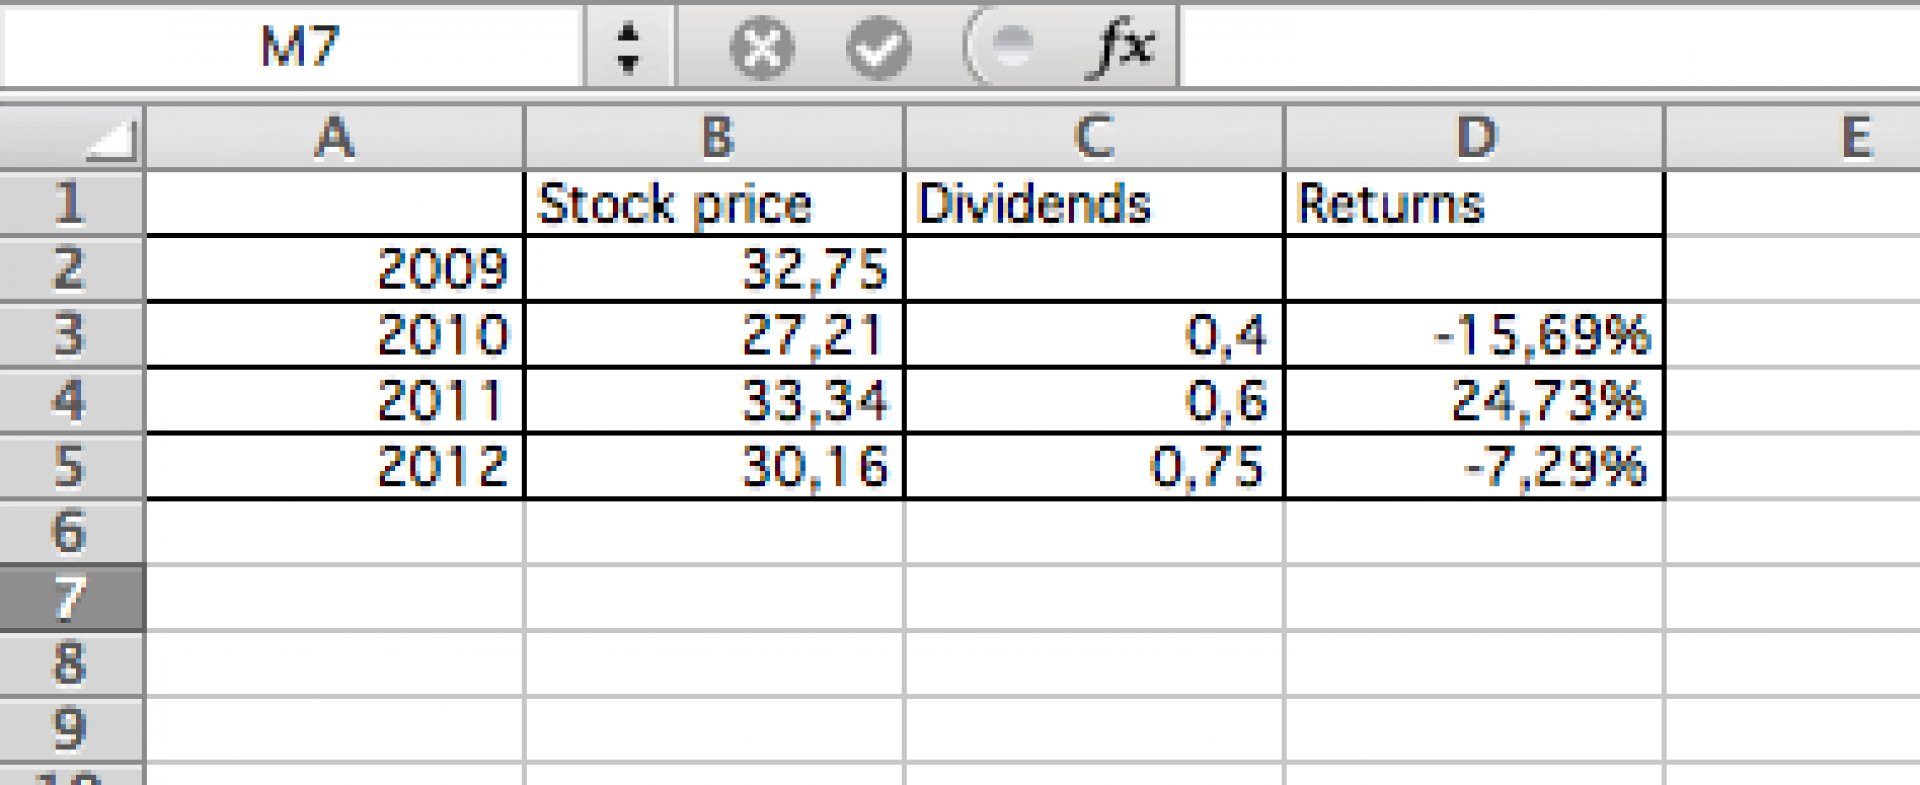
Historical Analysis
1. FCFE and Cash Returned each year for the historical period
2. Returns on equity, the stock and your required return each year for the historical period
3. Averages of both over the entire period
Forecasts
1. Forecasted FCFE for next 5 years
2. Forecasted dividends for next 5 years
3. Cash available each year for stock buybacks for next 5 years.
