

Last version published: 29/04/2026 19:08
Publication number: ELQ-87386-4
View all versions & Certificate

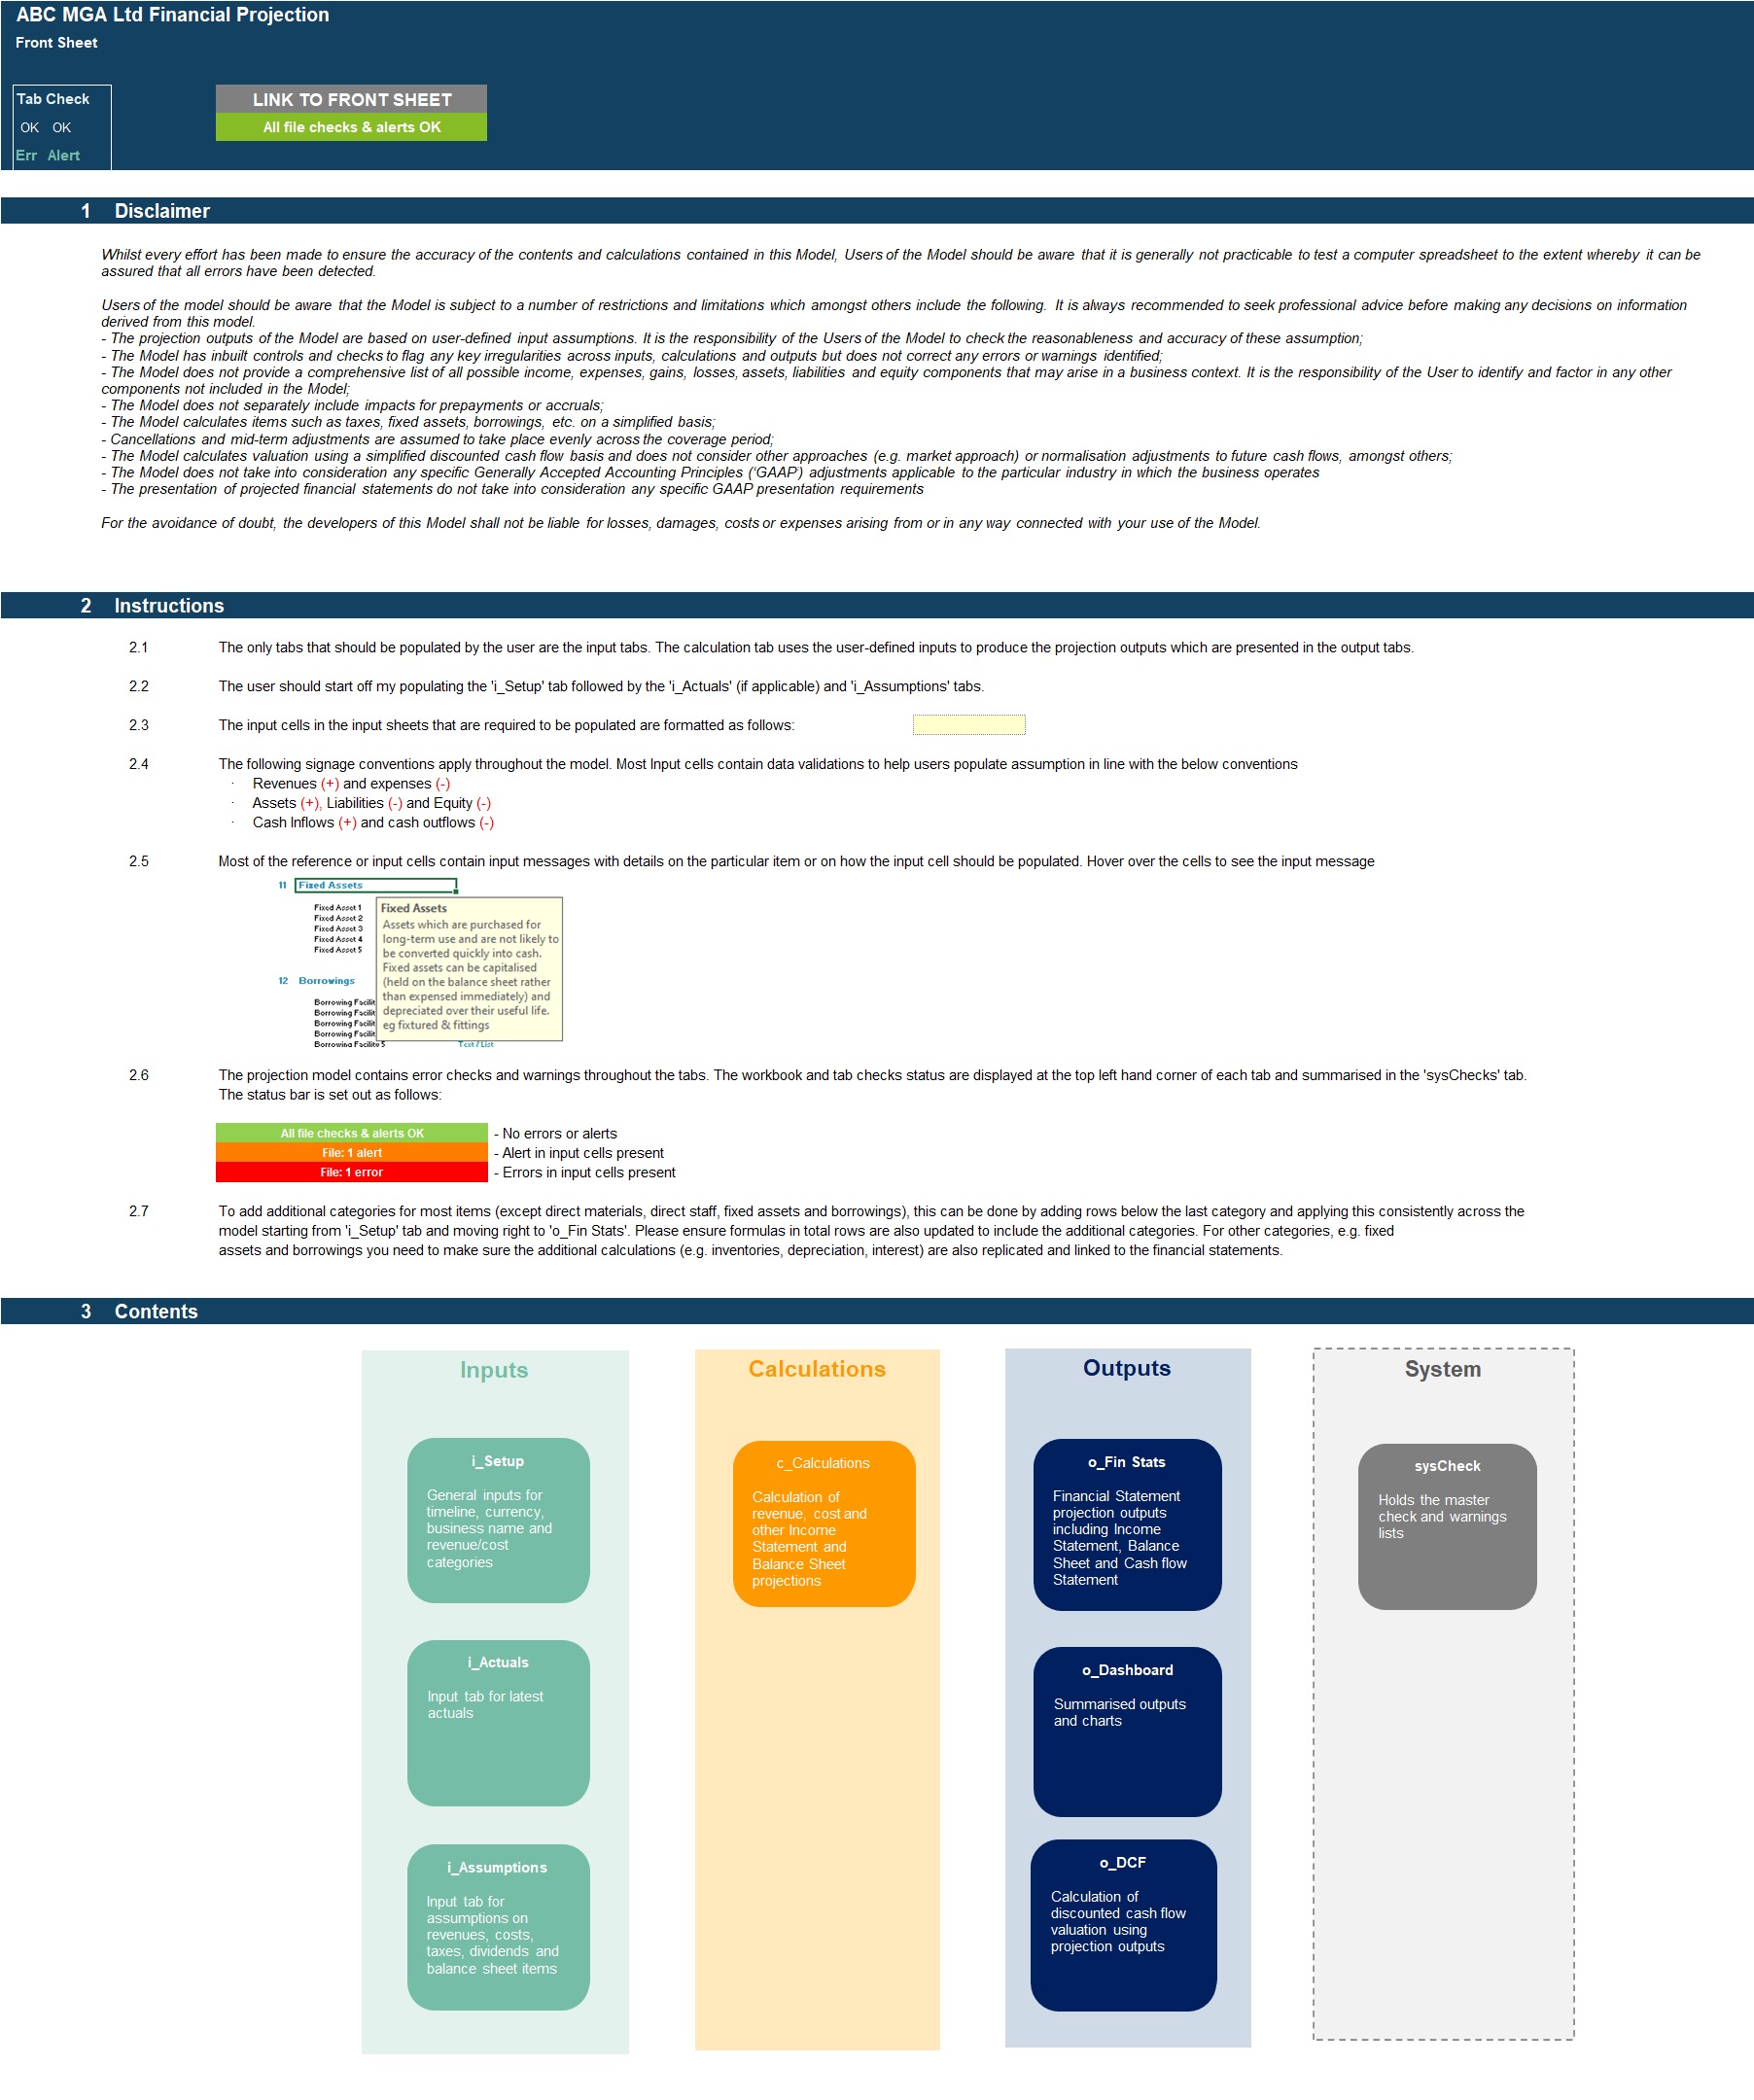
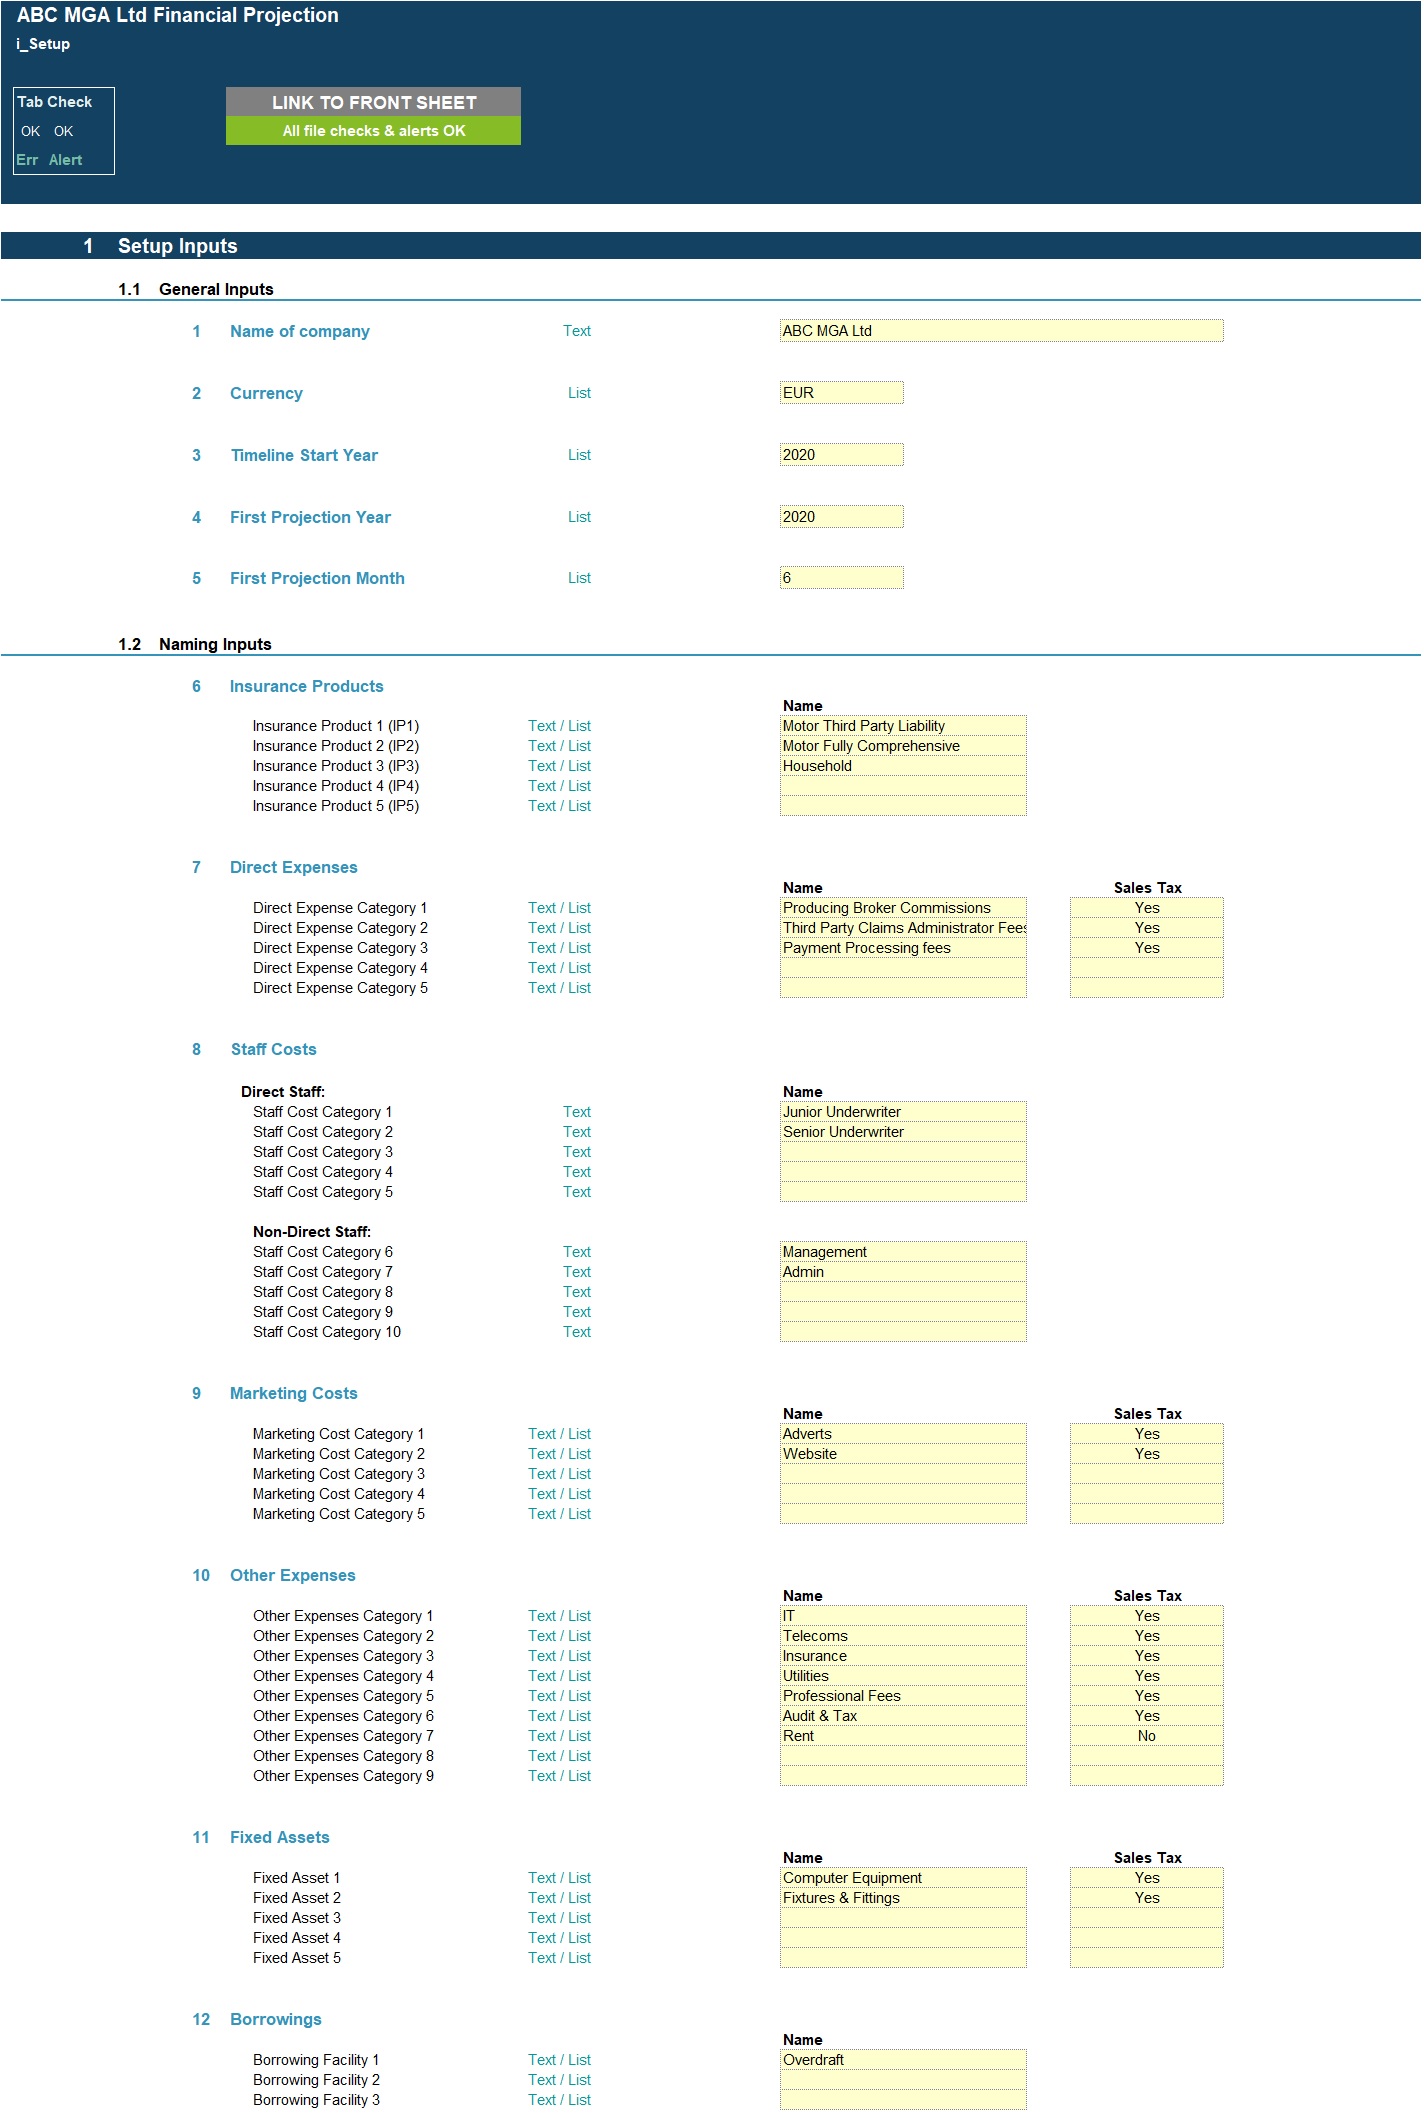
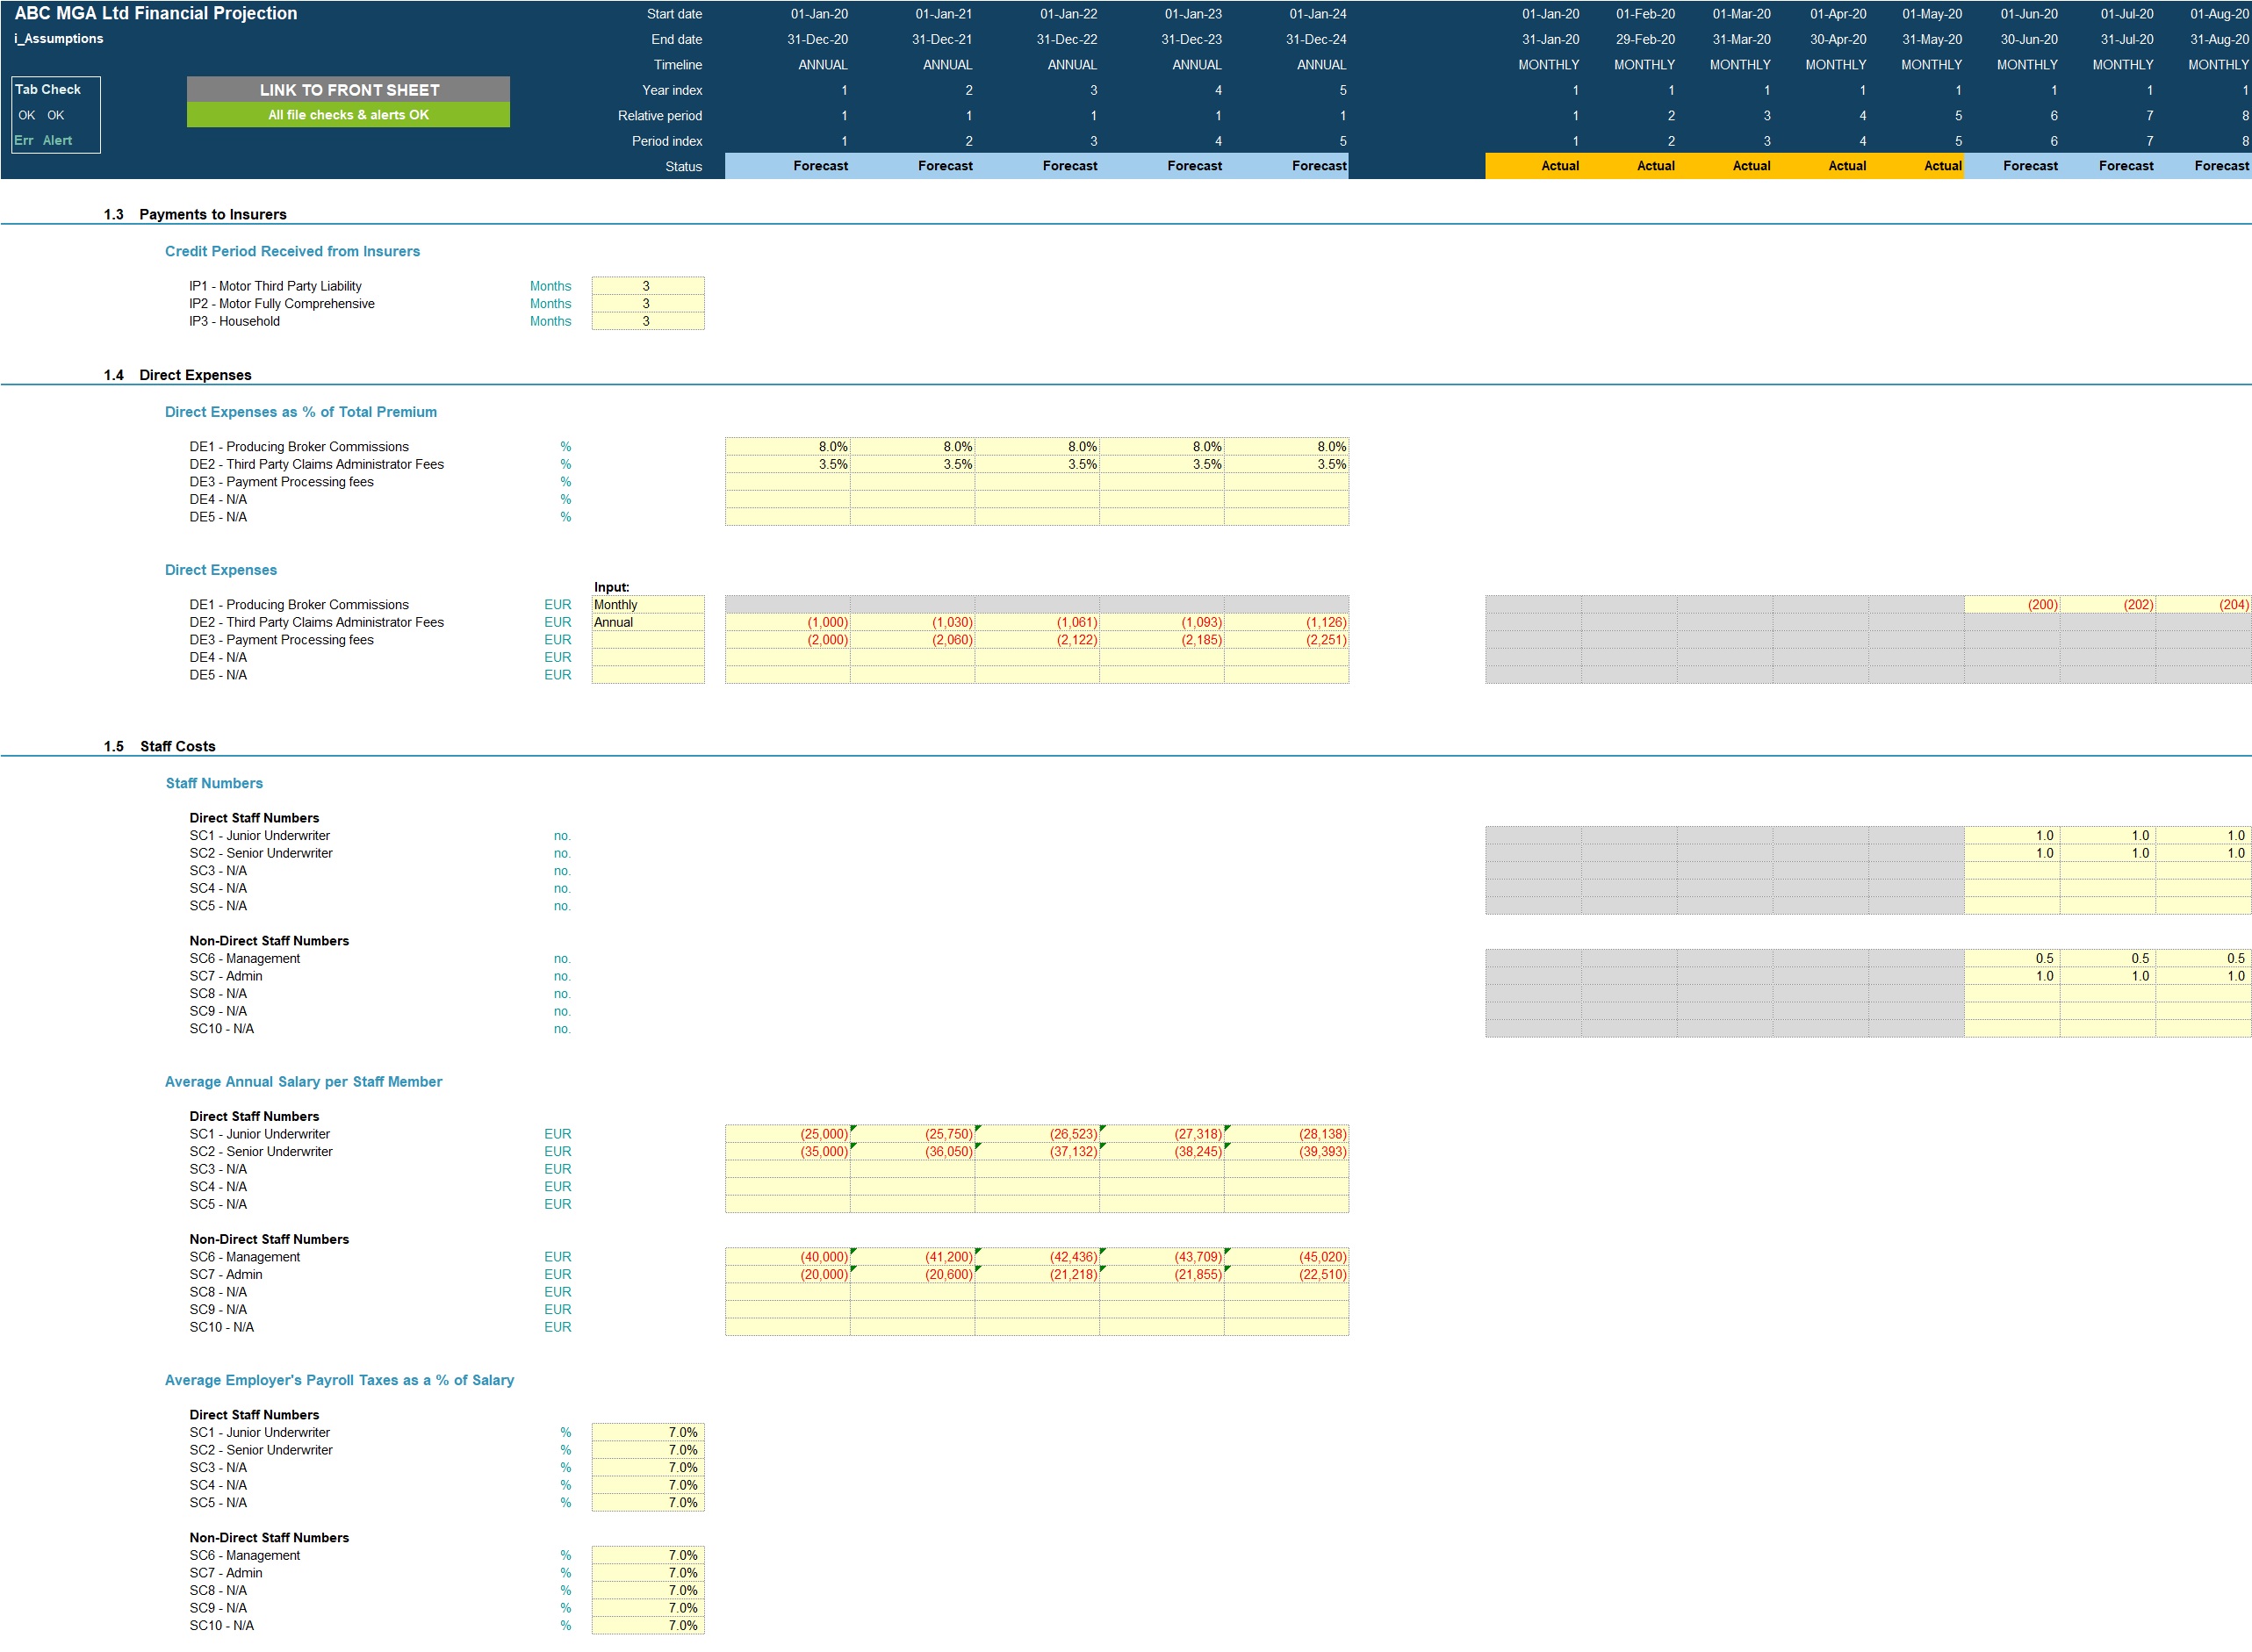
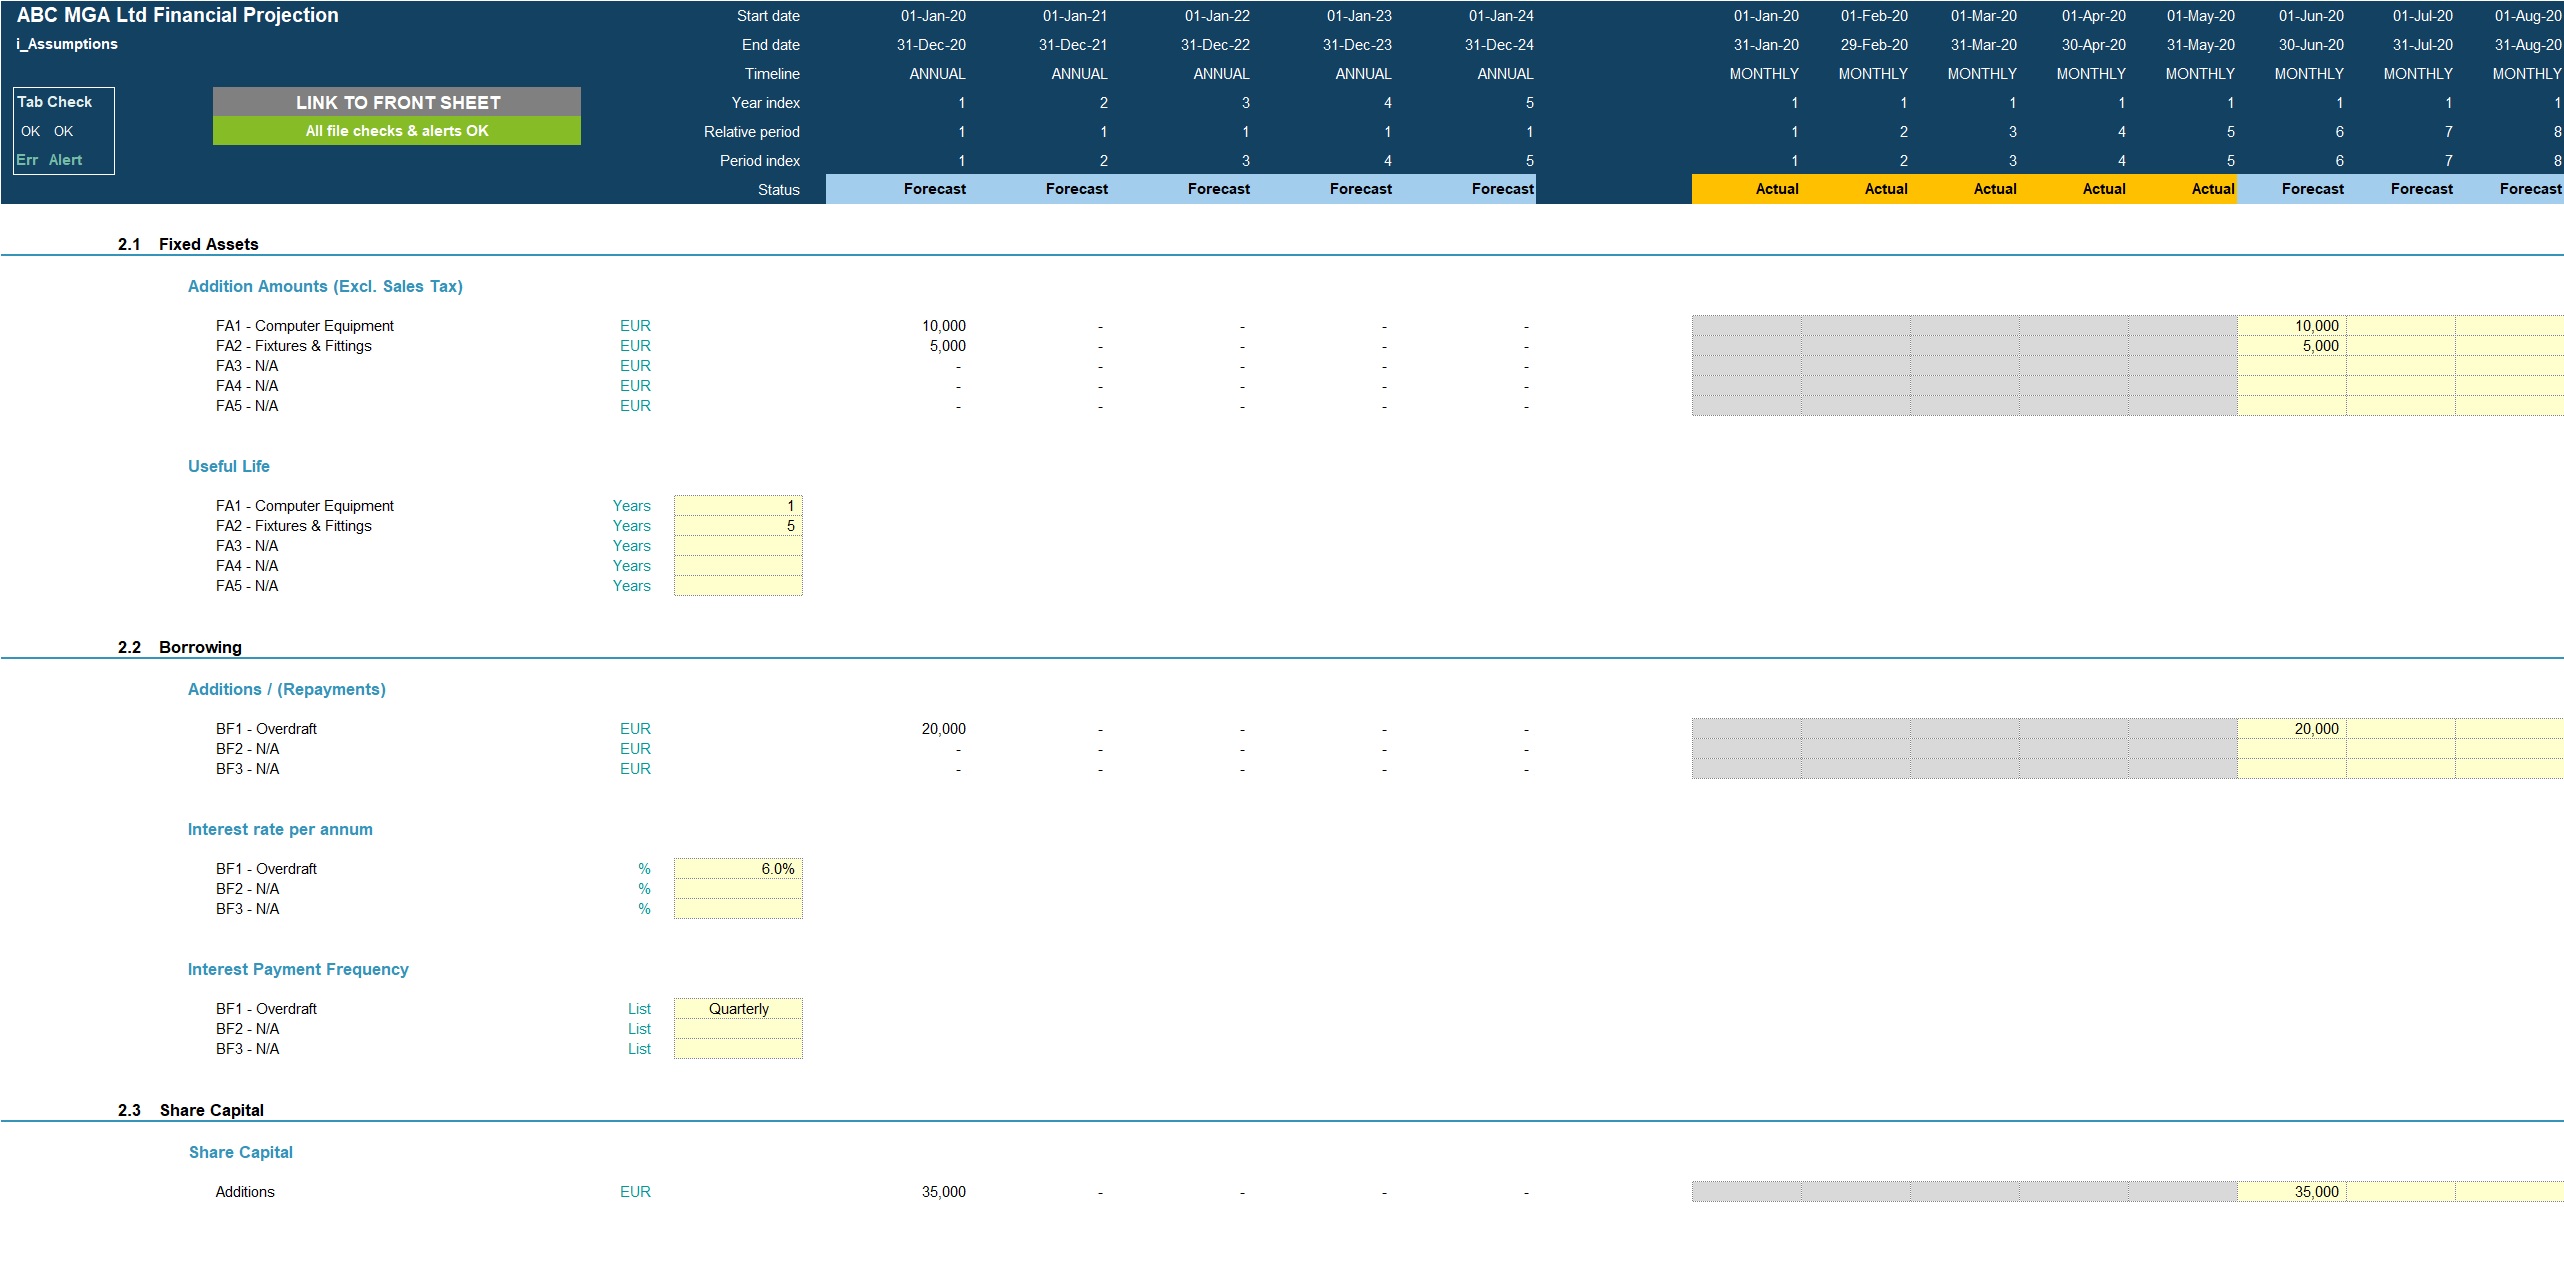
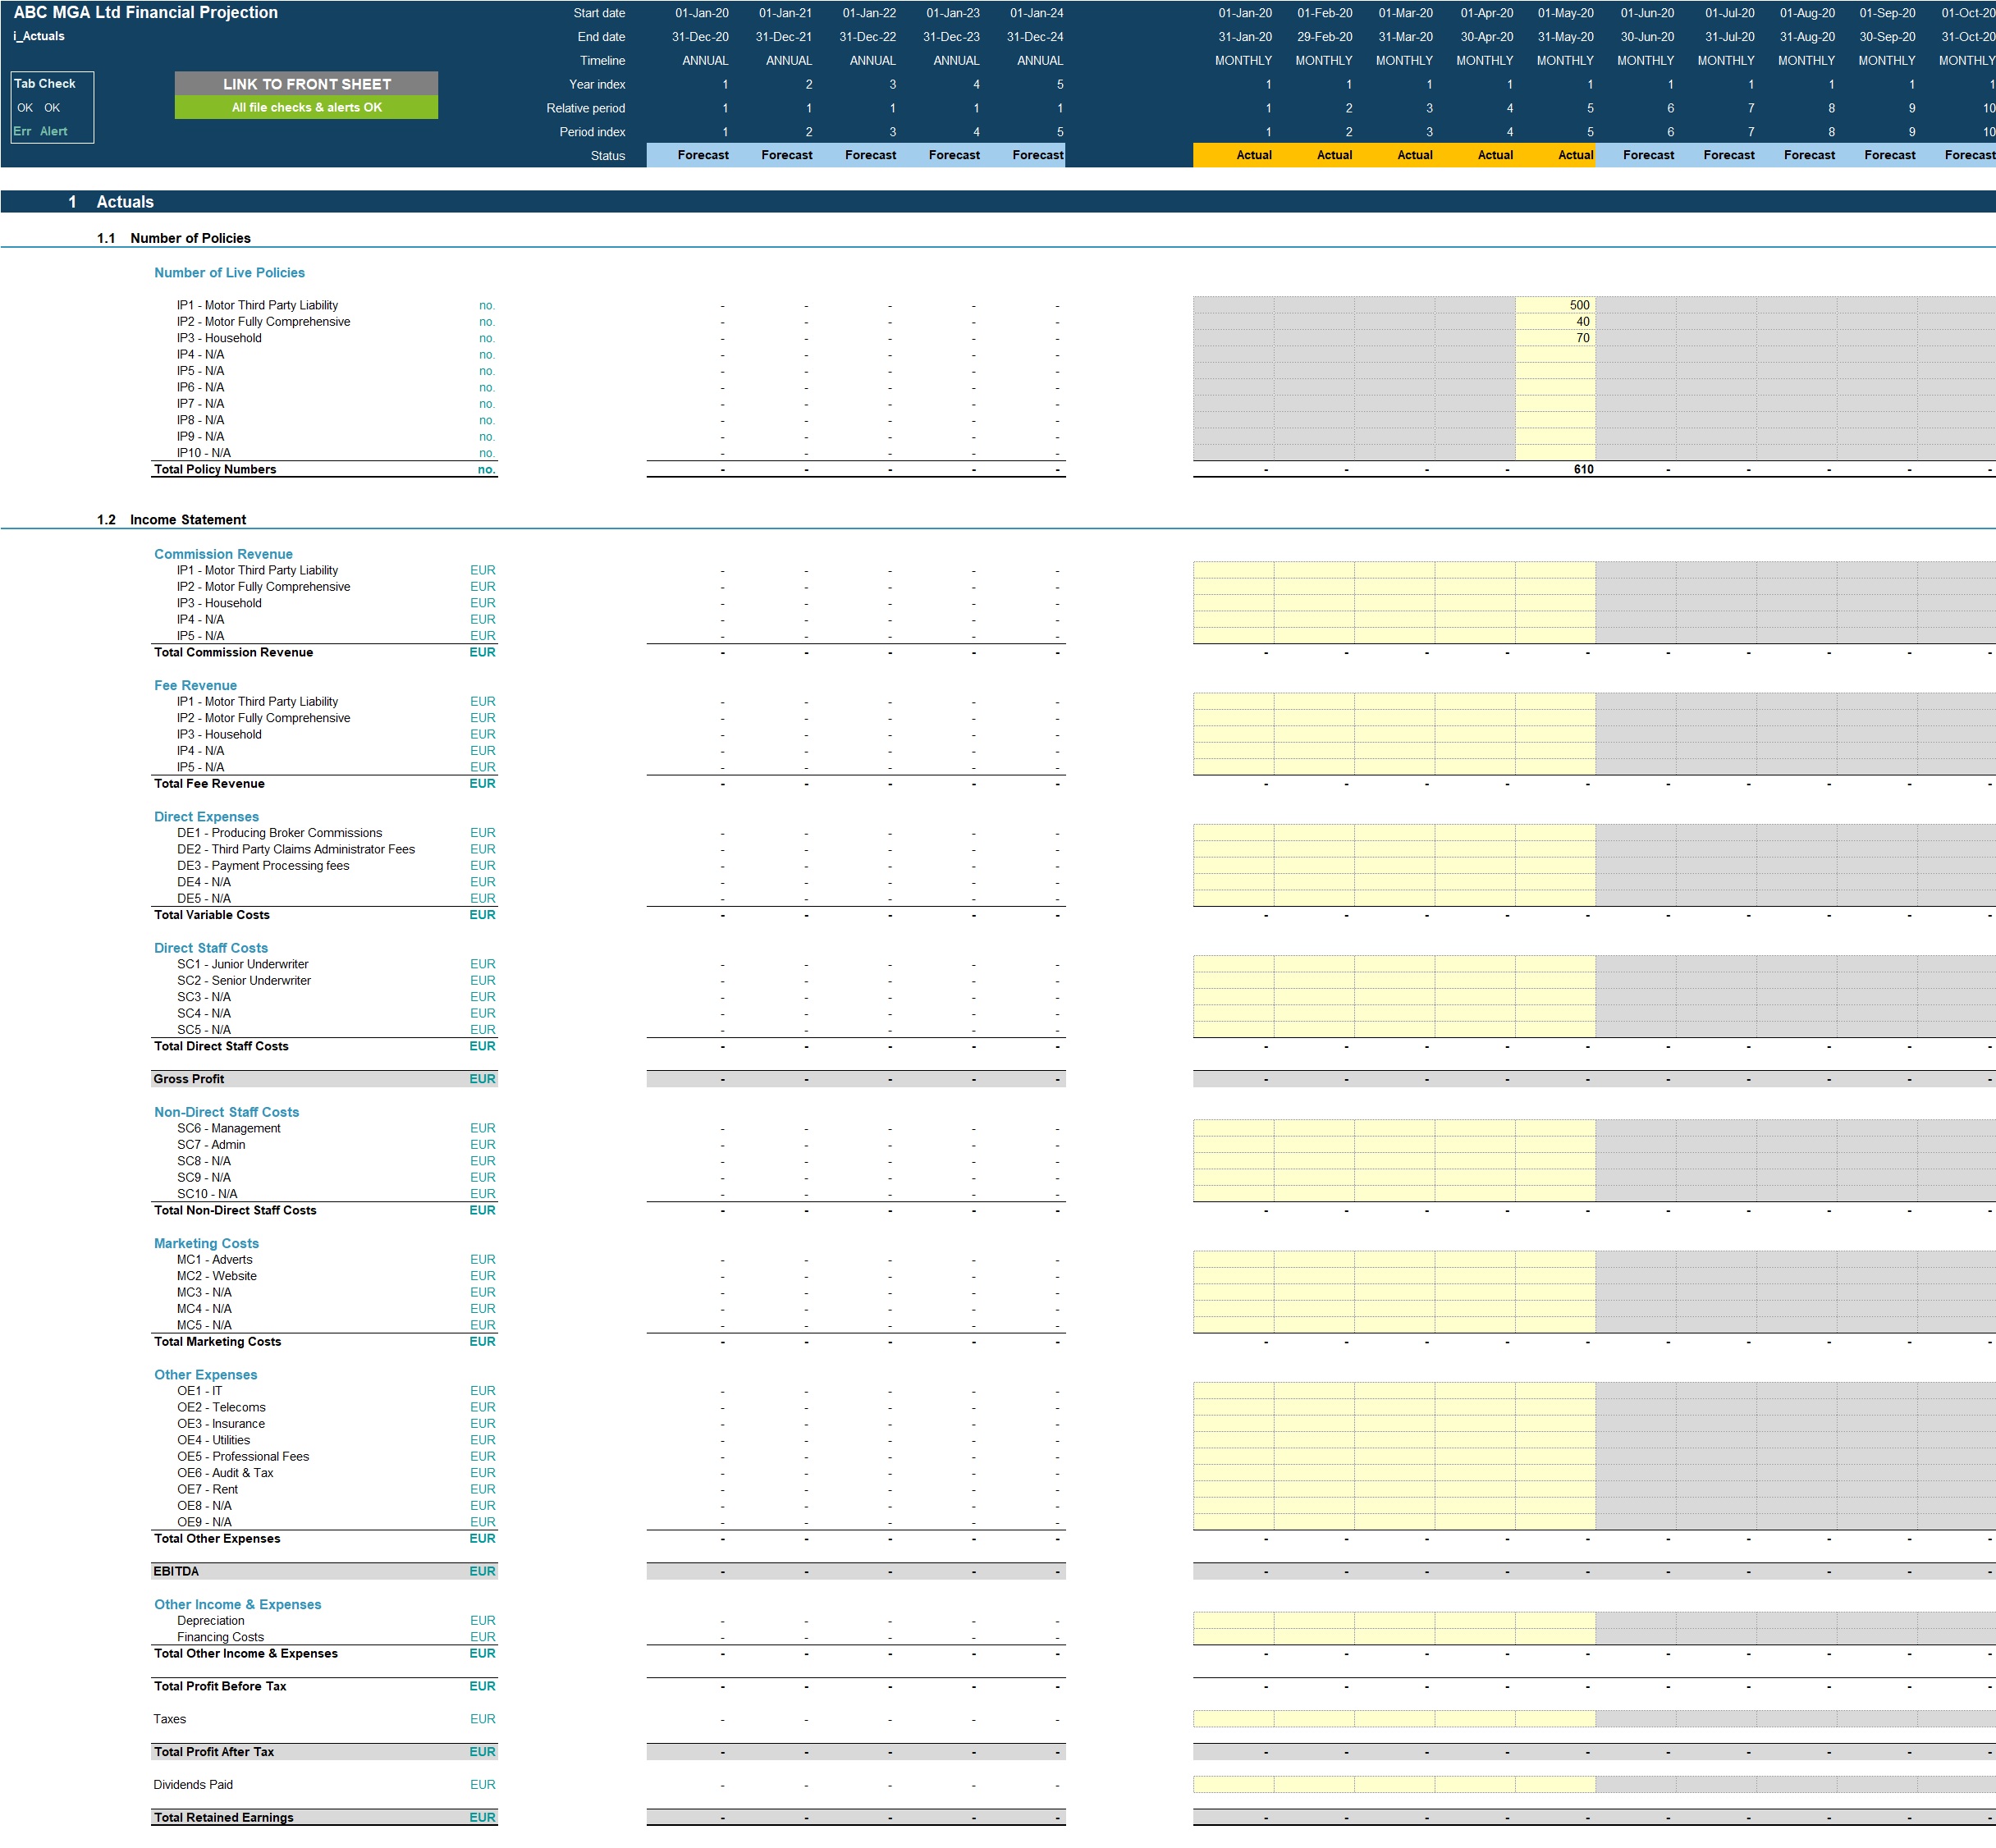
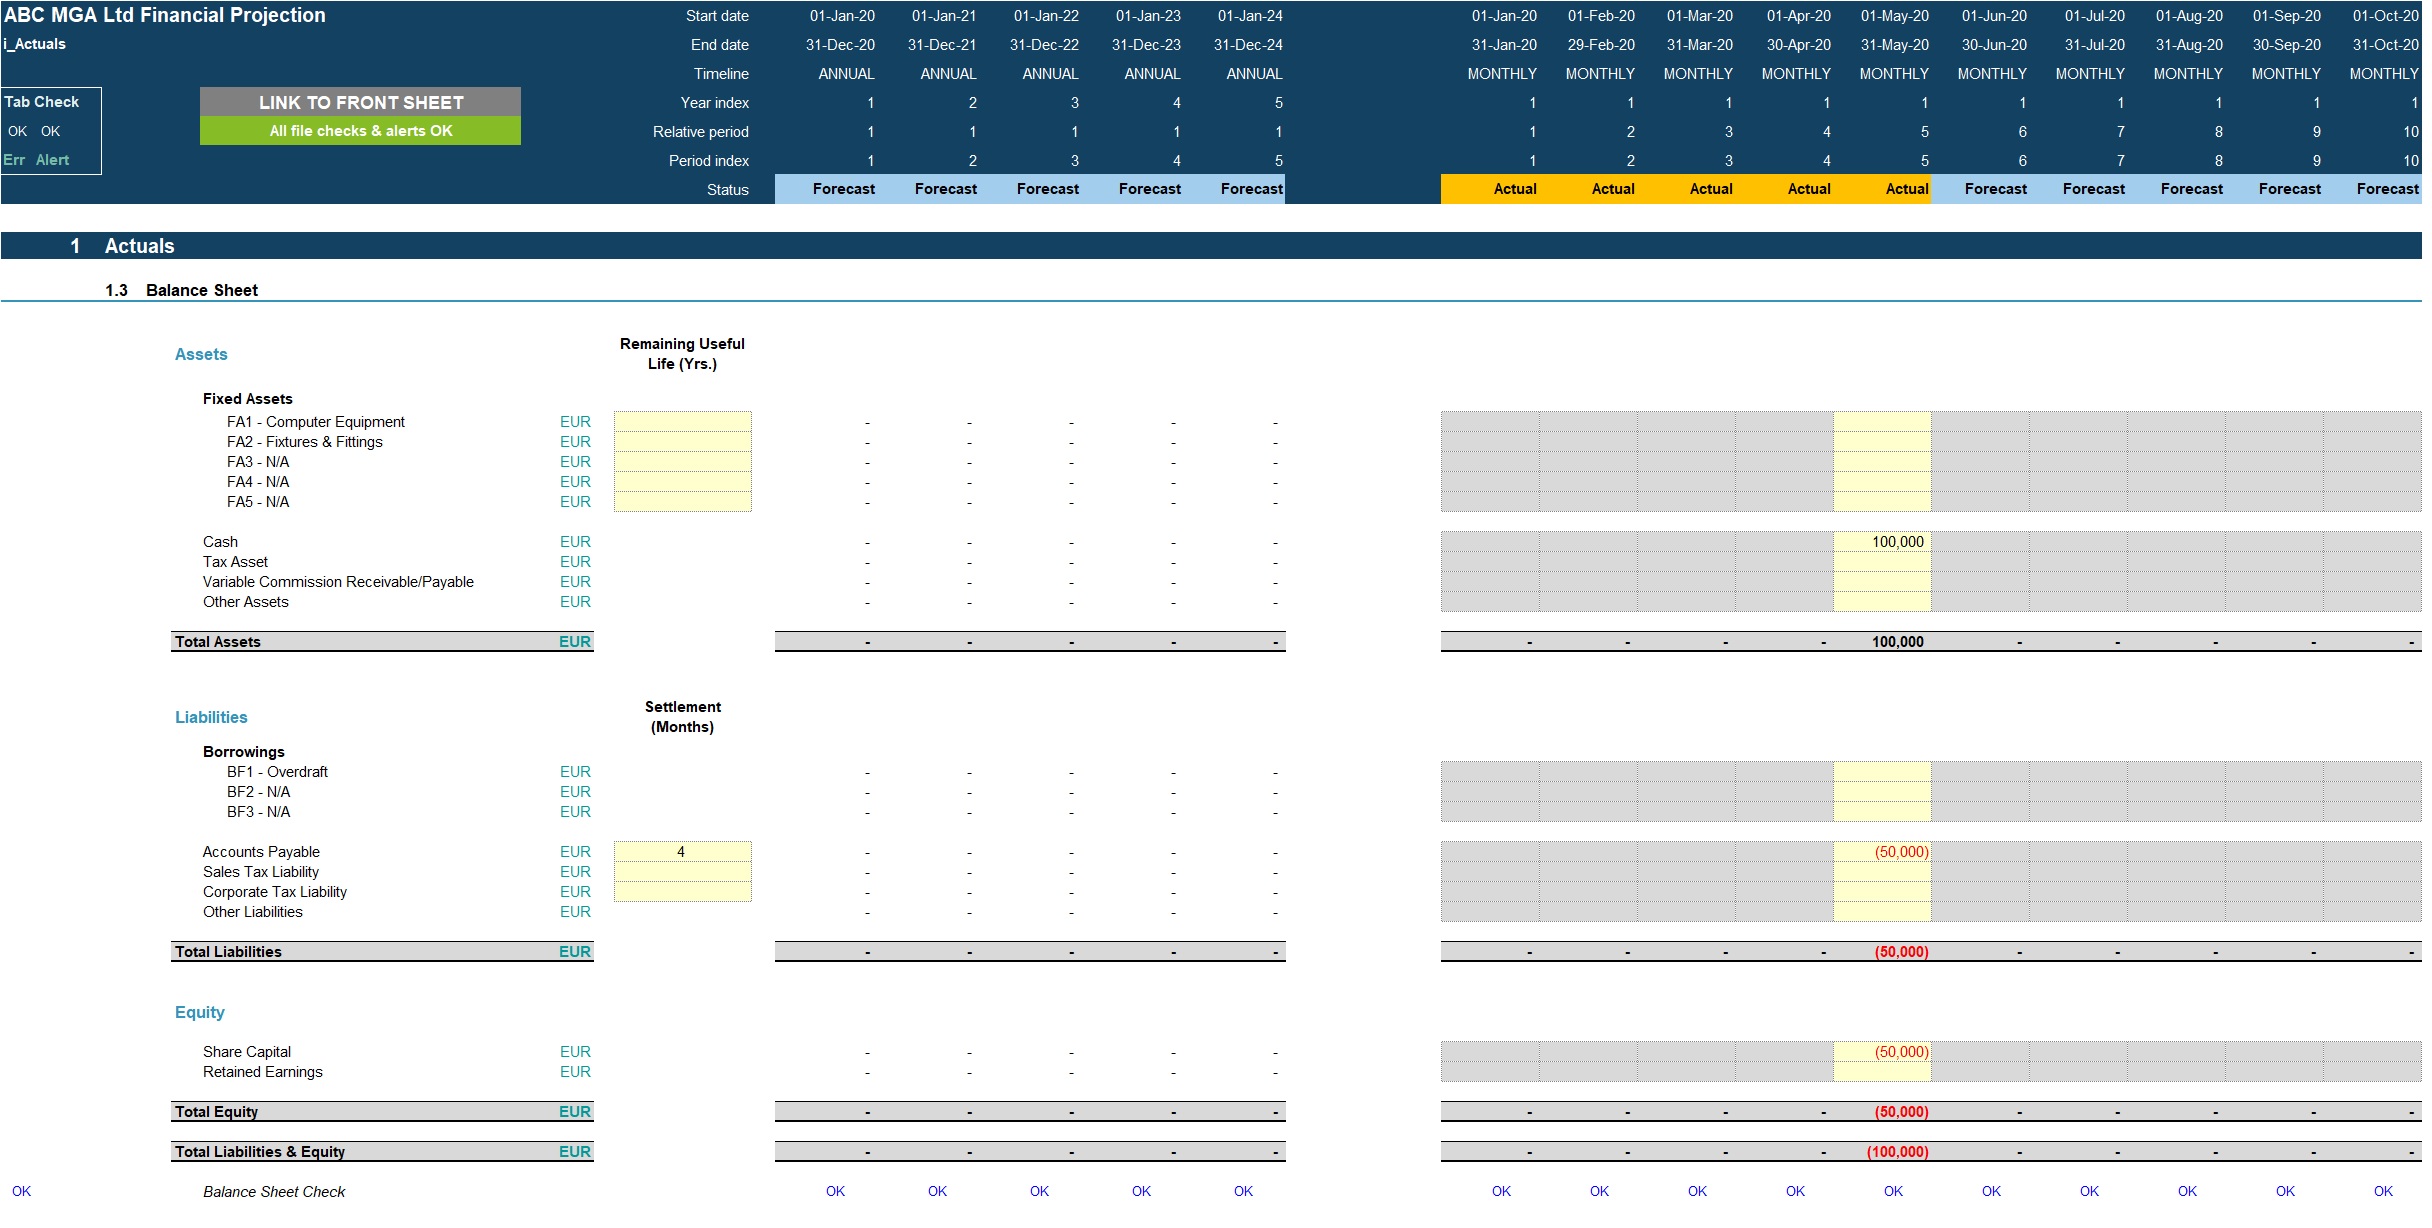
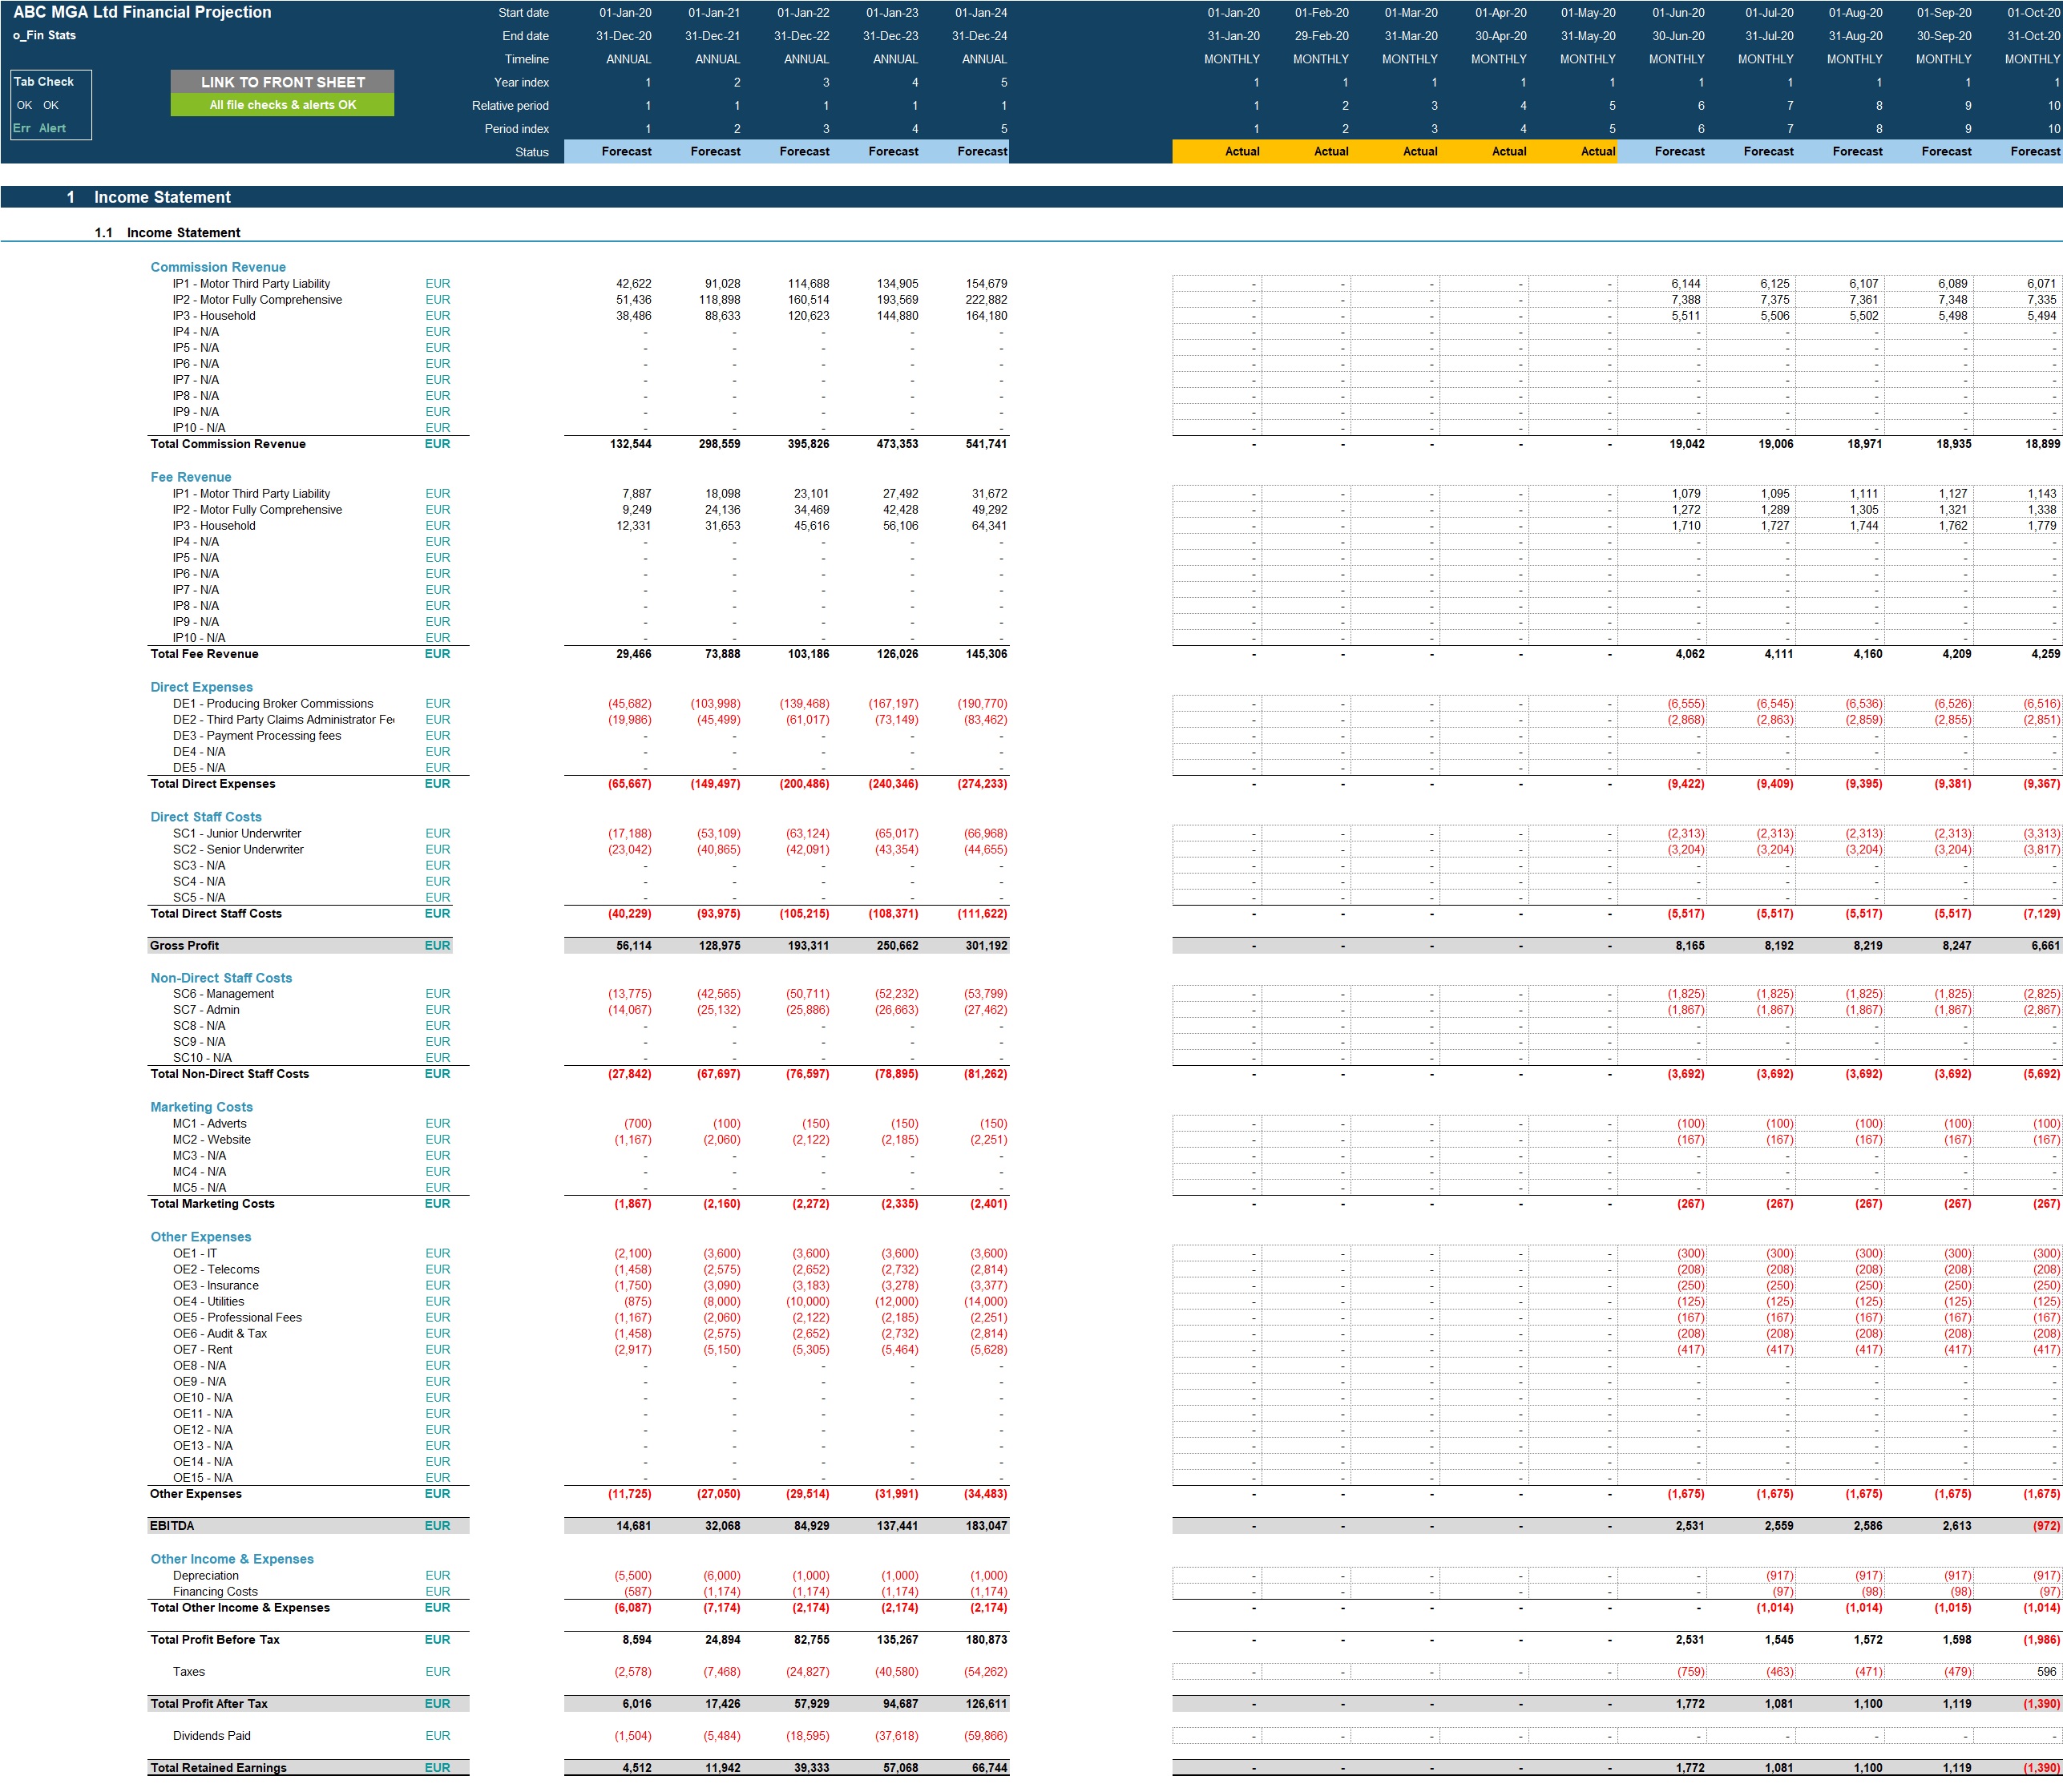
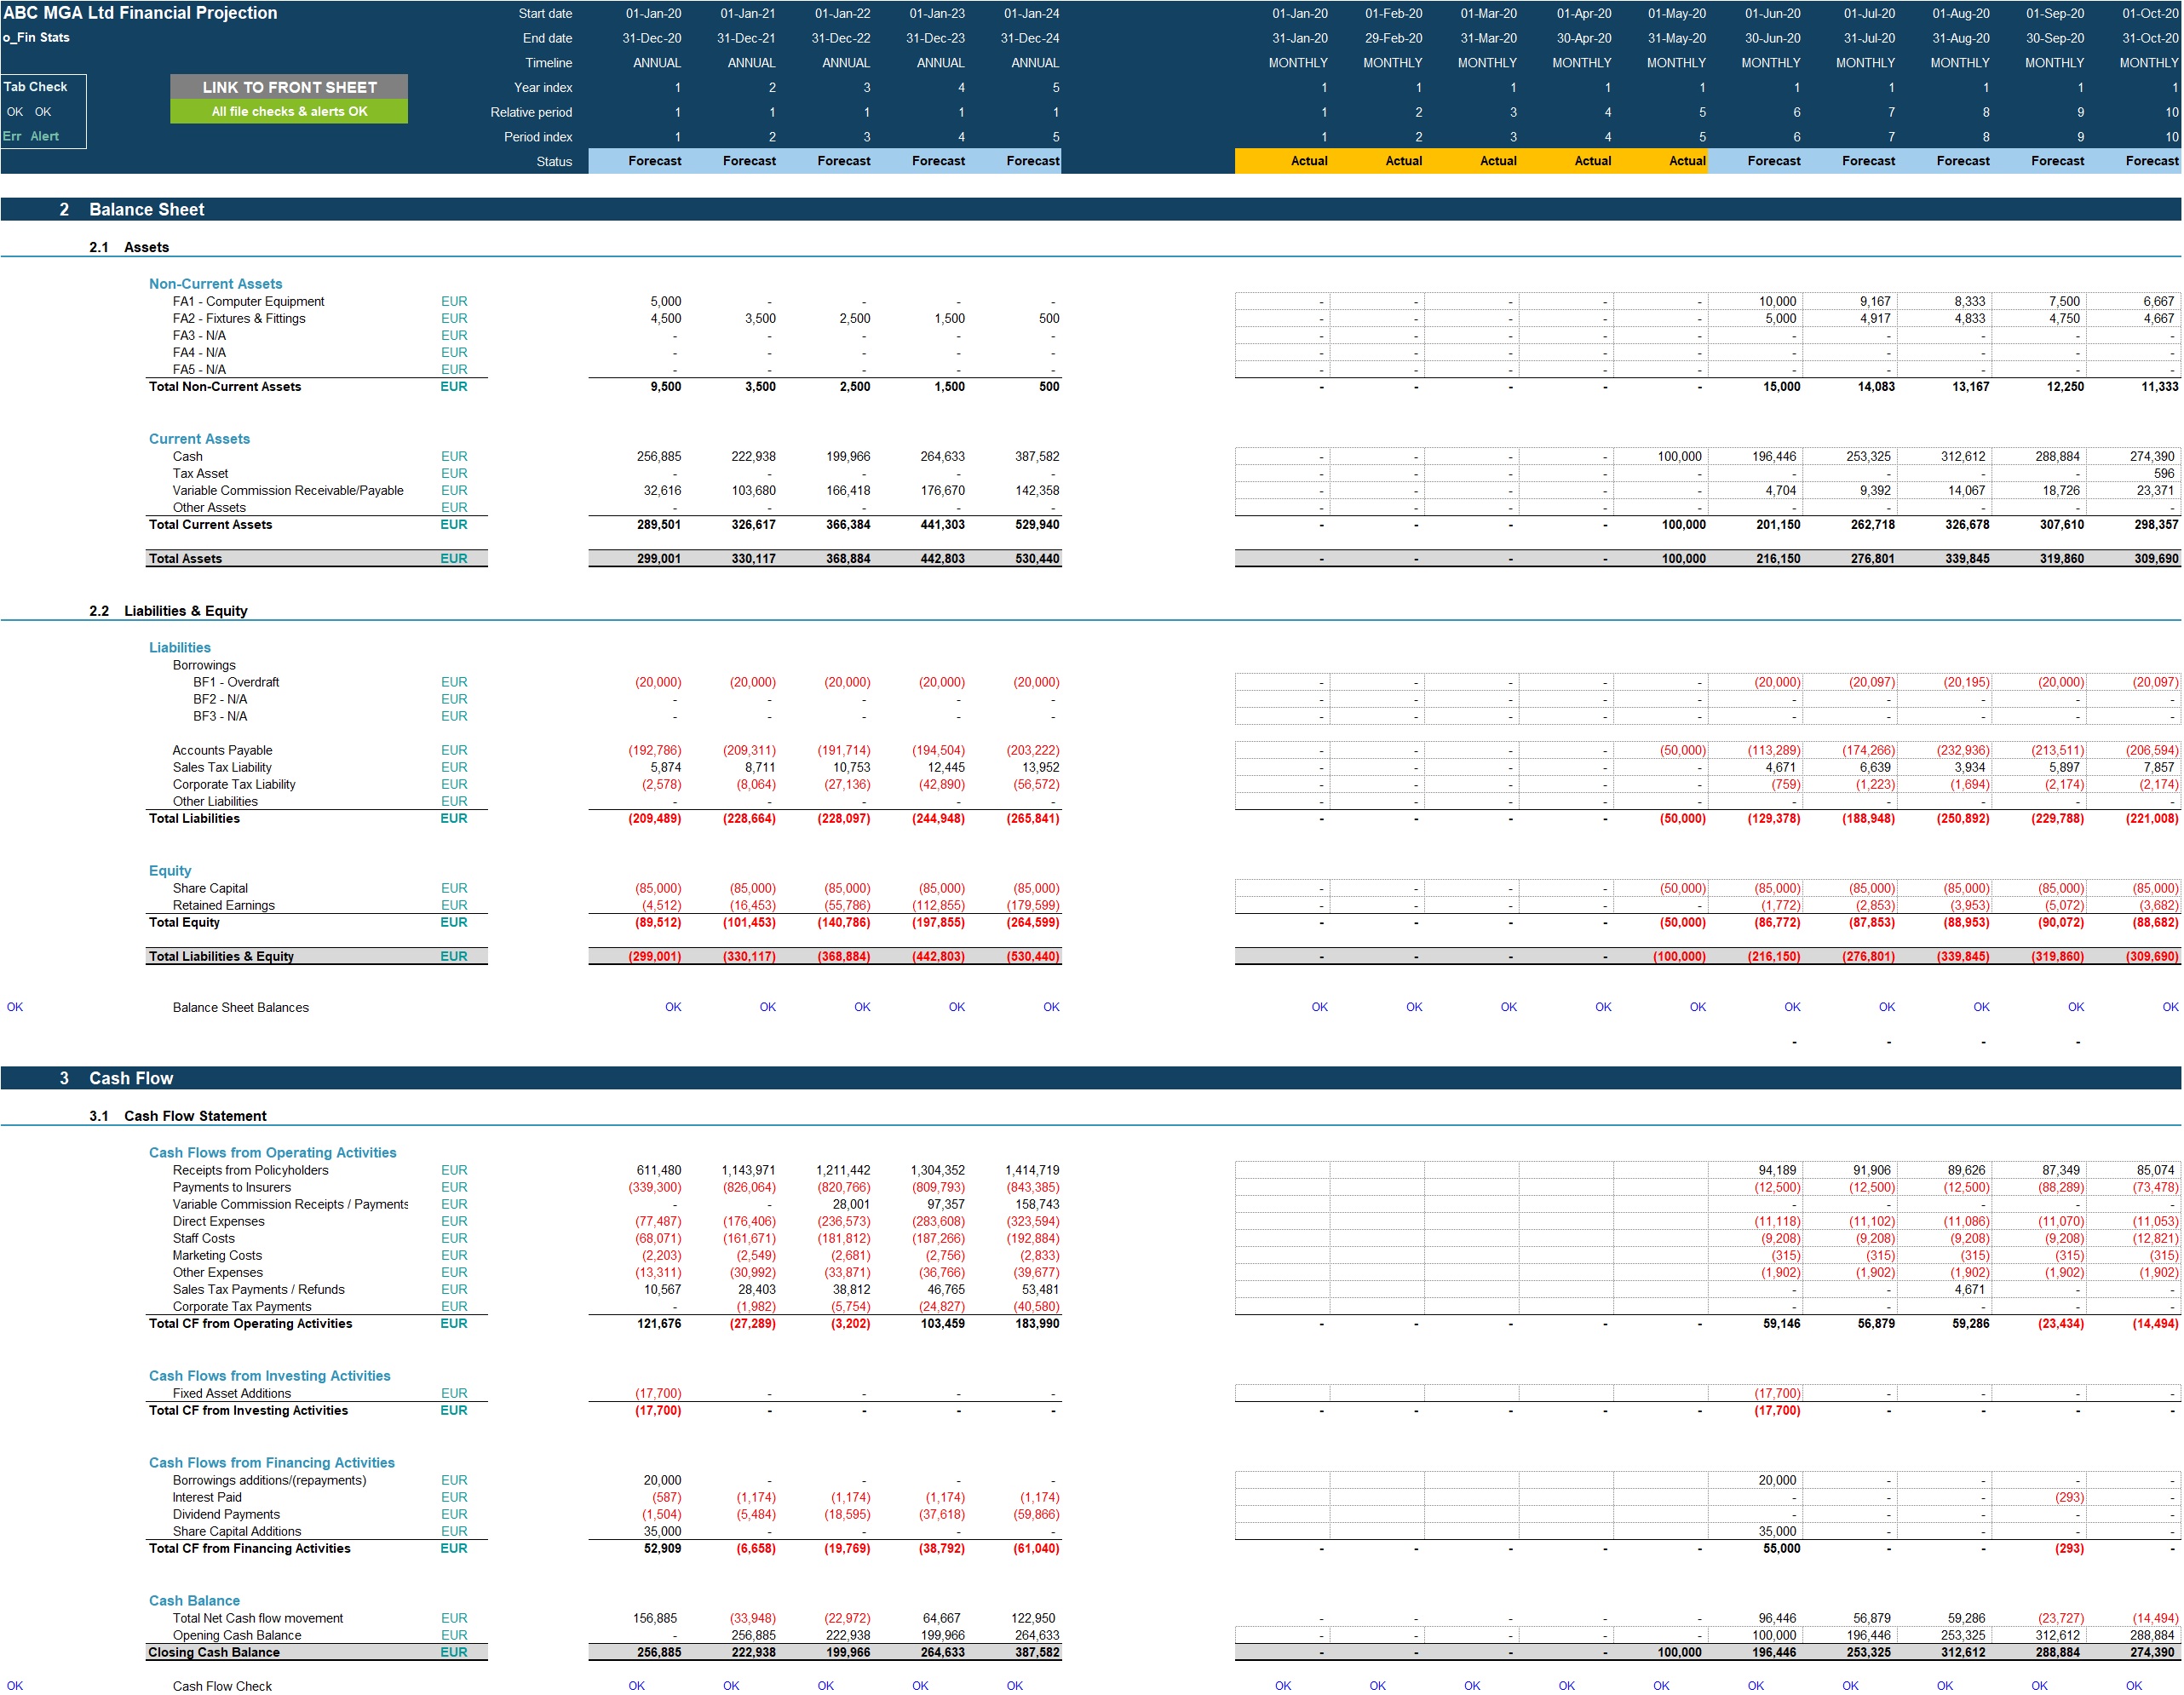
Insurance Managing General Agent (MGA) Financial Projection 3 Statement Model
User-friendly 3statement 5year rolling financial projection Excel model for existing/startup insurance MGA business
Further information
Provide a clear, practical framework for building and understanding an MGA (Managing General Agent) financial model.
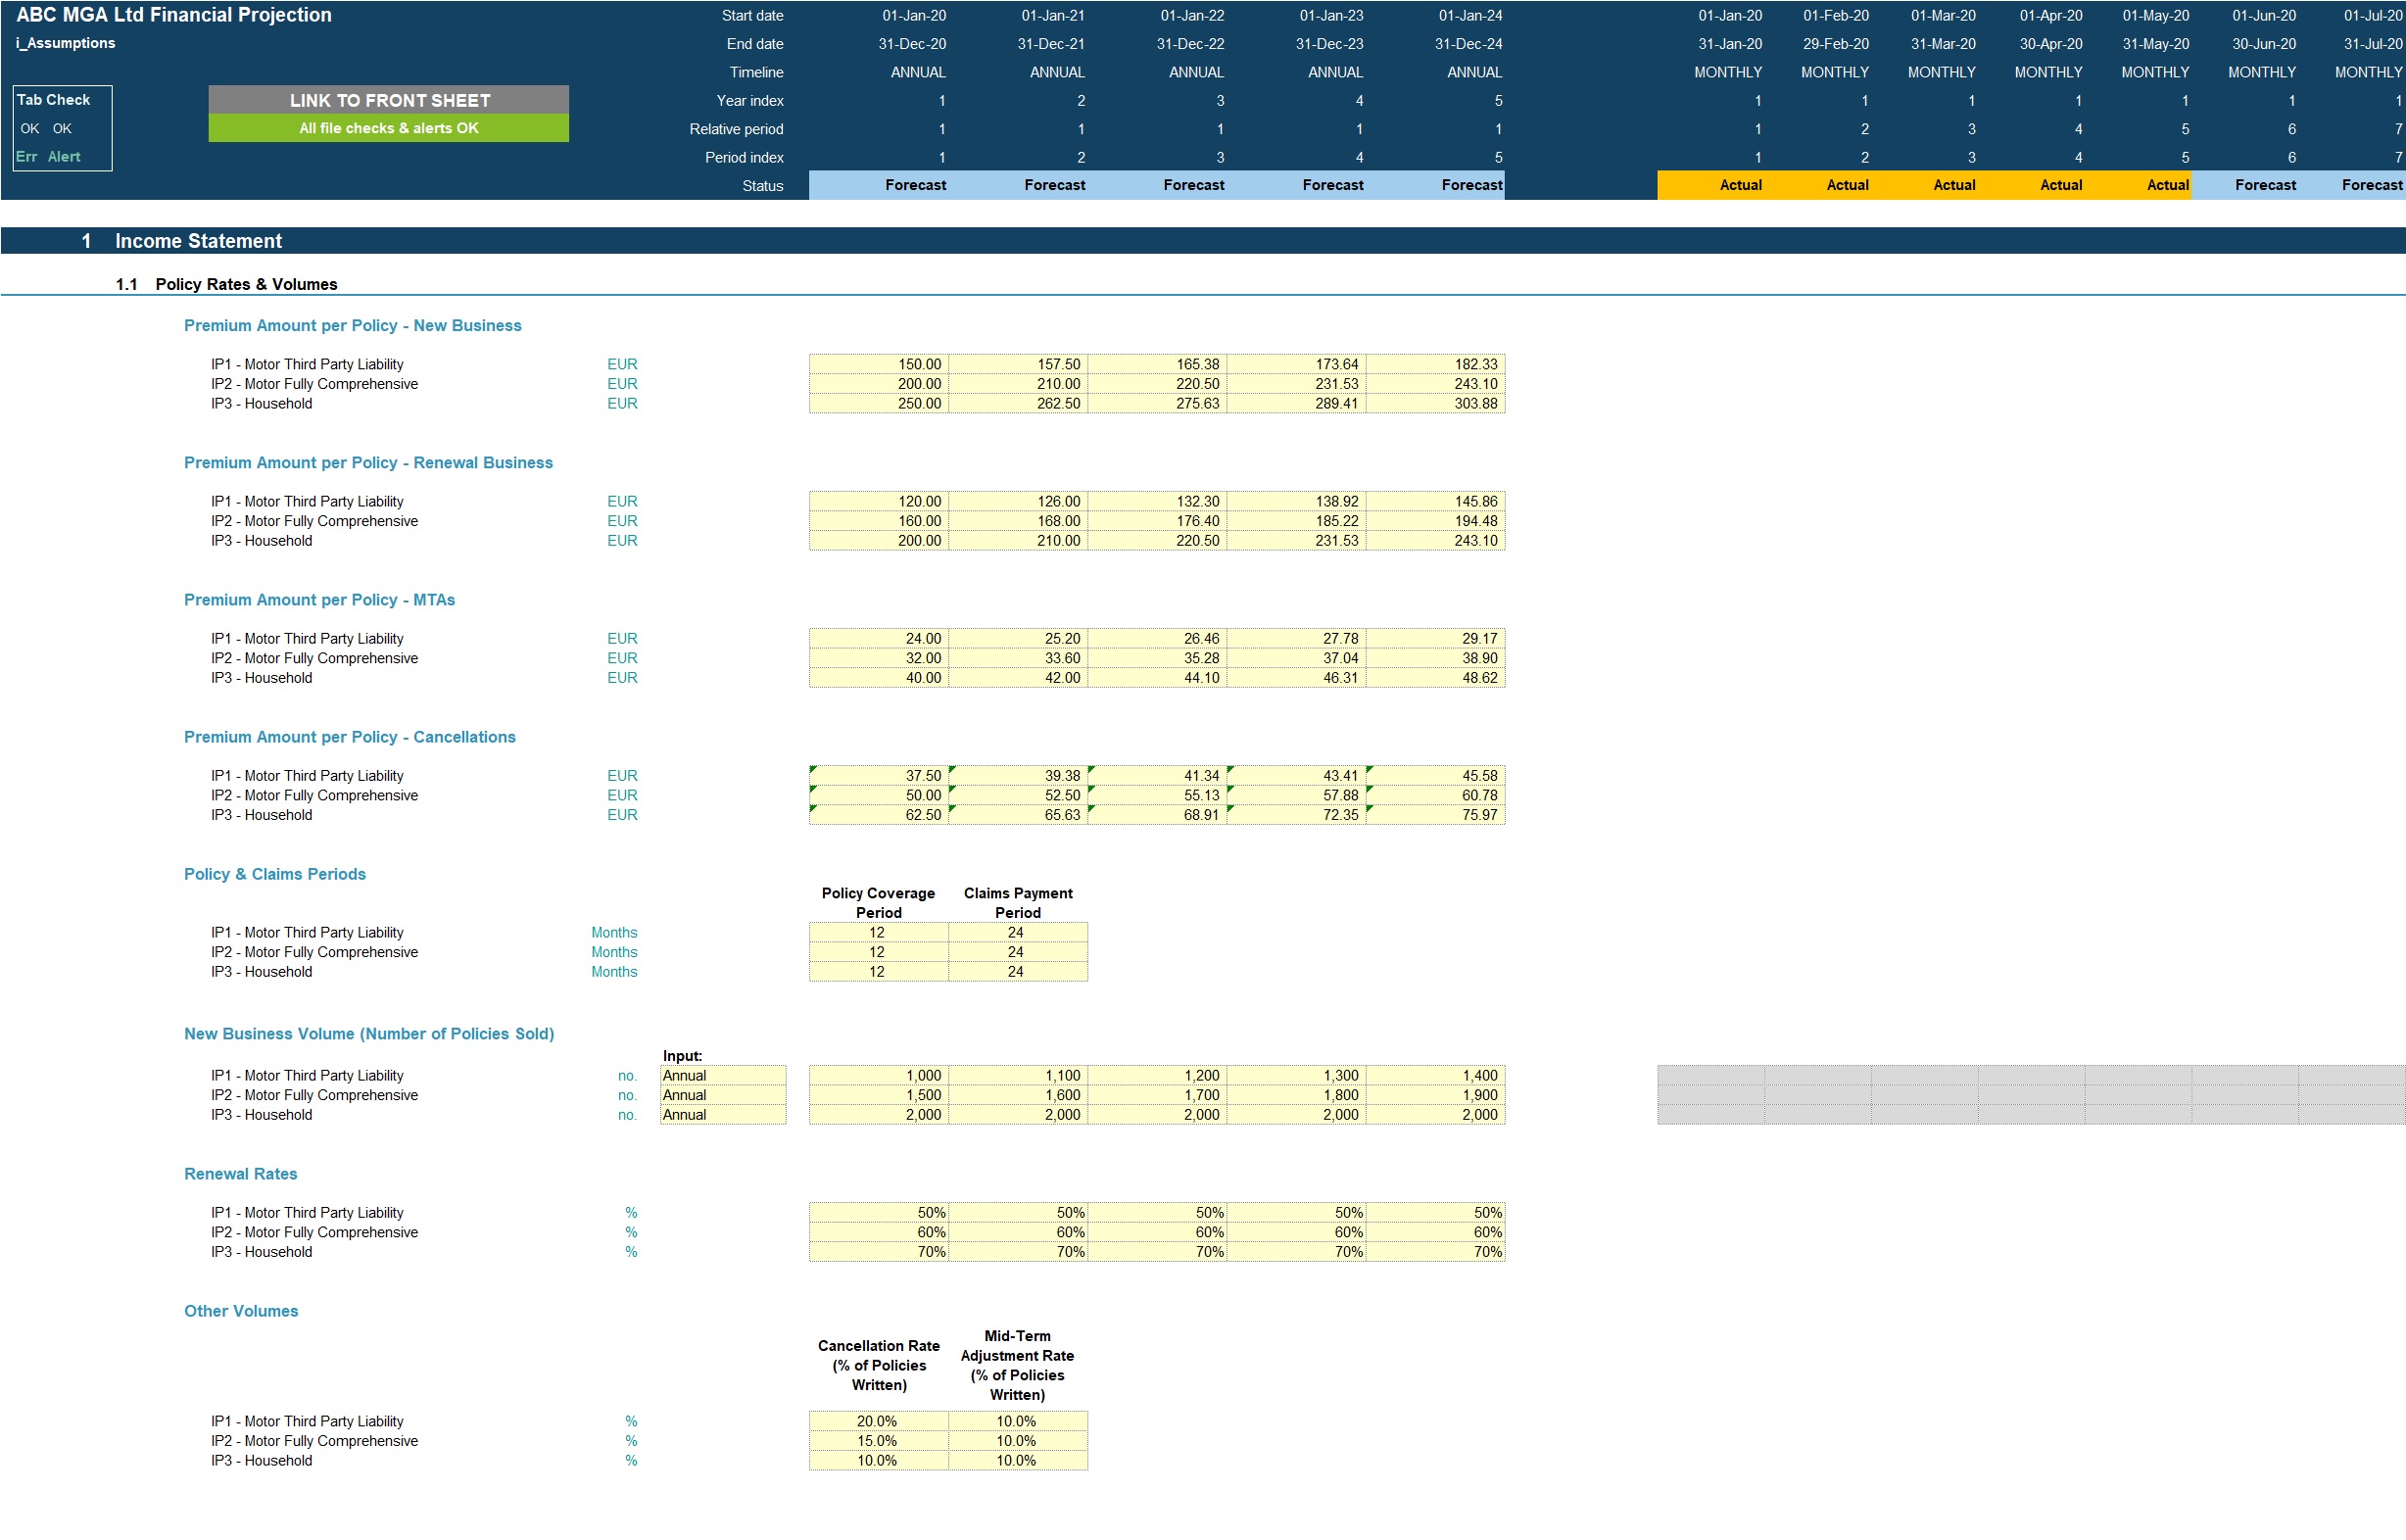
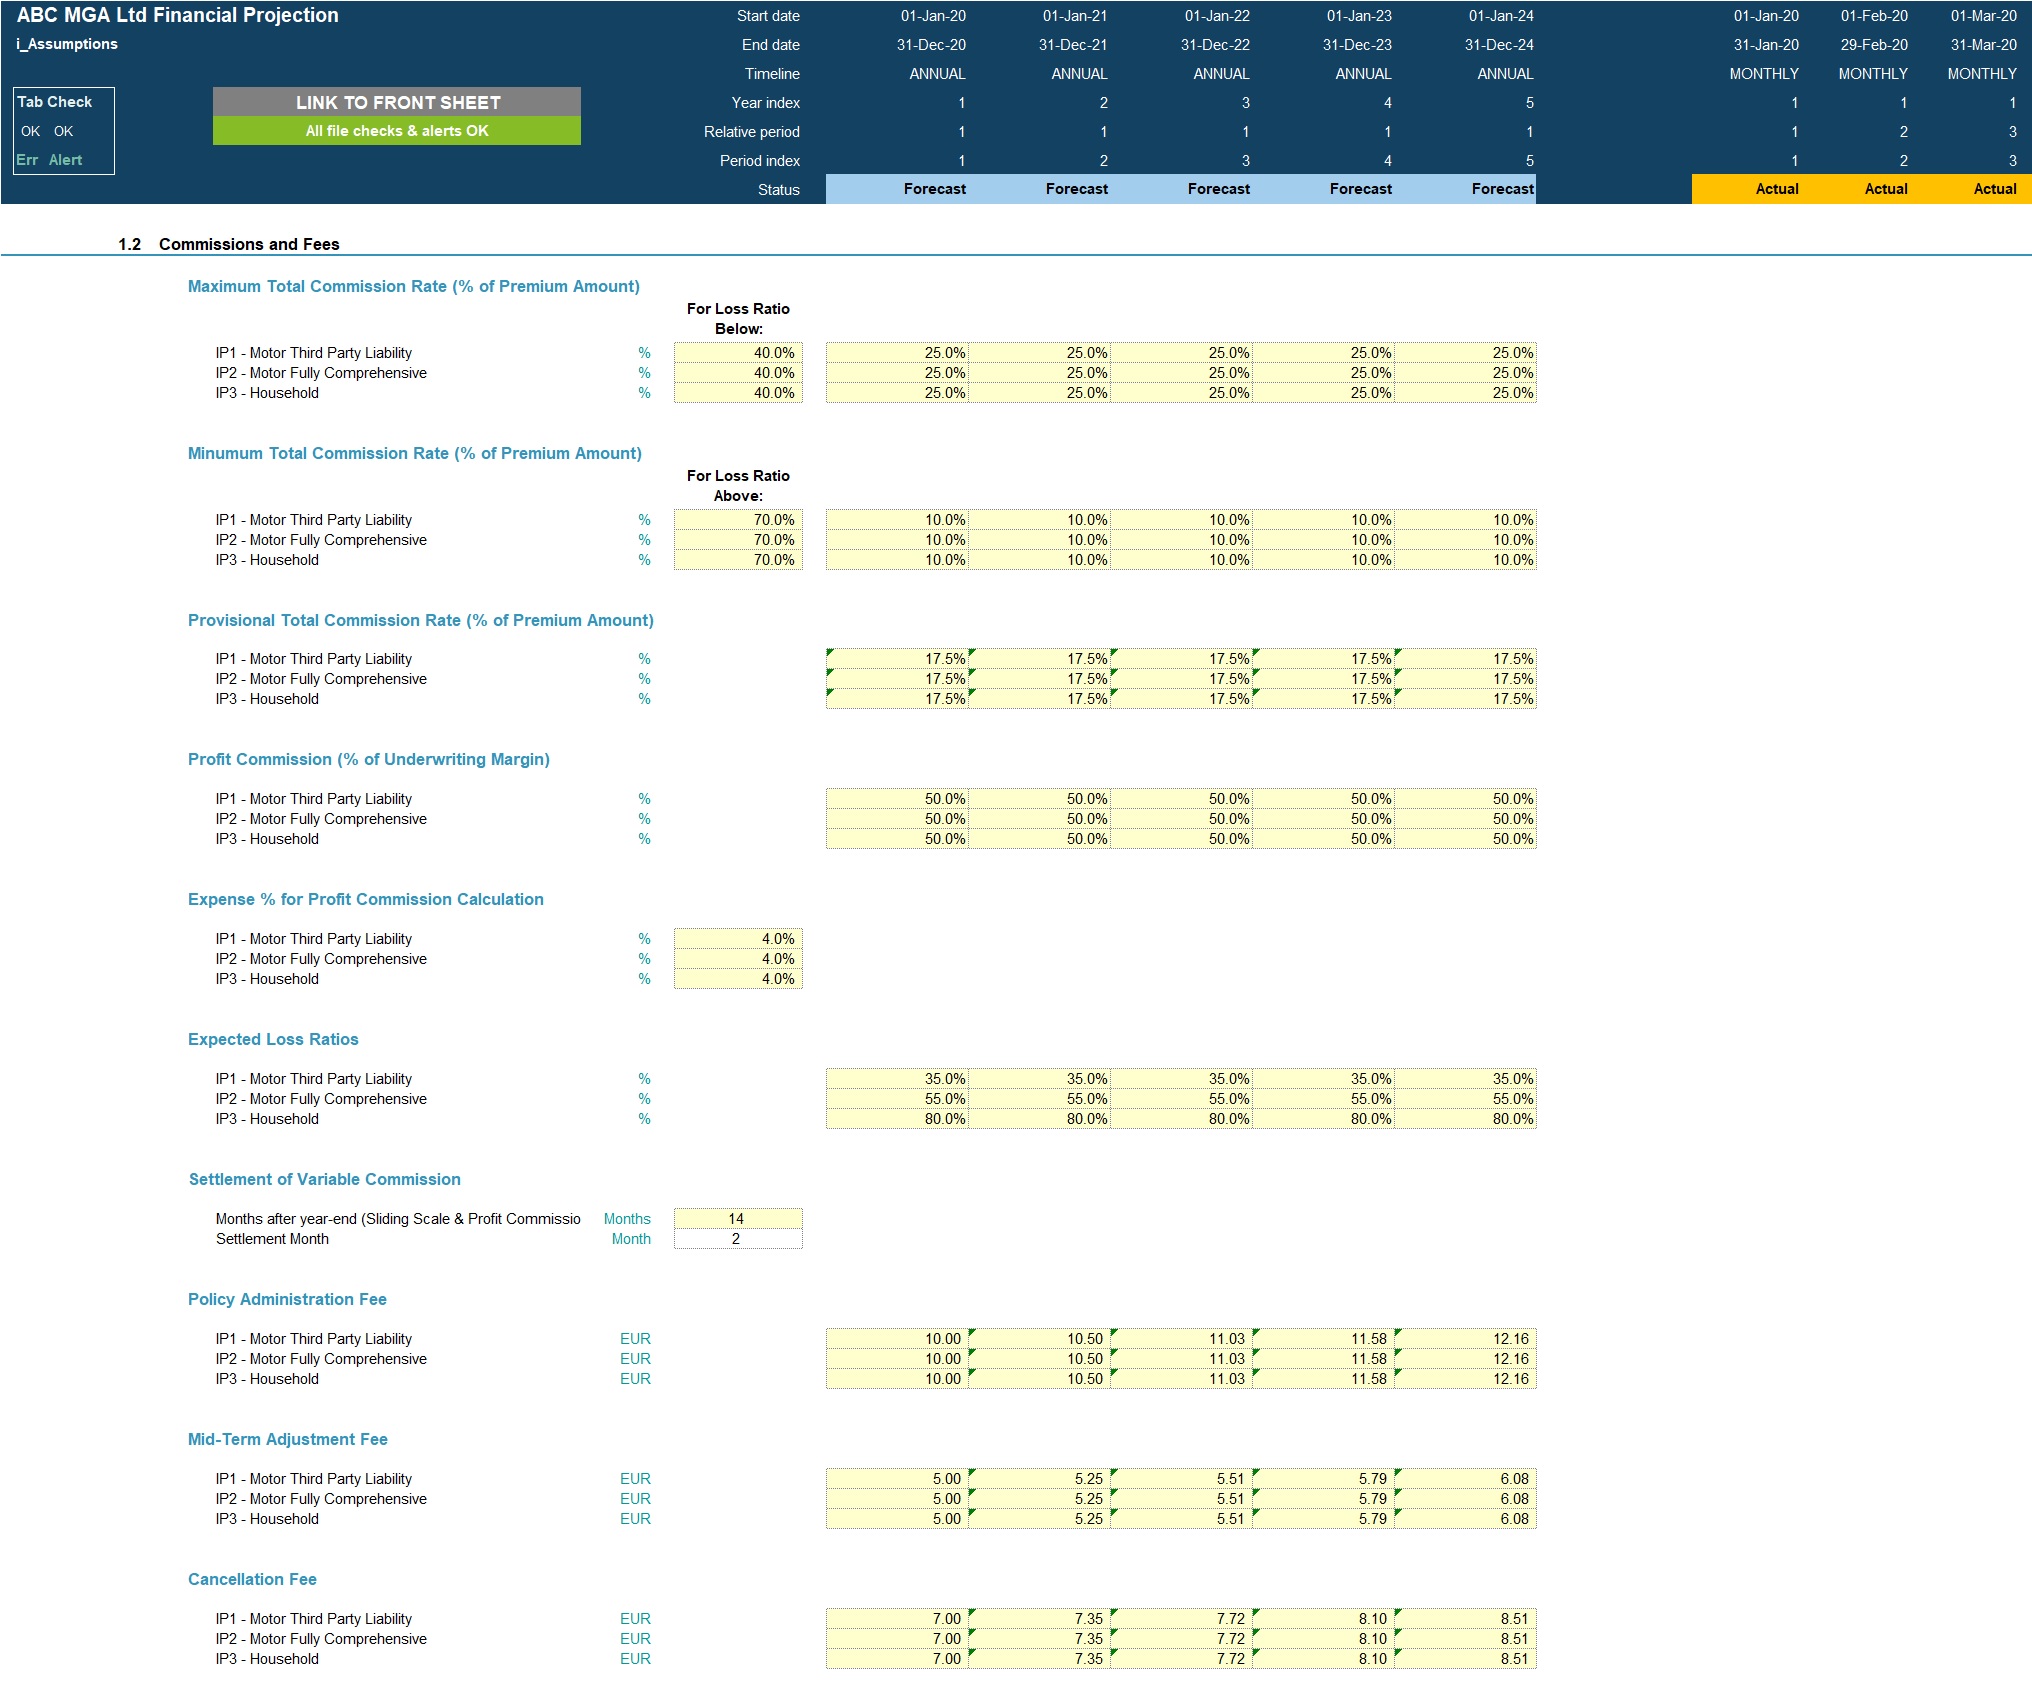
Help users accurately forecast key drivers such as premiums, commissions, underwriting performance, and profitability.
Standardise best-practice modelling approaches for revenue, expenses, and insurer relationships.
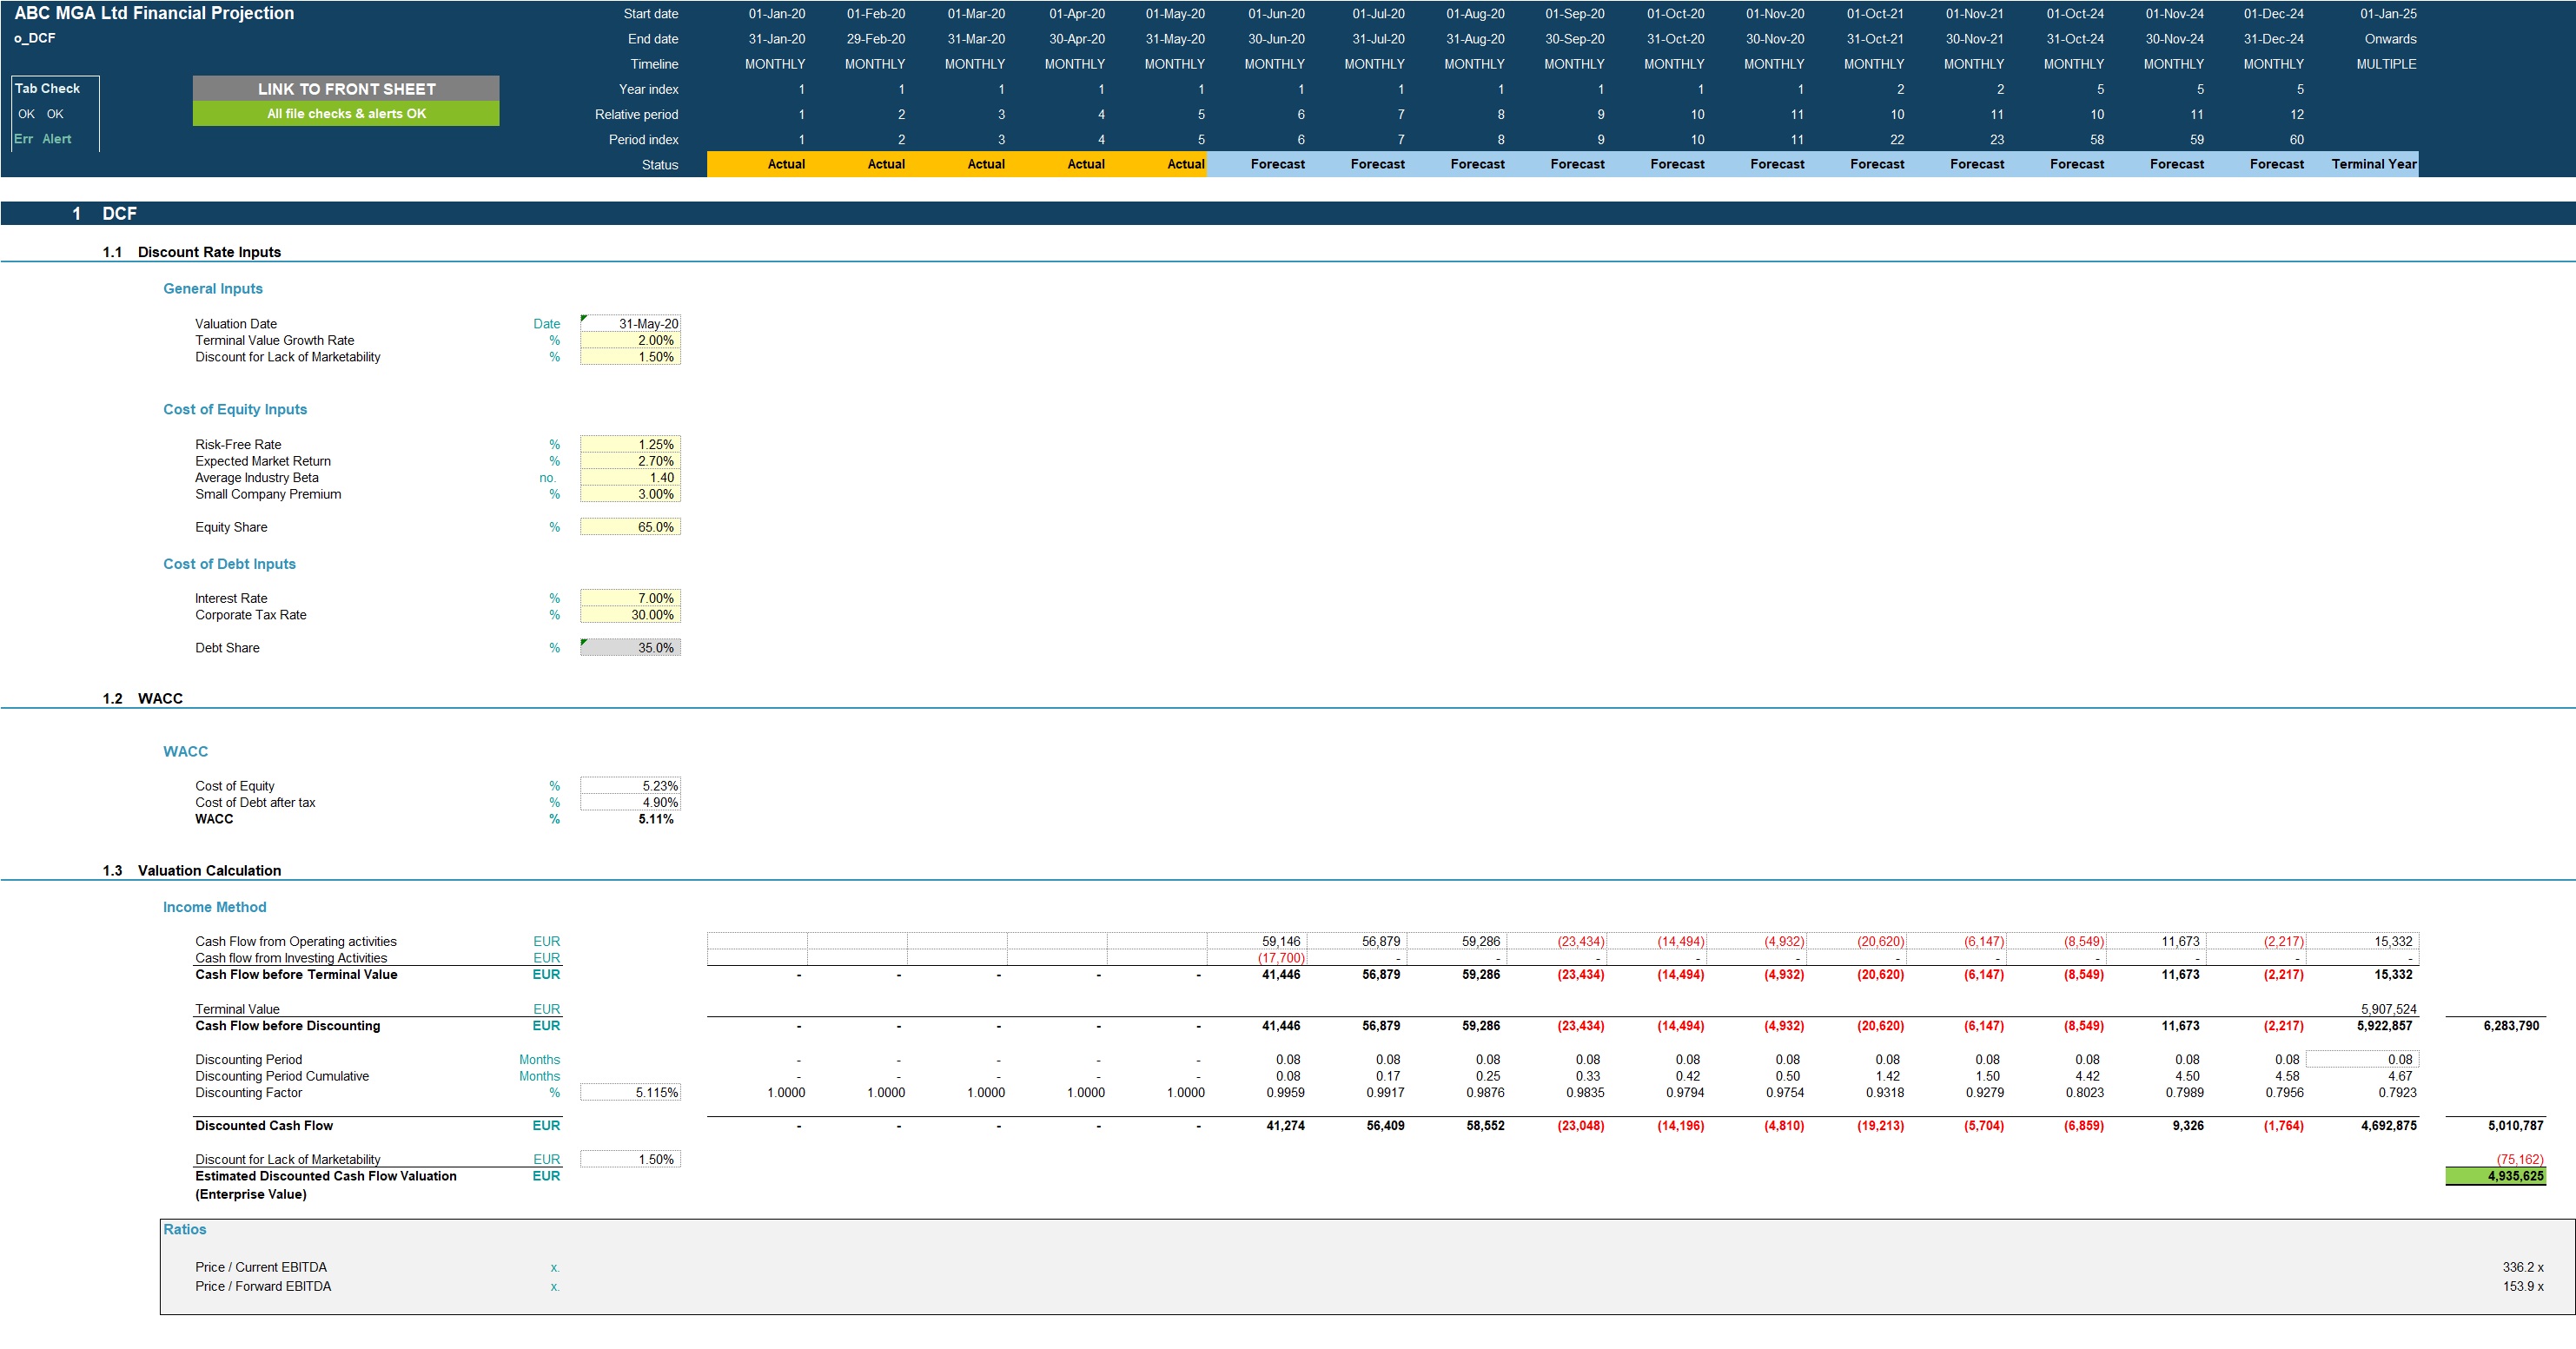
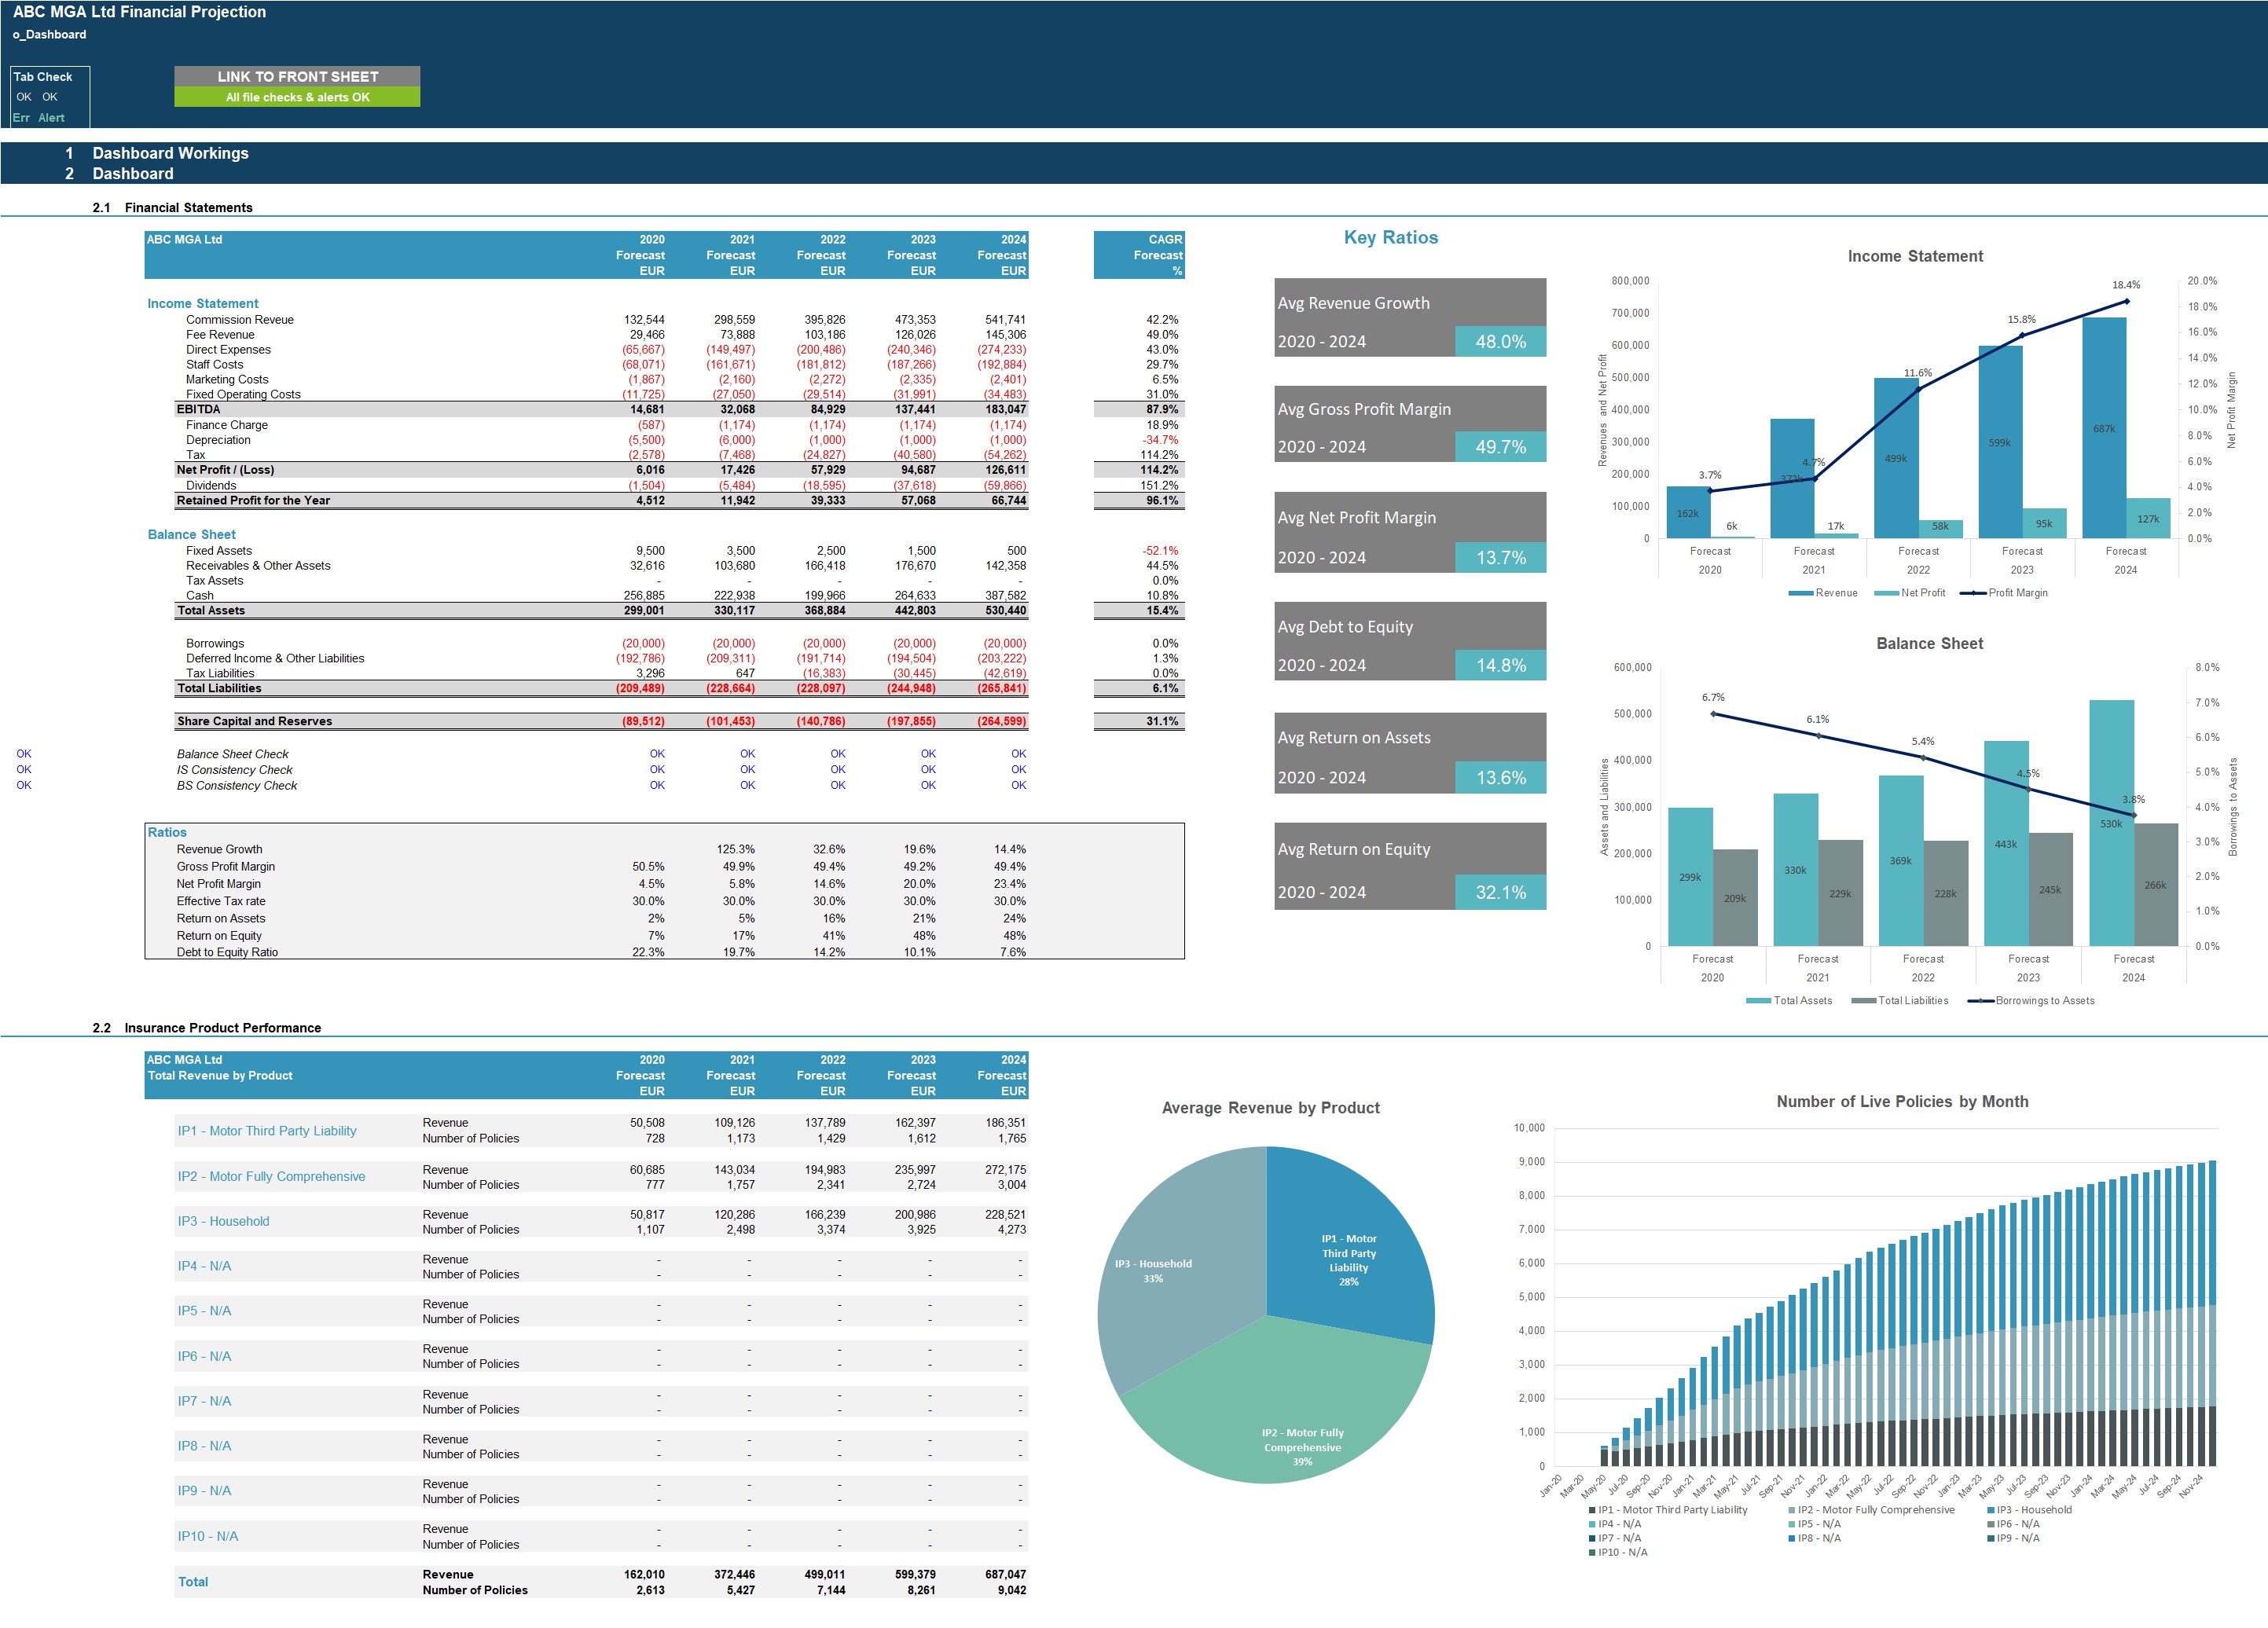
Enable scenario analysis to assess growth strategies, risk exposure, and capital requirements.
Support informed decision-making for founders, investors, and operators in the insurance sector.
When building or reviewing financial projections for an MGA with delegated underwriting authority.
For businesses operating on commission, fee-based, or profit-sharing arrangements with insurers.
When modelling multiple lines of insurance products (e.g. motor, health, specialty lines).
In scenarios requiring detailed forecasting of premiums, claims ratios, and underwriting performance.
For early-stage or scaling MGAs seeking structured, investor-ready financial models.
When evaluating different growth strategies, distribution channels, or insurer partnerships.
For users needing a standardised, Excel-based approach aligned with real-world insurance operations.
