Originally published: 26/07/2021 11:16
Publication number: ELQ-67308-1
View all versions & Certificate
Publication number: ELQ-67308-1
View all versions & Certificate


0.0 / 5 (0 votes)
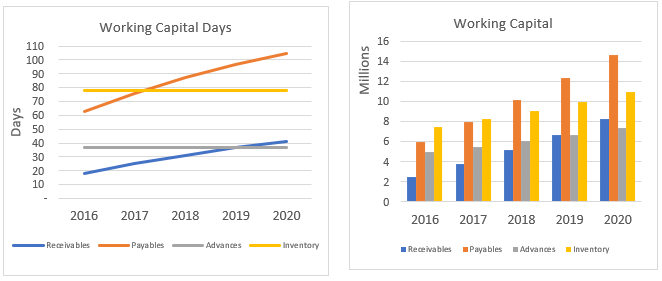
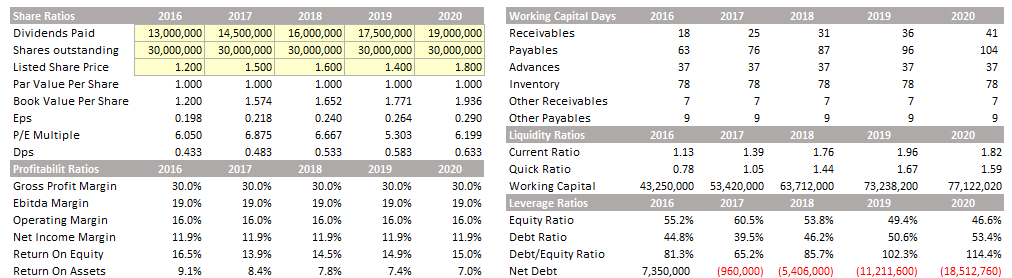
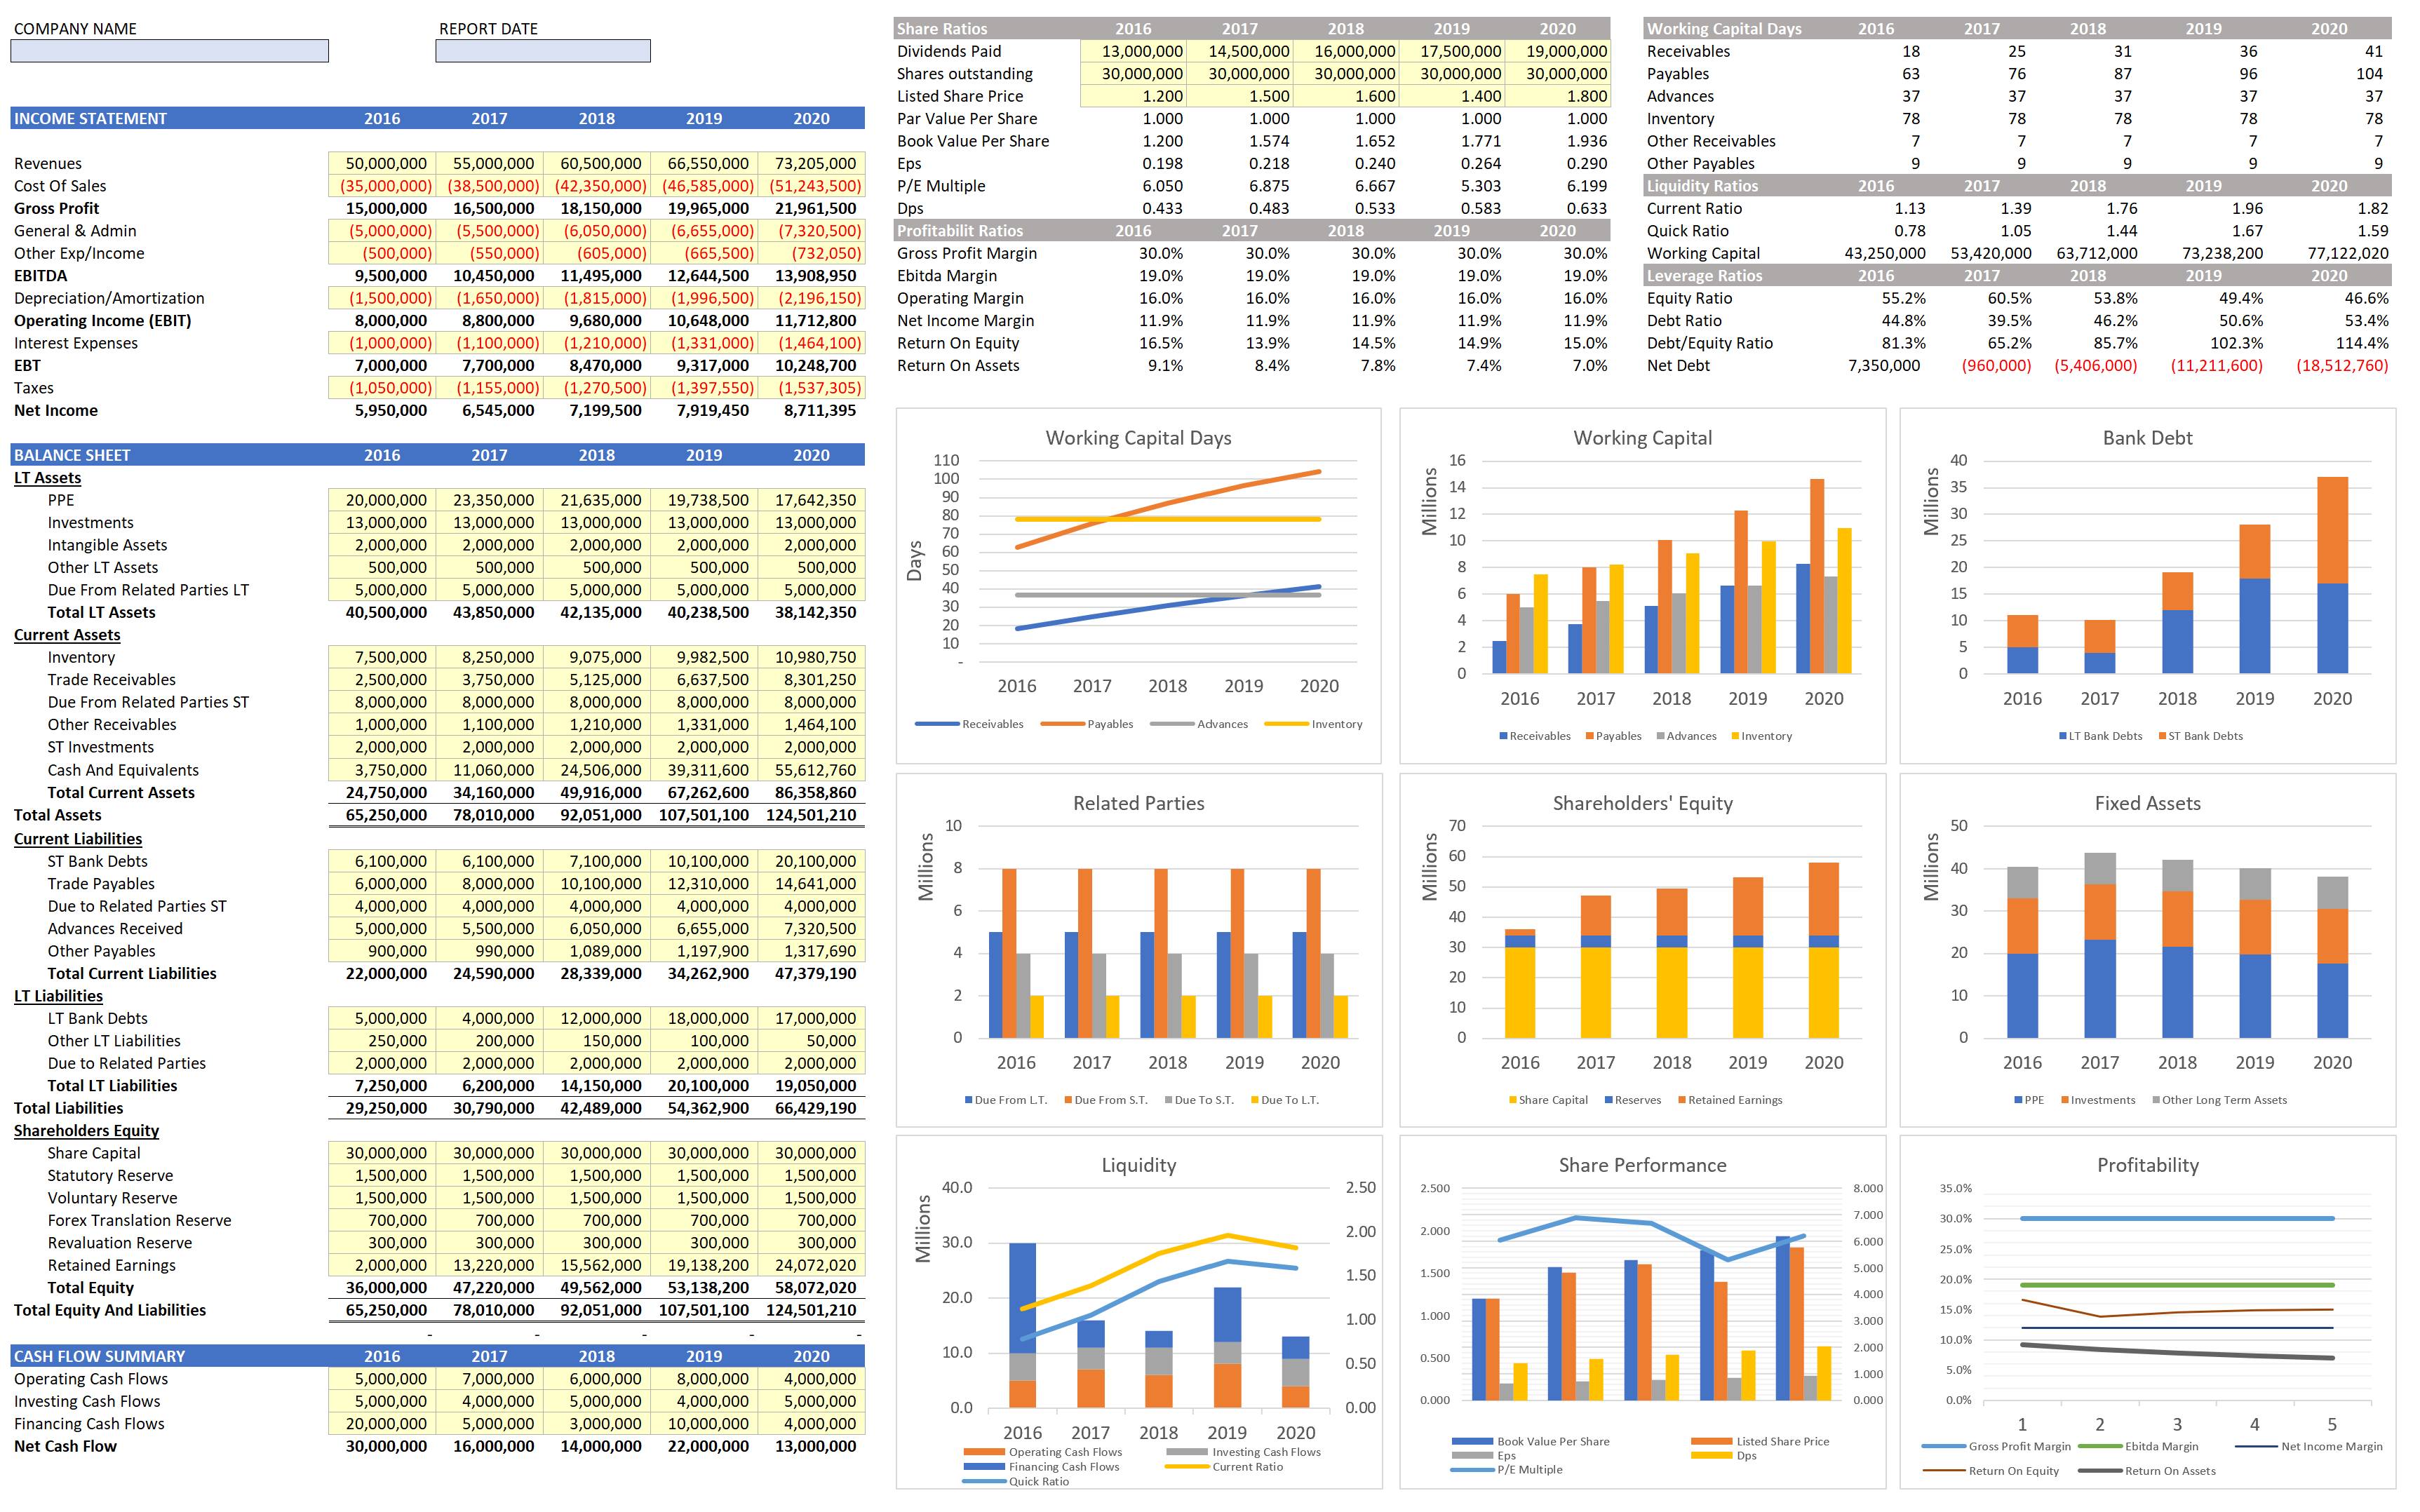
Financial Analysis Template - 5yr Historicals
by Pharaoh
Version 1 (Original Version): 26/07/2021 11:16 GMT
Publication Number: ELQ-67308-1
