
Originally published: 05/07/2018 12:29
Publication number: ELQ-25838-1
View all versions & Certificate
Publication number: ELQ-25838-1
View all versions & Certificate

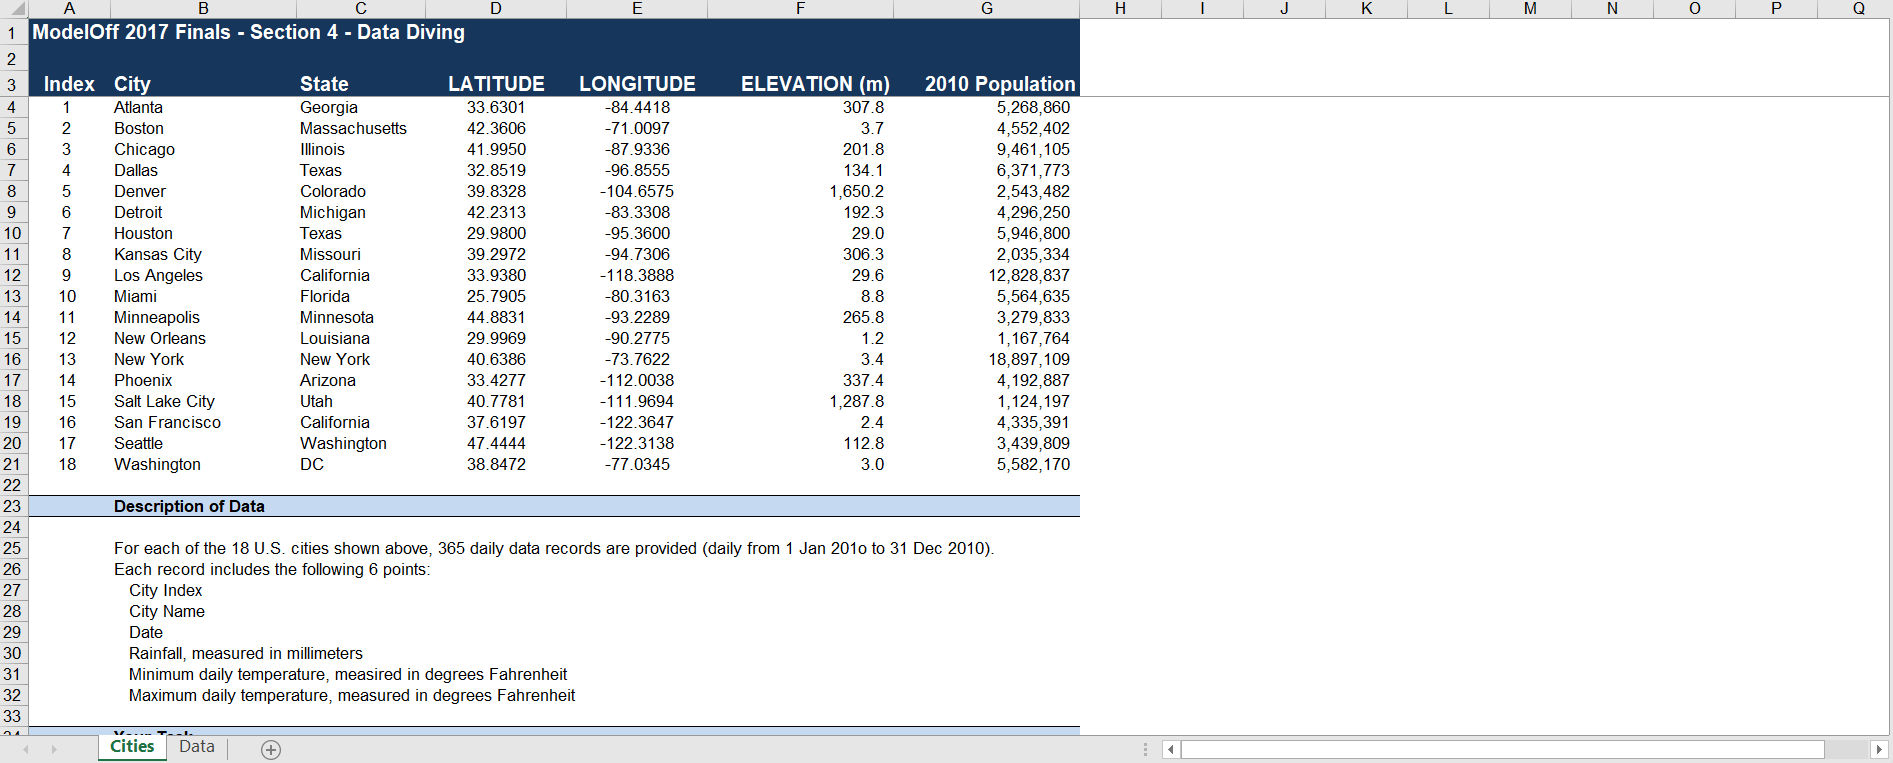
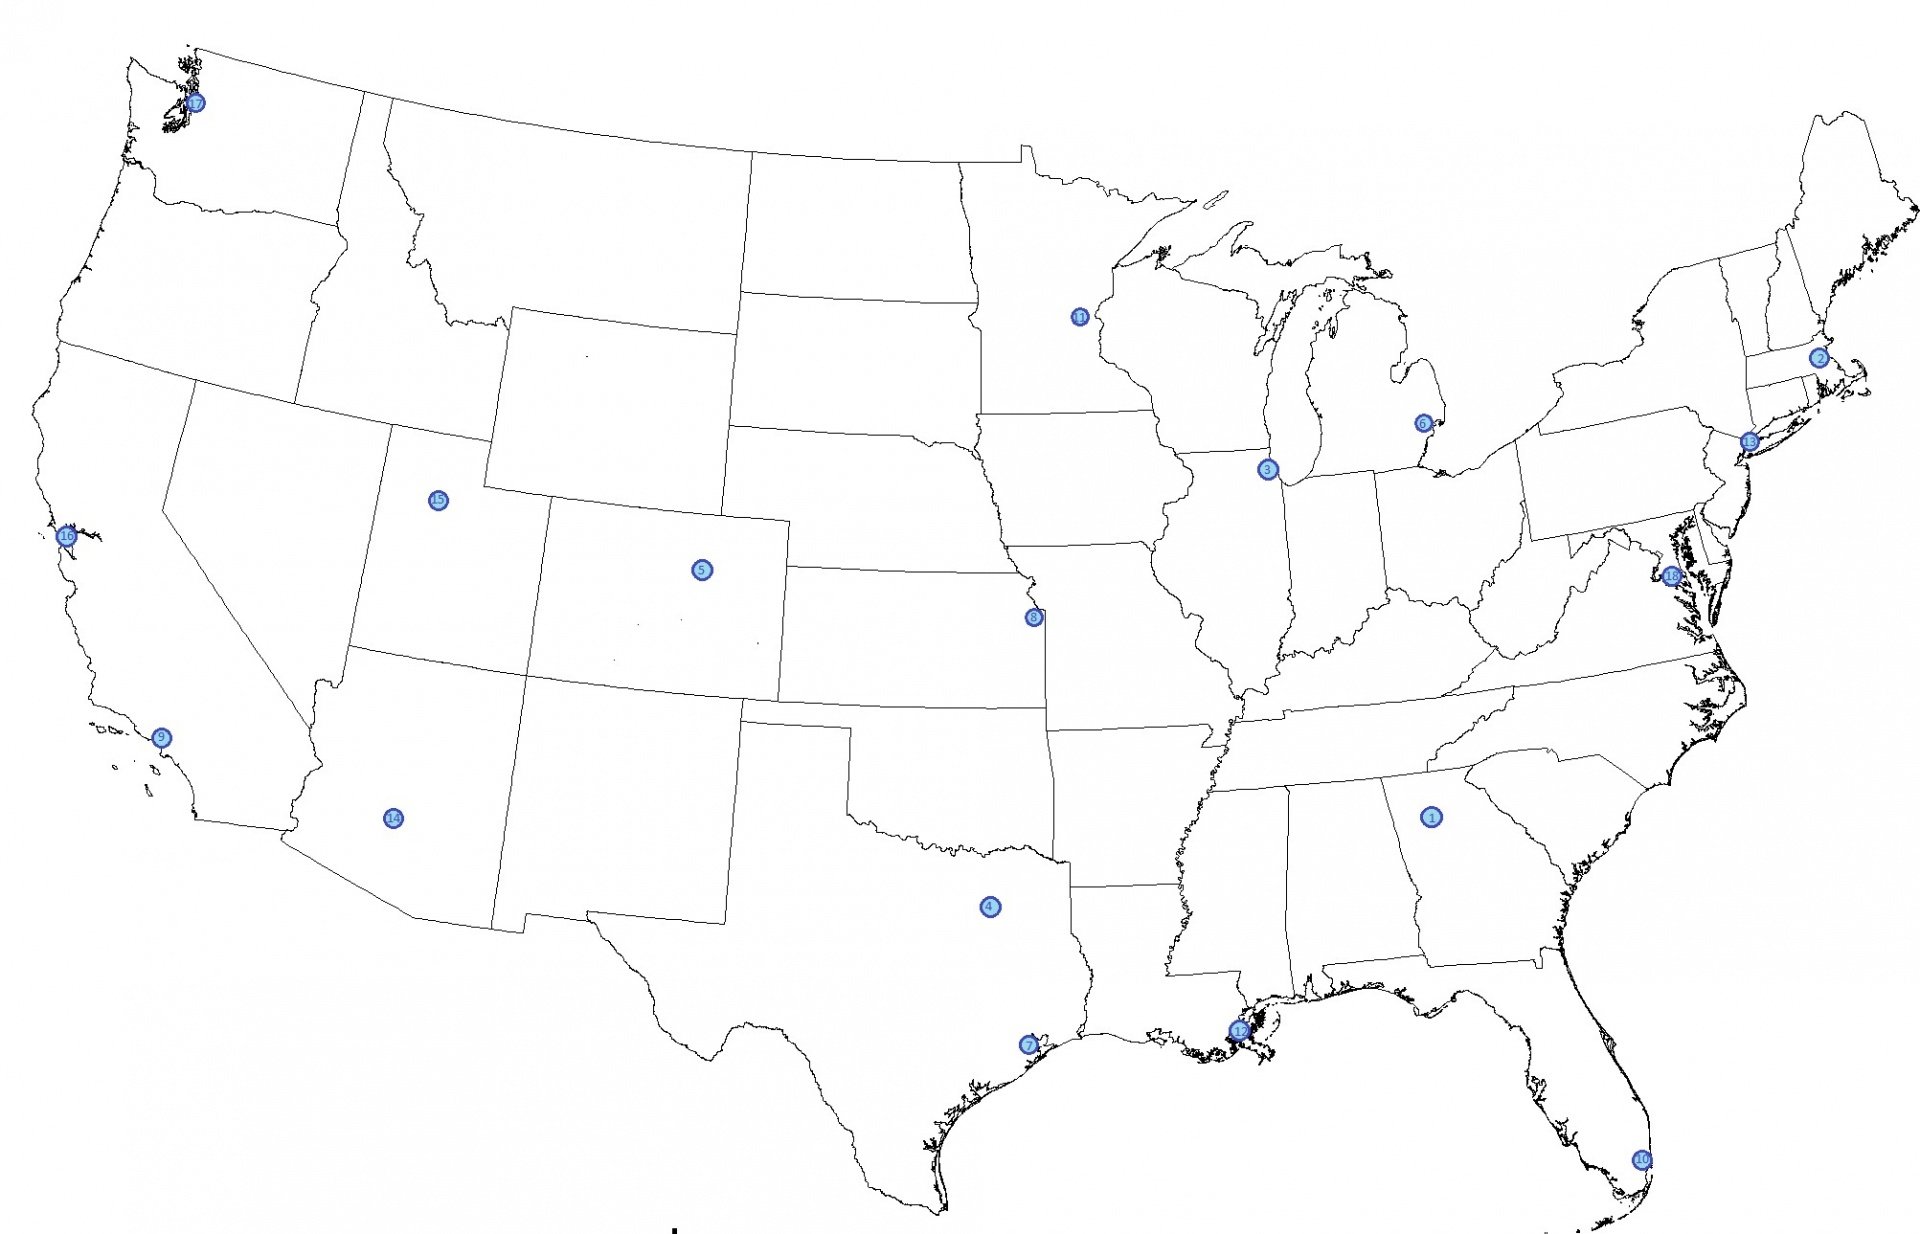
2017 Finals: Data Diving
Excel training/competition model from the 2017 Financial Modeling World Championships
To help finance professionals transform their Excel, financial modelling, data visualisation & analytics skillsFollow 82
