
Publication number: ELQ-98065-1
View all versions & Certificate

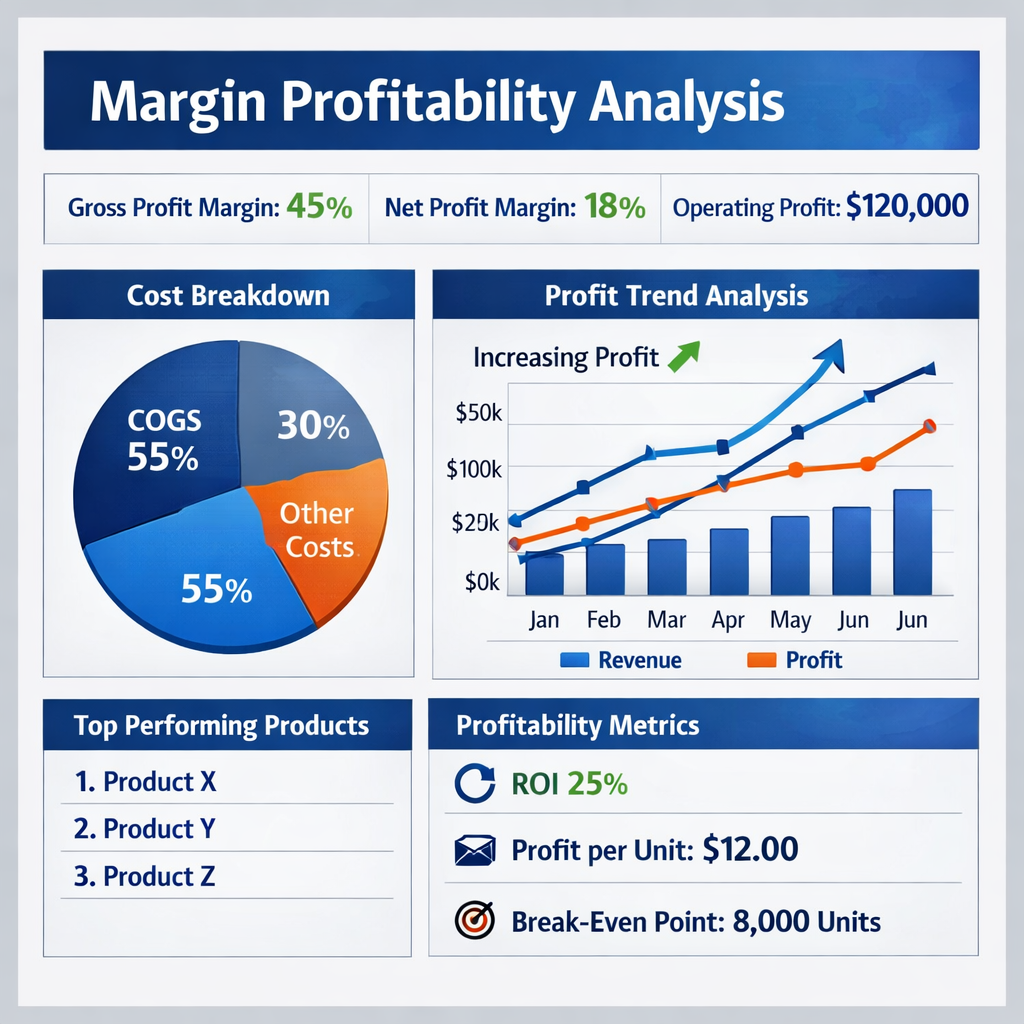
Margin profitability dashboard
The Data'sOk Margin & Profitability Dashboard gives you the complete picture: from gross revenue all the way down to operating profit, SKU by SKU.
📊 Margin & Profitability Dashboard — Excel Template
By Data'sOk
━━━━━━━━━━━━━━━━━━━━━━━━
Do you know which of your products are actually making money?
Revenue is vanity. Margin is sanity. Most e-commerce businesses track sales carefully and margin loosely — until a product that looked profitable on paper turns out to be destroying value once fulfilment, returns, and overheads are accounted for.
The Data'sOk Margin & Profitability Dashboard gives you the complete picture: from gross revenue all the way down to operating profit, SKU by SKU, in a single clean Excel file.
━━━━━━━━━━━━━━━━━━━━━━━━
WHAT YOU GET
8-tab Excel workbook, fully unlocked:
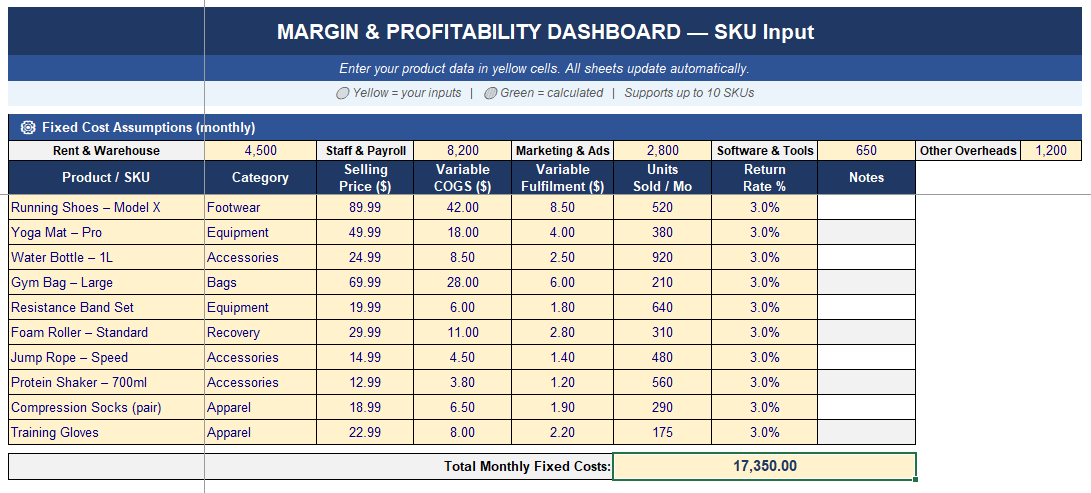
📥 SKU Input — Enter prices, variable costs, fulfilment costs, monthly units, and return rates for up to 10 products. Fixed costs (rent, payroll, marketing, software, overheads) entered once at the top.
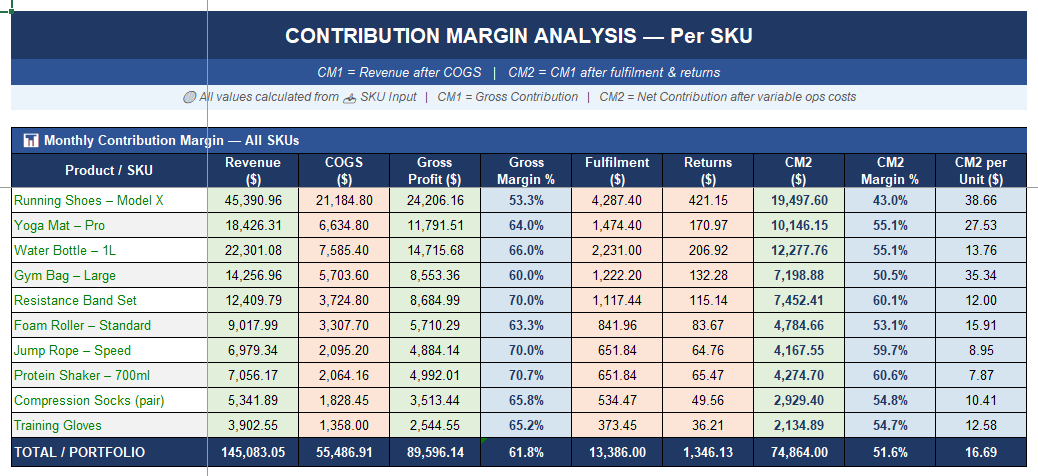
📊 Contribution Margin — Full CM waterfall per SKU: Revenue → COGS → Gross Profit → Fulfilment → Returns → CM2 (Net Contribution). Gross margin % and CM2 margin % calculated automatically.
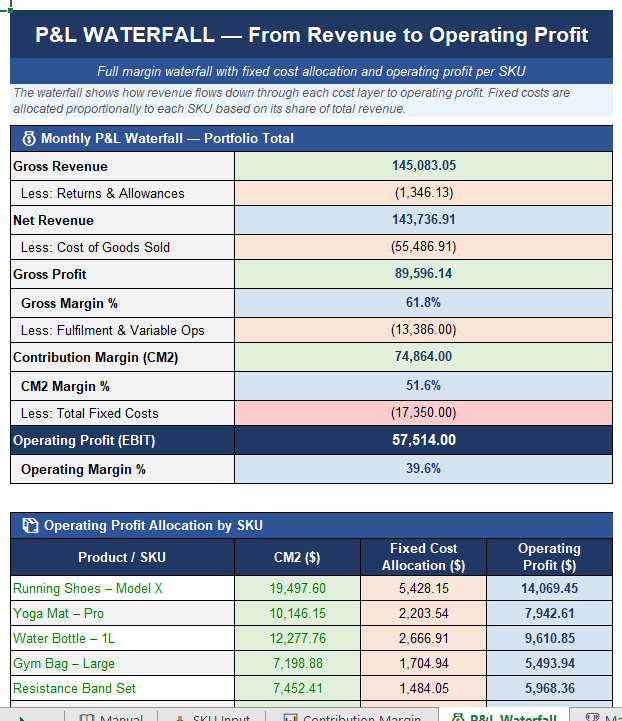
💰 P&L Waterfall — Portfolio-level waterfall from gross revenue to operating profit, plus a per-SKU table showing fixed cost allocation and operating profit per product.
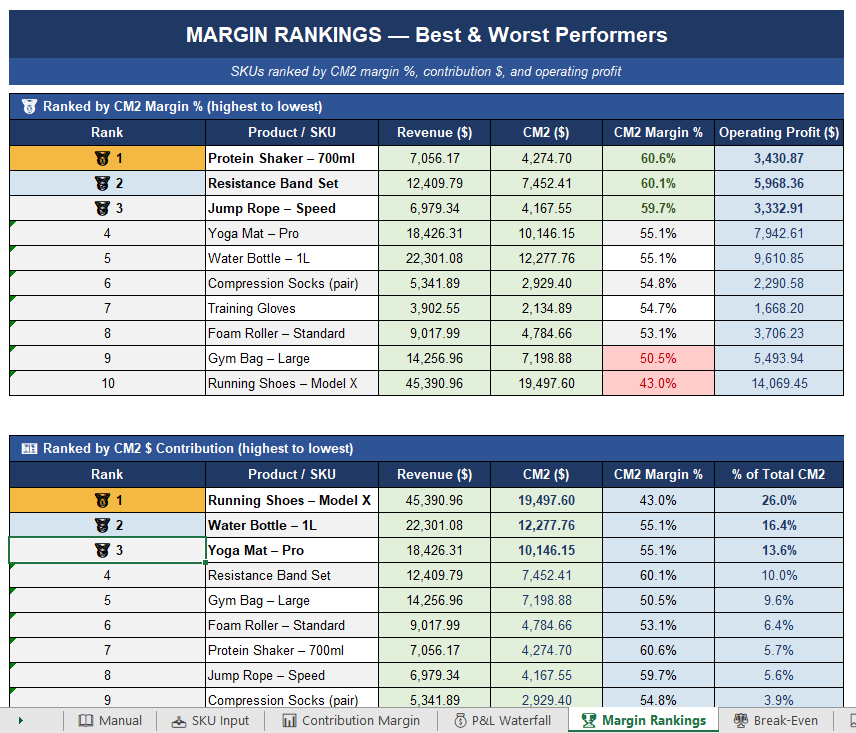
🏆 Margin Rankings — SKUs dynamically ranked by CM2 margin % and CM2 $ contribution. Best performers get a medal 🥇. Worst performers highlighted automatically.
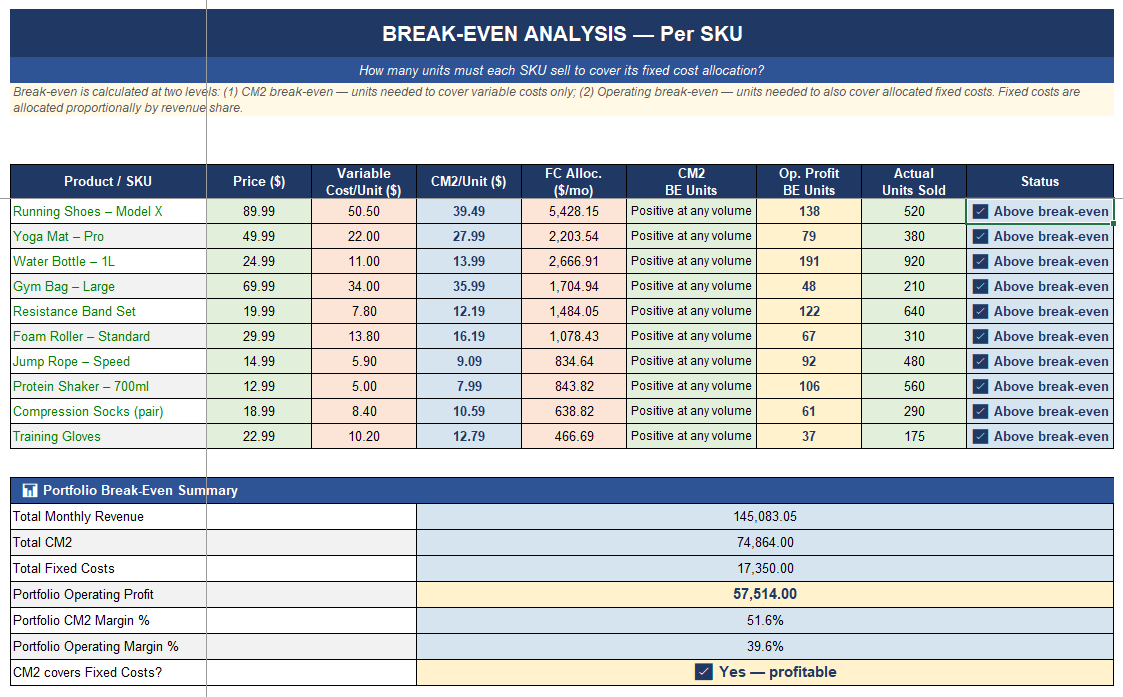
⚖️ Break-Even Analysis — Per-SKU break-even units (how many must you sell to cover fixed costs?), compared to actual sales, with ✅ / ⚠️ / ❌ status. Portfolio break-even verdict included.
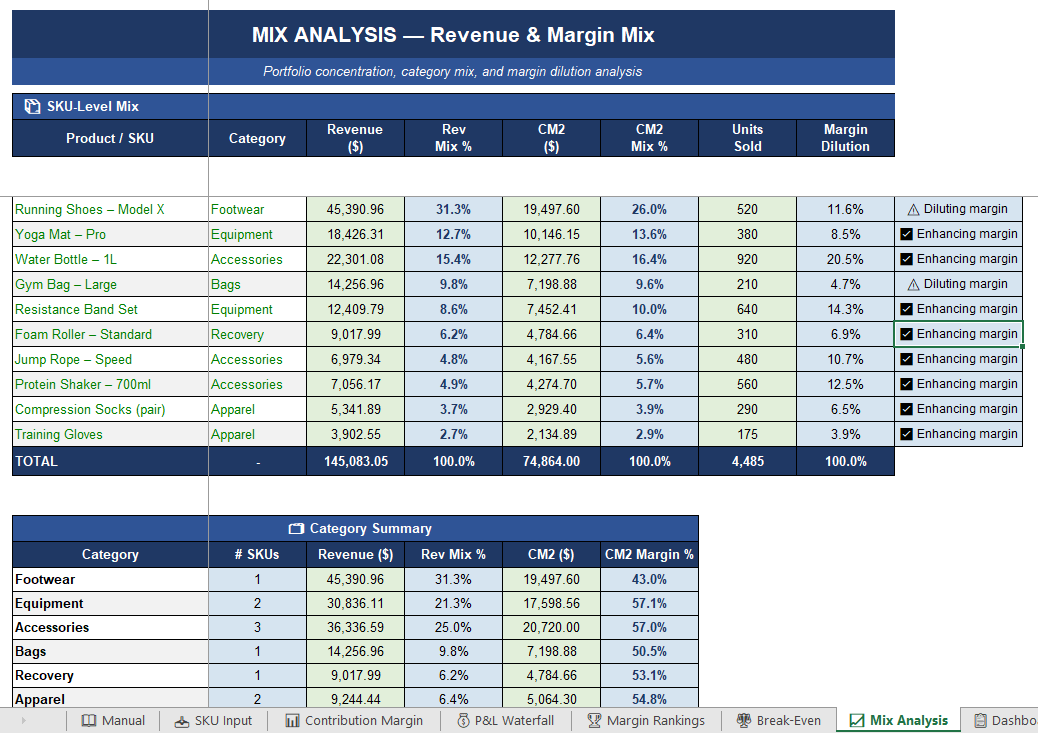
📈 Mix Analysis — Revenue mix, CM2 mix, and unit mix by SKU. Automatically flags products that are diluting your portfolio margin vs those enhancing it. Category-level summary included.
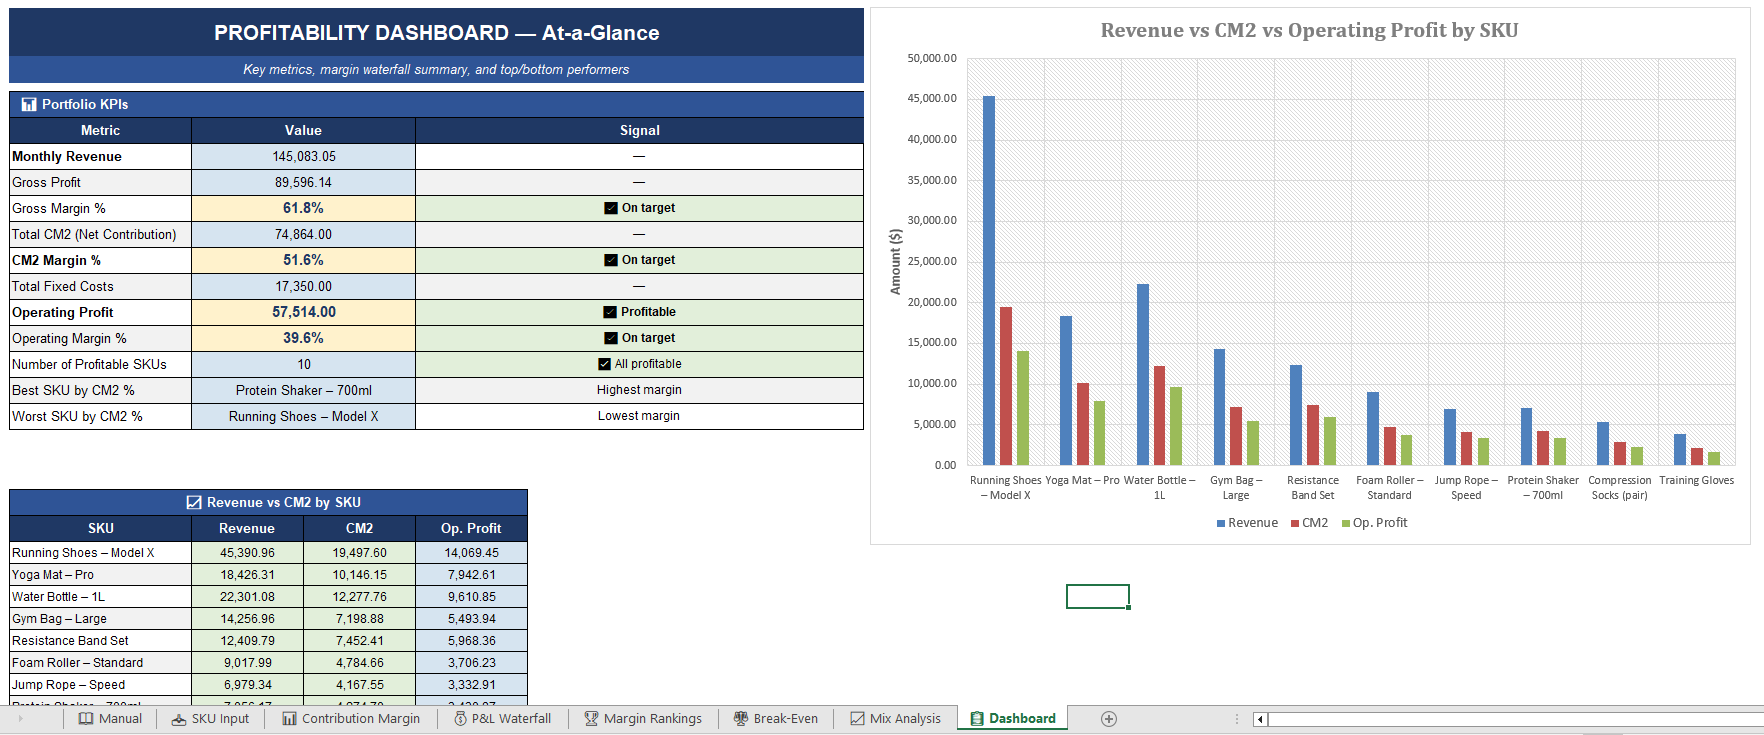
📋 Dashboard — 11 KPI metrics with benchmark targets and traffic-light signals, plus a revenue vs margin vs operating profit chart by SKU.
📖 Manual — Plain-English guide to every metric, cost entry rule, and formula.
━━━━━━━━━━━━━━━━━━━━━━━━
WHO IT'S FOR
→ E-commerce store owners who want to know which products to invest in and which to cut
→ Category managers building a monthly profitability review
→ Small business owners preparing a financial summary for a bank, investor, or partner
→ Consultants running a margin audit for a retail client
→ Anyone who has ever suspected that one of their products is quietly losing money
━━━━━━━━━━━━━━━━━━━━━━━━
WHY IT'S DIFFERENT
Most P&L templates stop at gross margin. This one goes further — it deducts fulfilment, returns, and a proportional share of fixed costs to show you the true operating profit of every SKU. The margin dilution flag alone is worth the price: it instantly shows you which products are dragging down your portfolio average.
No subscription. No software to install. No data uploaded anywhere. Just Excel.
━━━━━━━━━━━━━━━━━━━━━━━━
REQUIREMENTS
Microsoft Excel 2016 or later (Windows or Mac). Not tested in Google Sheets.
Supports up to 10 SKUs out of the box.
This Best Practice includes
1 Excel file.
