Publication number: ELQ-16921-1
View all versions & Certificate

Mutual Funds Data Pakistan
This file contains the data of mutual funds and their returns from 01-Jul-2025 to 27-Apr-2026.
 by Irfan Rashid
Deputy Director and Central Banker | Public Policy Specialist | Leveraging Data Analytics for Economic Governance.Follow
Further information
This interactive analyzer is designed to bridge the gap between raw data and actionable investment insights. Here are the specific details to help potential users understand its utility on Eloquens:
Objectives of the Tool
The primary goal of this dashboard is to provide a centralized, visual interface for evaluating mutual fund performance. Key objectives include:
Performance Benchmarking: To allow investors and analysts to compare individual fund returns against the category average and sector leaders.
Compliance Screening: To quickly isolate Shariah-compliant funds from conventional ones for faith-based or mandate-specific investing.
Risk-Return Identification: To instantly identify performance outliers—the highest and lowest earners—within a specific rating or sector.
Data Summarization: To transform large datasets into a scannable "one-page" executive summary.
This Best Practice is most effective when:
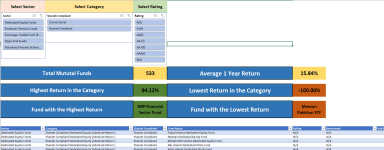
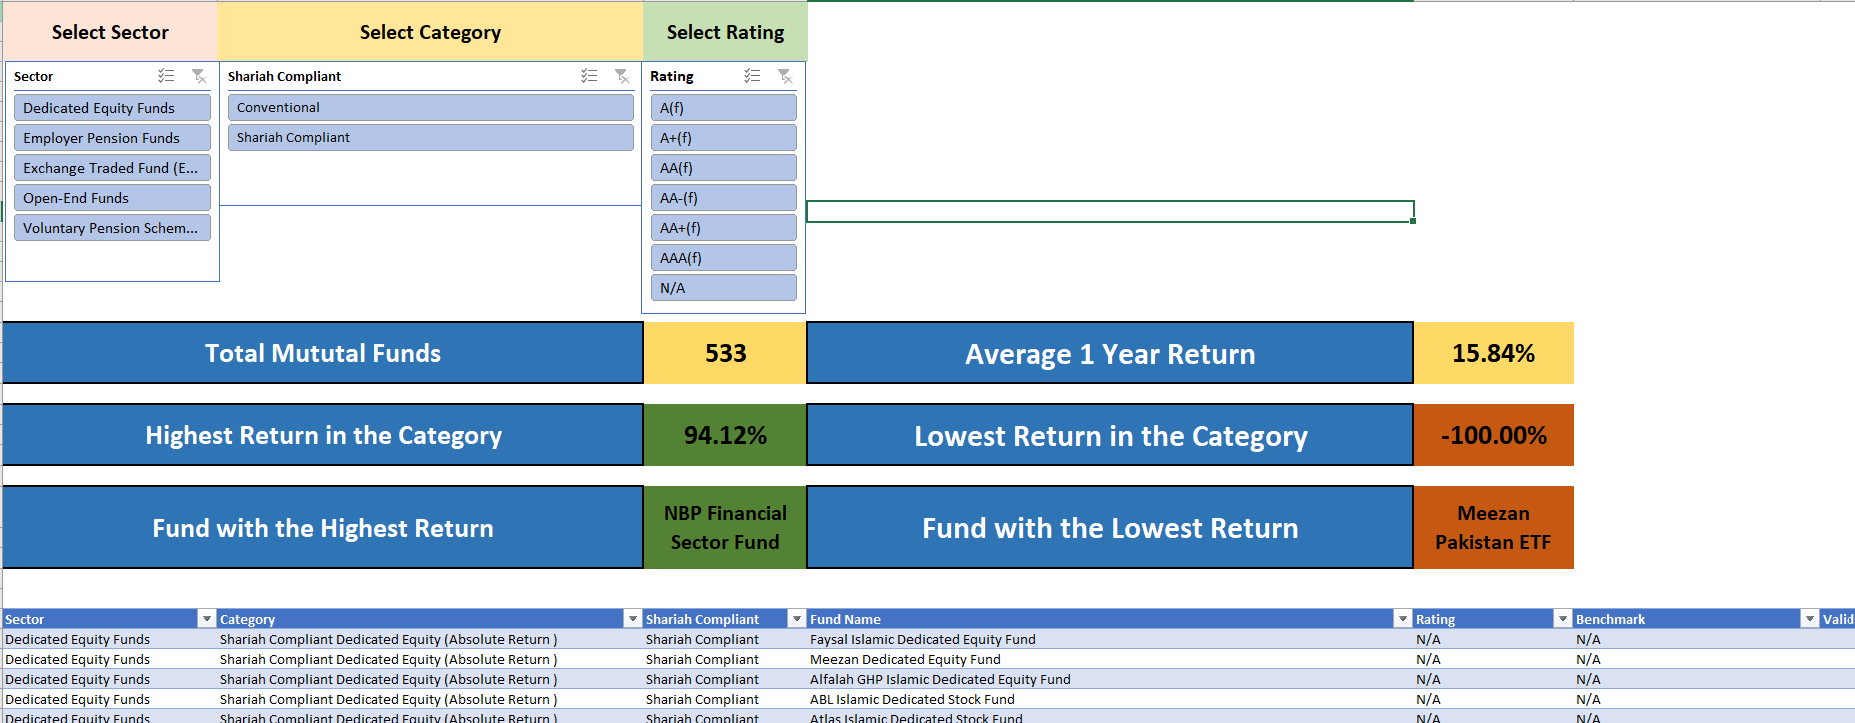
Analyzing High-Volume Datasets: It is built to handle hundreds of funds (as seen with the 533-fund count) without losing performance clarity.
Multi-Criteria Filtering: It works best when the user needs to apply several "nested" filters simultaneously, such as "Shariah Compliant" + "Dedicated Equity" + "Rating AA+."
Periodic Performance Reviews: It is ideal for monthly or quarterly updates where the underlying data changes but the analytical framework remains the same.
This tool may not be the optimal choice in the following scenarios:
Real-Time Intra-Day Trading: Excel-based dashboards are generally designed for static or periodic data; they do not typically support live, tick-by-tick market feeds without advanced API integration.
Deep-Dive Qualitative Analysis: While it provides excellent quantitative "what" (returns, ratings), it does not provide the "why" (fund manager commentary, economic outlooks, or portfolio holdings detail).
Complex Portfolio Optimization: If the objective is to run Monte Carlo simulations or calculate Efficient Frontiers, a more robust statistical tool or dedicated portfolio management software would be required.
