

Originally published: 07/02/2023 10:29
Publication number: ELQ-37455-1
View all versions & Certificate
Publication number: ELQ-37455-1
View all versions & Certificate

Boutique Hotel Financial Model Excel Template
The Template is perfectly designed for startups involved in the boutique hotel business and wants to know the company’s future projections.
Our mission is to be the industrial leader and pioneer in our business domainFollow 17
boutiqueboutique hotelfinancial modelfinancial modelingexcel modelstatement financial modelexcel template
Description
The market size of the Boutique Hotels industry is expected to increase in 2023, meaning that the demand for the service will increase, hence if you are considering starting the Boutique Hotel, this is the perfect time for you to enter the market and gain potential customers. if you are worried about the financials, how to get investors on board, and your company’s valuation, then the Boutique Hotel Financial Model Excel Template is perfect for understanding your future Financials, investment requirements, and Valuation of the company. You do not need to have excel and financial expertise to use this model, as the template is designed so that you don’t have to create formulas, you need to insert the data in peach-filled columns. The model will update the calculation based on your entered data.
The Boutique Hotel Financial Model Excel Template contains the following sheets.
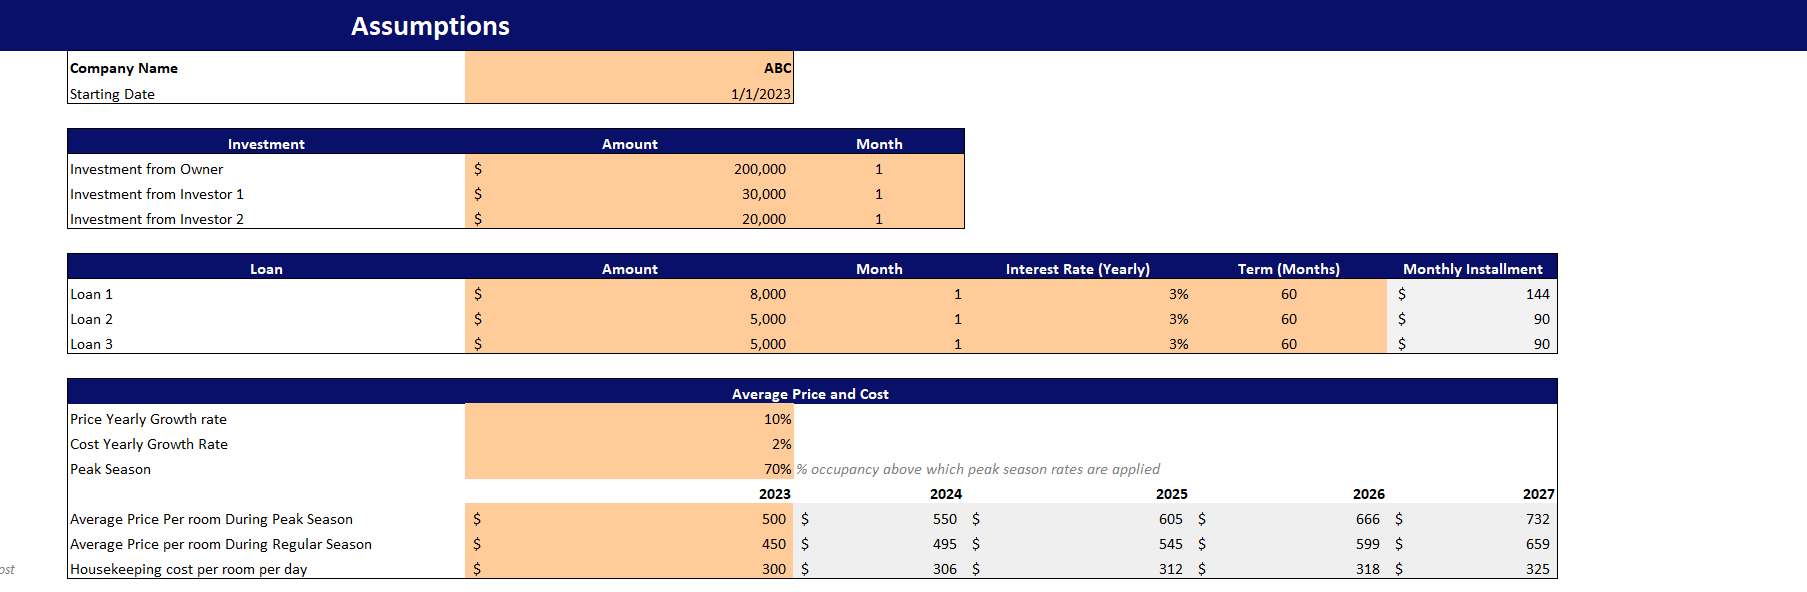
Assumptions
The Assumption sheet is the basis of the entire model. It contains boutique hotels’ investments, loans, revenue, and cost assumptions. You have to enter the data in peach-filled columns to get accurate results for your company.
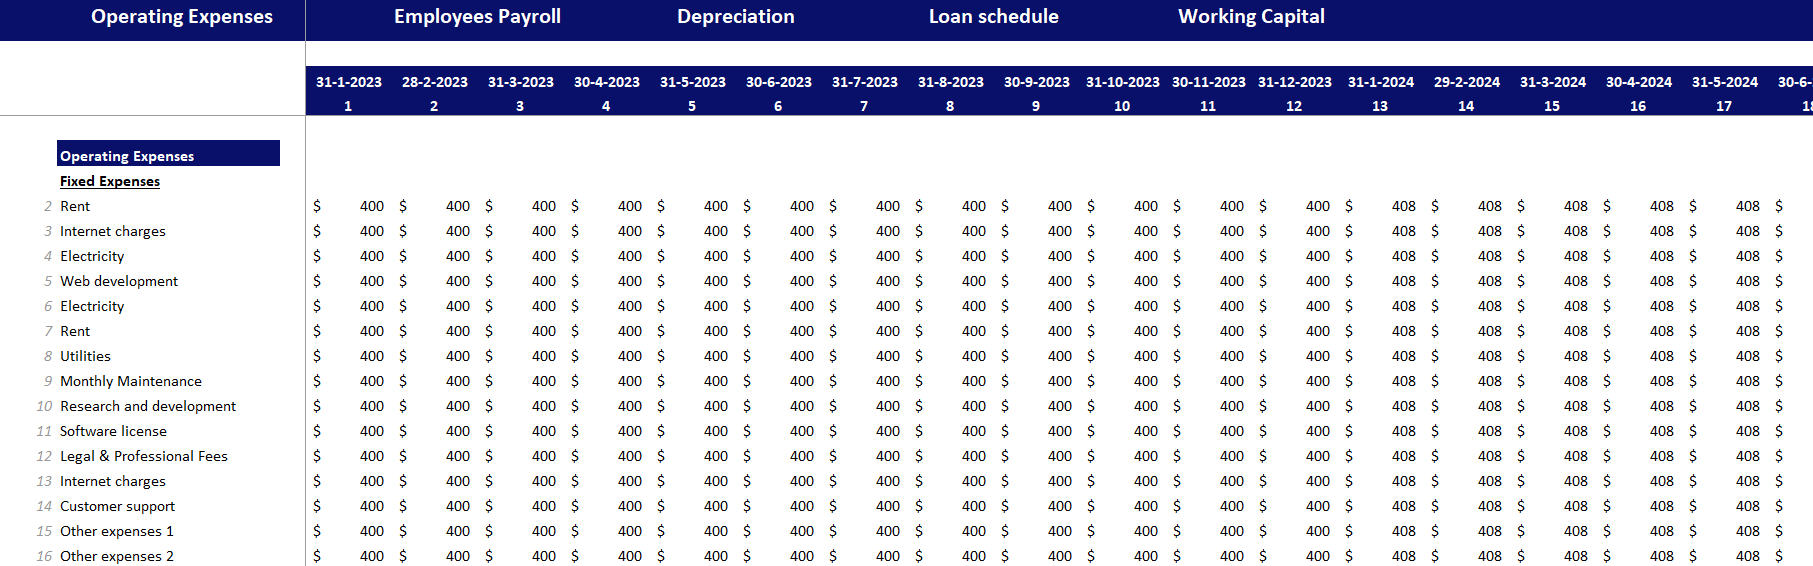
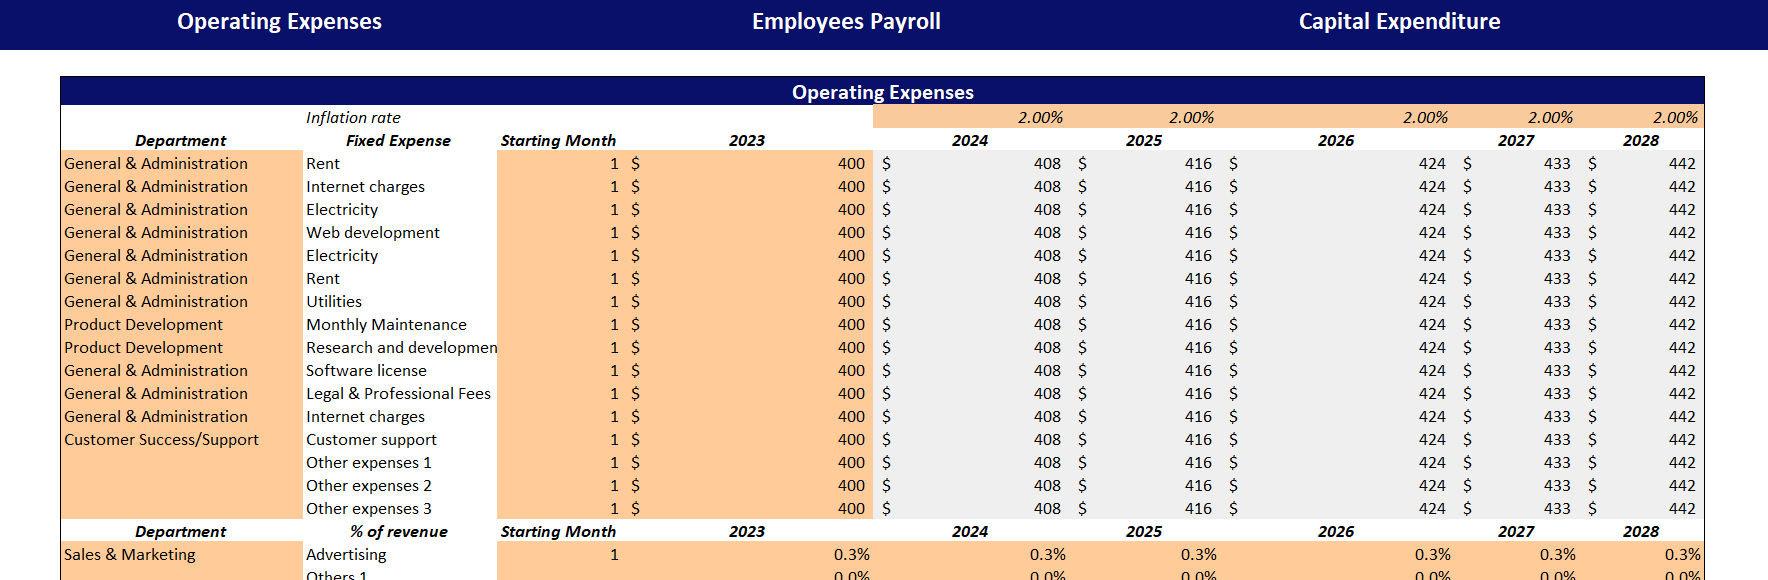
Expenses-Input
The expenses-Input contains the assumptions related to expenses like Operating expenses, Employees Payroll and Capital Expenditure. Enter the data in peach filled column only. Apart from the Assumption and Expenses–Input, all other sheets have linked calculations. Just go through other sheets and do not change the data.
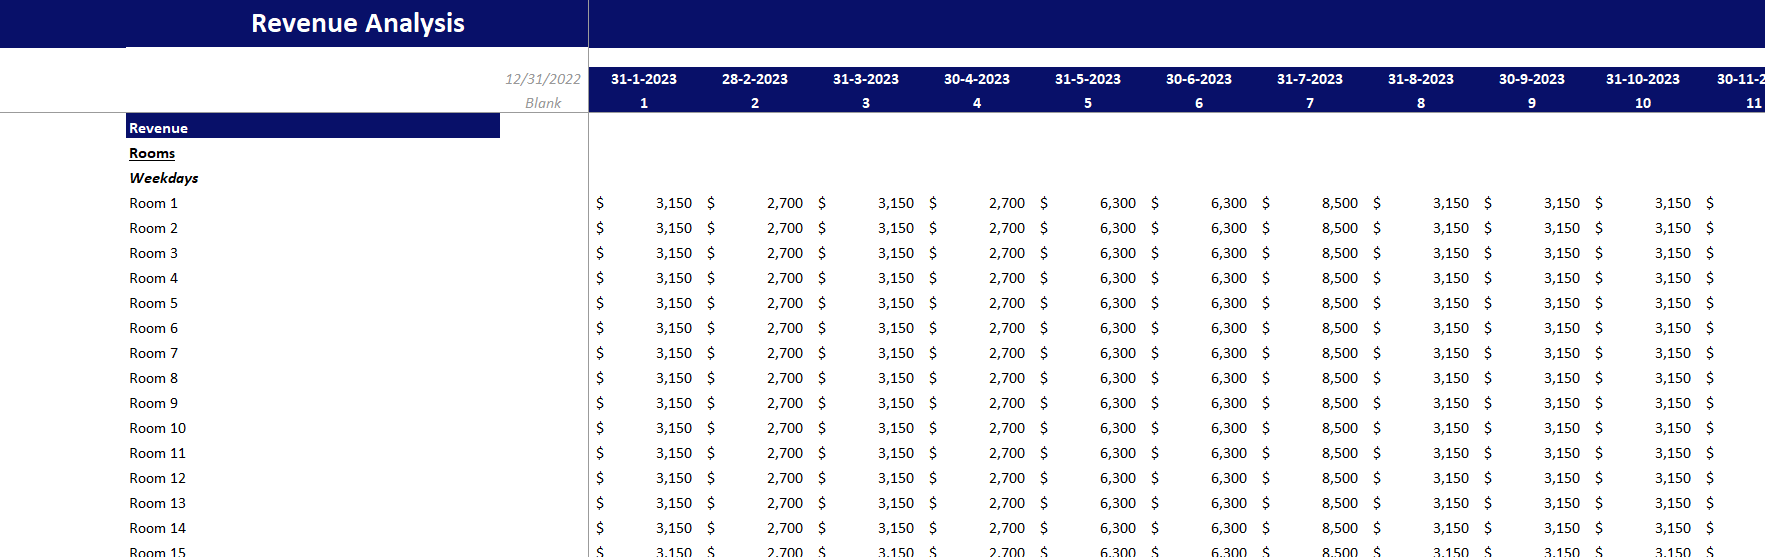
Revenue Analysis
The Revenue analysis sheet estimates the occupancy rate, occupied rooms, revenue from rooms, Food Services, In-room Entertainment/Additional Services, and the cost of sales of the same categories.
Supporting Details
The supporting Detail sheet contains all the calculations needed to make the Financial Statement: operating expenses, Employee payroll, depreciation, loan, and working capital Calculation.
Financial Statements
The Financial Statement sheet has three main Financial Statements Calculations monthly and yearly.
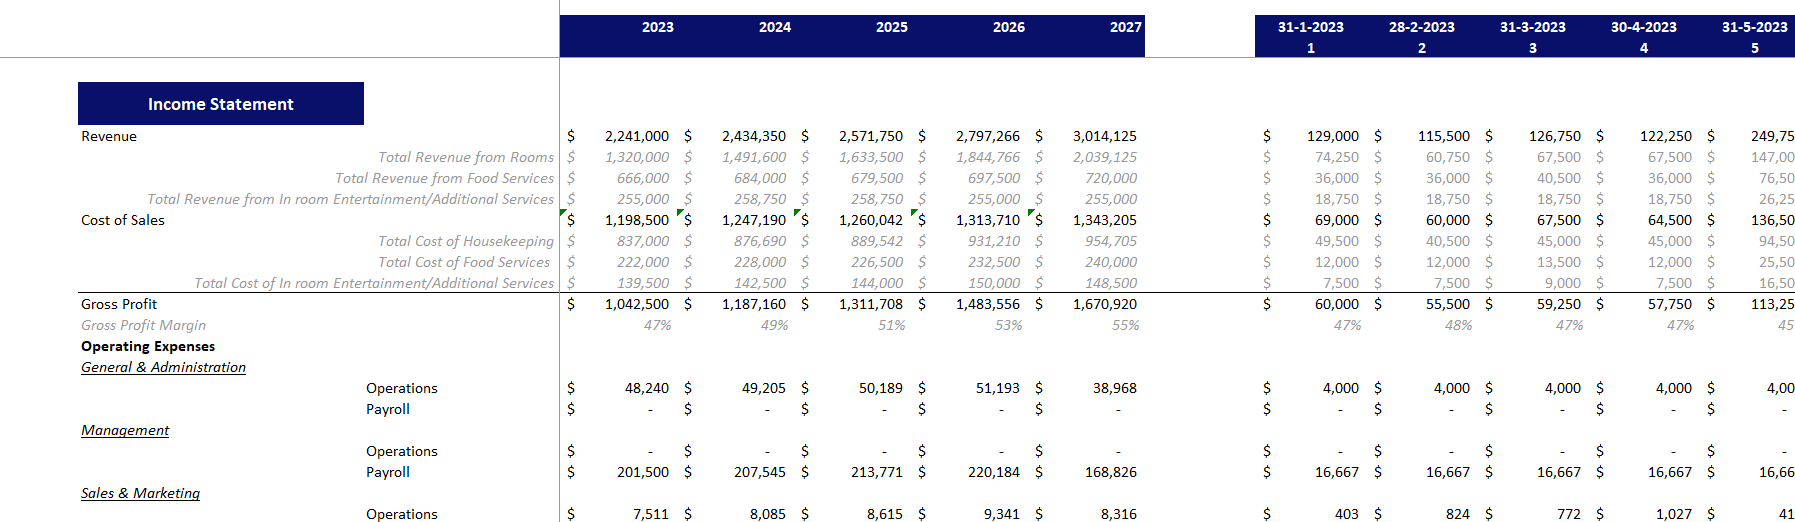
– Income Statement
The income statement estimates the profitability of the company. It shows the Revenue and cost of the main categories down to the Net Profit. The Profitability margins from gross profit margin to net profit margin are also incorporated in the income statement to get a clear picture in percentage terms.
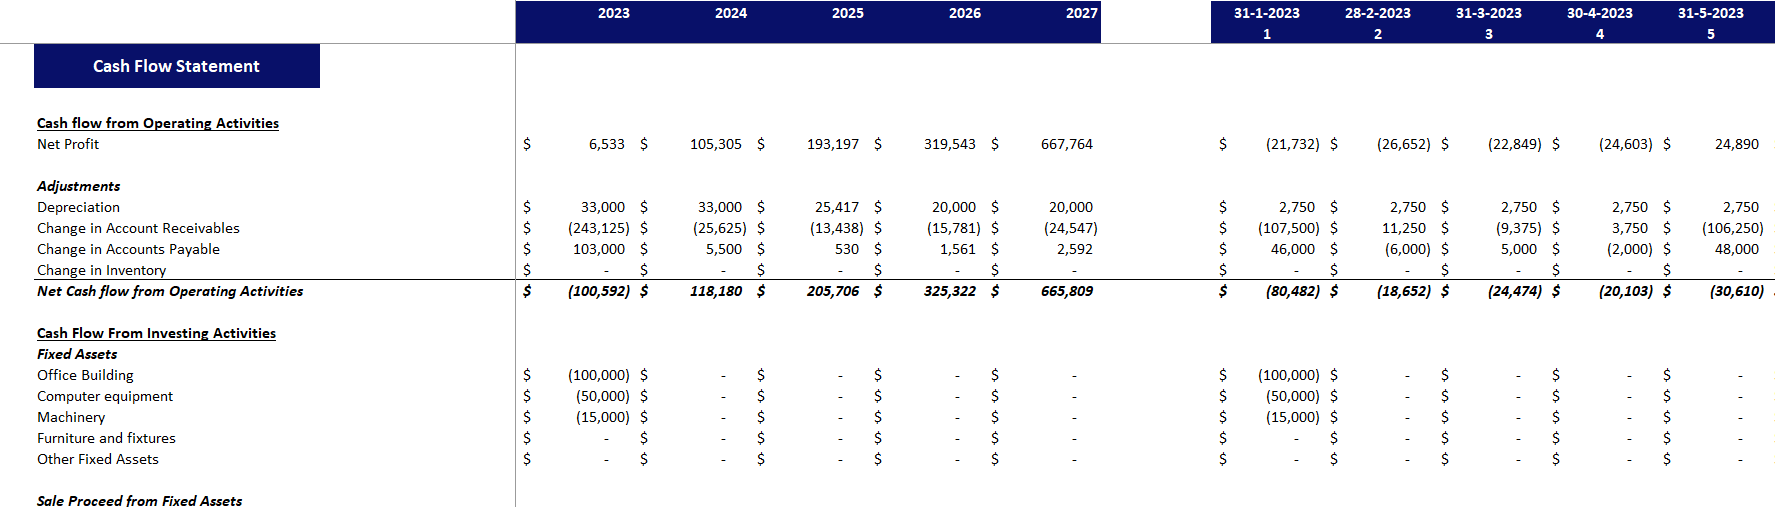
– Cashflow Statement
The Cashflow Statement estimates the cash you will generate from operating, Investing, and Financing activities and, lastly, the Net Cash available in the company. It evaluates how efficiently your company manages its cash position.
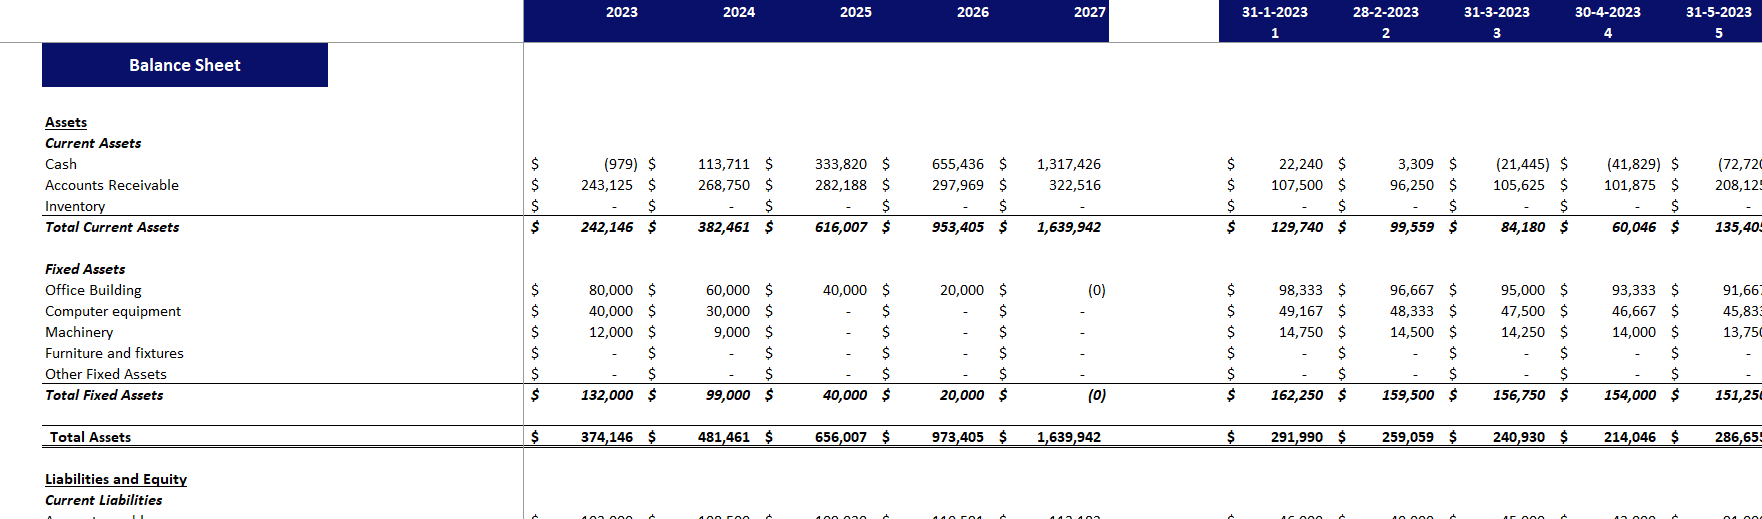
– Balance Sheet
A balance sheet summarizes a business, giving you the company’s financial position, like how many assets, liabilities, and the equity you have in your company.
Financial Analysis
The Financial Analysis section estimates the following:
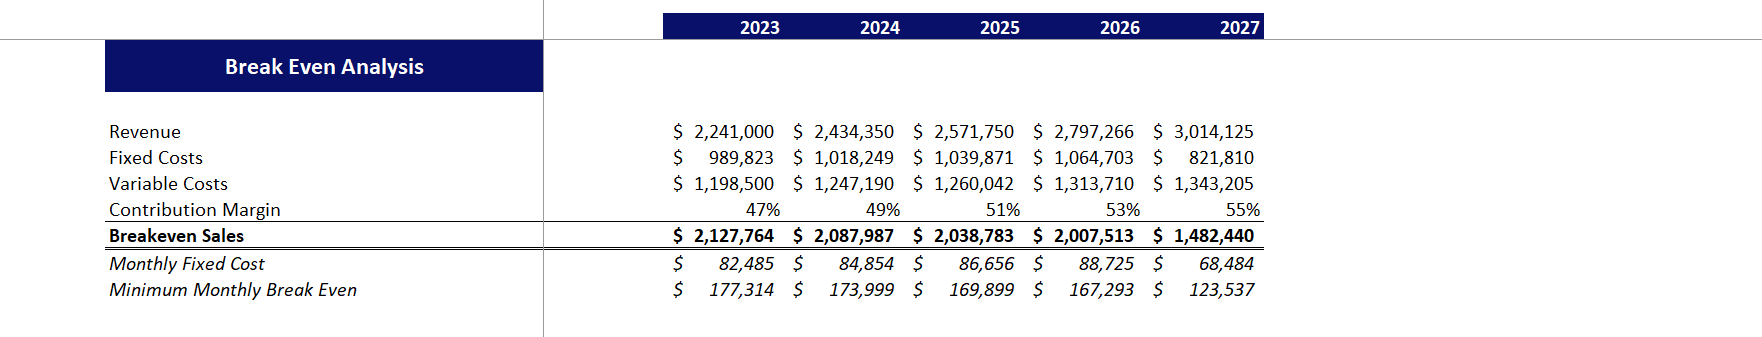
– Breakeven Analysis
The breakeven analysis estimates the sales needed to reach the no-profit, no-loss situation.
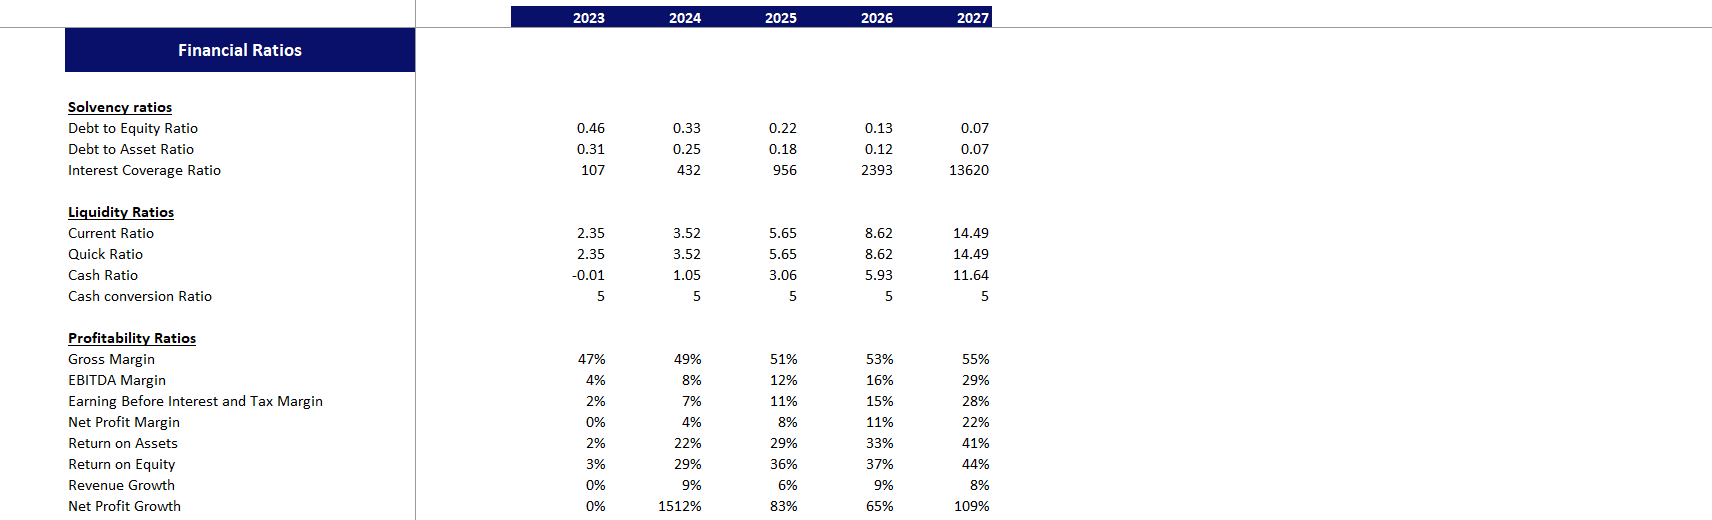
– Financial Ratios
The Financial Ratio section estimates solvency, liquidity, profitability, and efficiency ratios to understand the company’s performance better. You can also compare your ratios with your industry benchmarks.
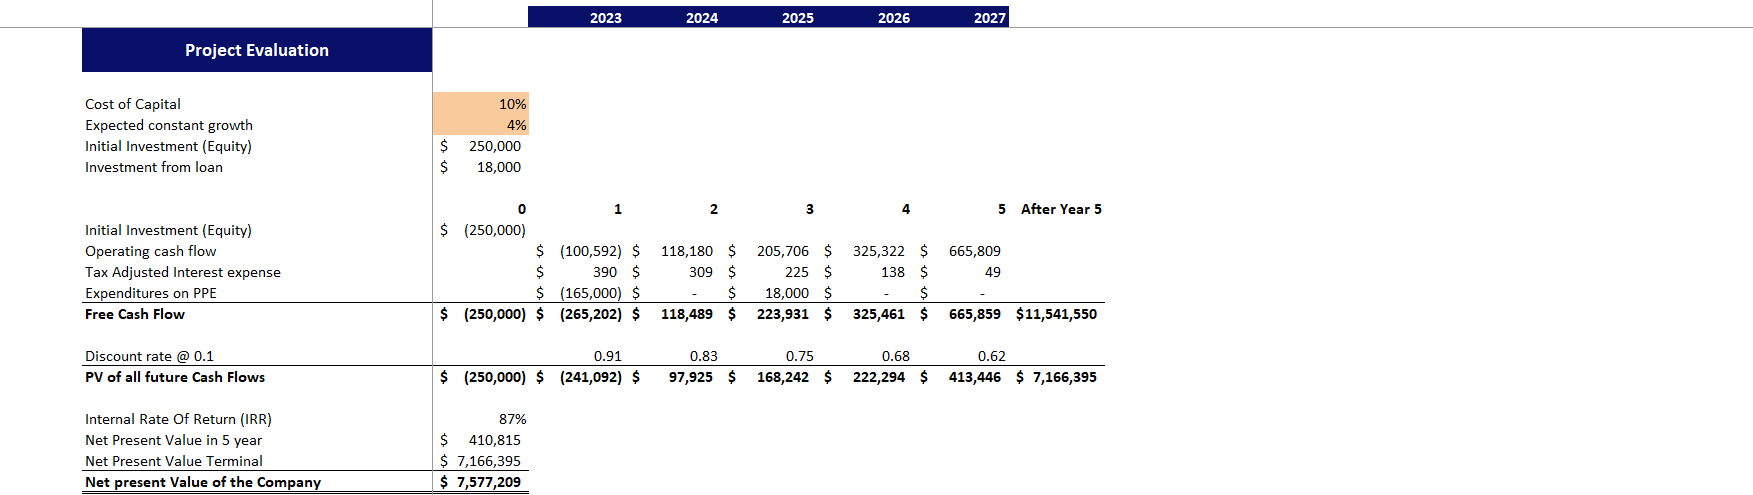
– Project Evaluation
The Project Evaluation estimates the Net present value of the company, Internal rate of return, minimum expected equity percentage by investors, investors’ required future value, and equity share and payback period.
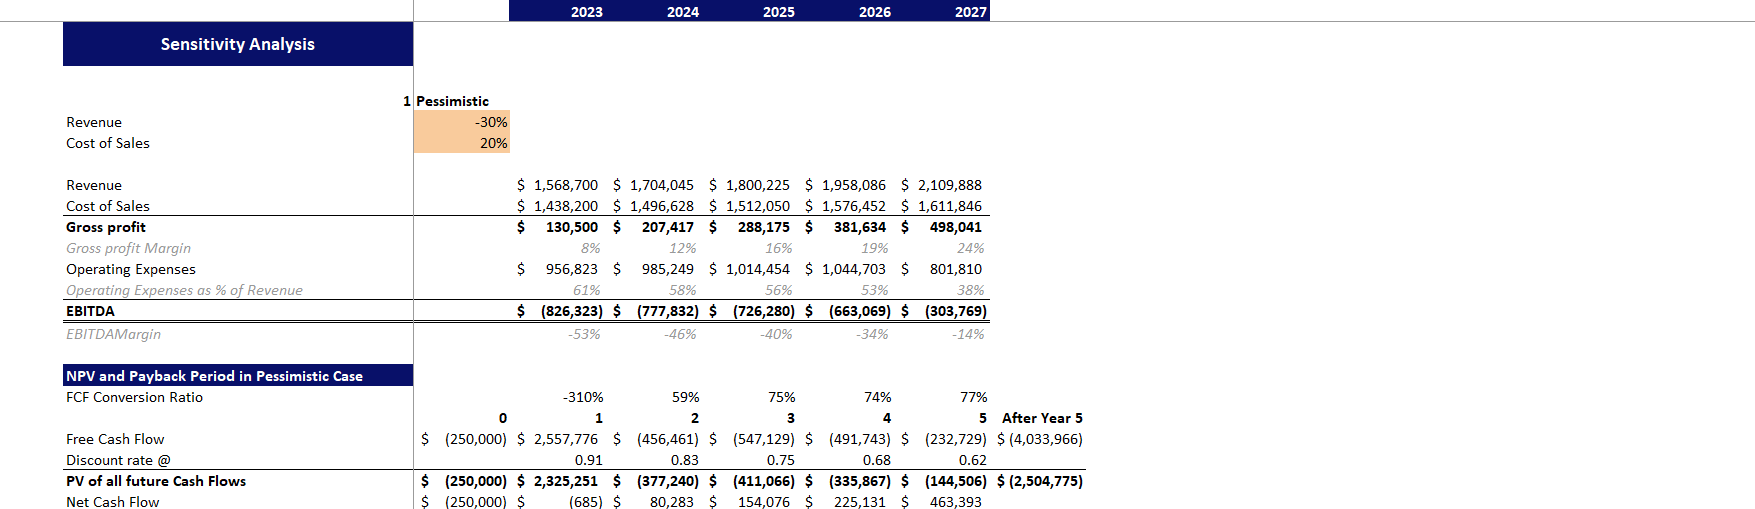
Sensitivity analysis
The sensitivity analysis estimates the company’s income statement heads, NPV, and the Payback period when Revenue and cost of goods sold are changed while keeping the same expense plan. The sensitivity analysis is done in two ways pessimistic and optimistic.
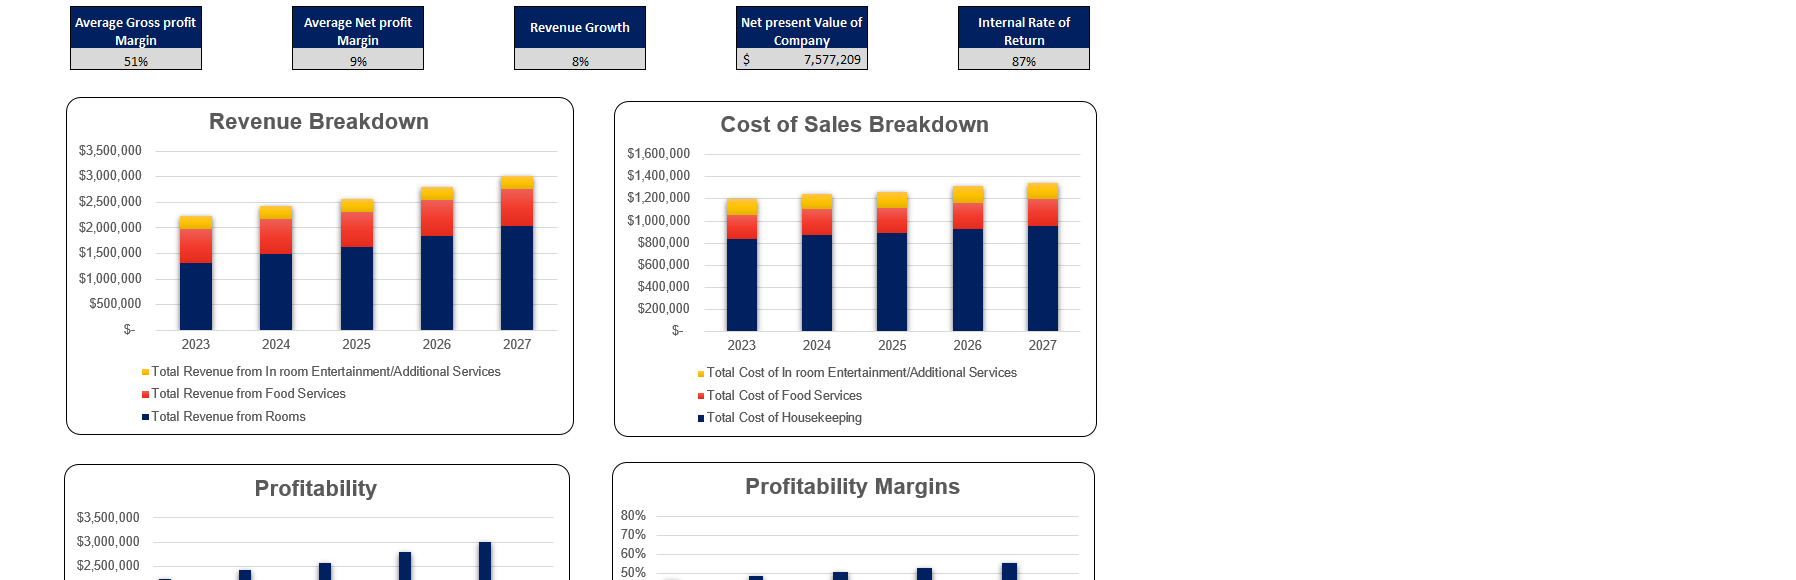
Dashboard
The dashboard provides a graphical representation of your company’s performance. Average gross profit, net profit, and revenue growth are also included in the dashboard to understand your business’s profitability better.
Advantages of this model
The model contains all the necessary calculations and graphs.
Properly integrated data, Change of input will result in a change of the other calculations linked with that input.
Detailed calculations with an accurate and standardized pattern.
Effortless and easy to use, there is no need to create formulas.
Cost-effective, as you don’t need to hire financial experts for financial modeling tasks for your startups.
The market size of the Boutique Hotels industry is expected to increase in 2023, meaning that the demand for the service will increase, hence if you are considering starting the Boutique Hotel, this is the perfect time for you to enter the market and gain potential customers. if you are worried about the financials, how to get investors on board, and your company’s valuation, then the Boutique Hotel Financial Model Excel Template is perfect for understanding your future Financials, investment requirements, and Valuation of the company. You do not need to have excel and financial expertise to use this model, as the template is designed so that you don’t have to create formulas, you need to insert the data in peach-filled columns. The model will update the calculation based on your entered data.
The Boutique Hotel Financial Model Excel Template contains the following sheets.
Assumptions
The Assumption sheet is the basis of the entire model. It contains boutique hotels’ investments, loans, revenue, and cost assumptions. You have to enter the data in peach-filled columns to get accurate results for your company.
Expenses-Input
The expenses-Input contains the assumptions related to expenses like Operating expenses, Employees Payroll and Capital Expenditure. Enter the data in peach filled column only. Apart from the Assumption and Expenses–Input, all other sheets have linked calculations. Just go through other sheets and do not change the data.
Revenue Analysis
The Revenue analysis sheet estimates the occupancy rate, occupied rooms, revenue from rooms, Food Services, In-room Entertainment/Additional Services, and the cost of sales of the same categories.
Supporting Details
The supporting Detail sheet contains all the calculations needed to make the Financial Statement: operating expenses, Employee payroll, depreciation, loan, and working capital Calculation.
Financial Statements
The Financial Statement sheet has three main Financial Statements Calculations monthly and yearly.
– Income Statement
The income statement estimates the profitability of the company. It shows the Revenue and cost of the main categories down to the Net Profit. The Profitability margins from gross profit margin to net profit margin are also incorporated in the income statement to get a clear picture in percentage terms.
– Cashflow Statement
The Cashflow Statement estimates the cash you will generate from operating, Investing, and Financing activities and, lastly, the Net Cash available in the company. It evaluates how efficiently your company manages its cash position.
– Balance Sheet
A balance sheet summarizes a business, giving you the company’s financial position, like how many assets, liabilities, and the equity you have in your company.
Financial Analysis
The Financial Analysis section estimates the following:
– Breakeven Analysis
The breakeven analysis estimates the sales needed to reach the no-profit, no-loss situation.
– Financial Ratios
The Financial Ratio section estimates solvency, liquidity, profitability, and efficiency ratios to understand the company’s performance better. You can also compare your ratios with your industry benchmarks.
– Project Evaluation
The Project Evaluation estimates the Net present value of the company, Internal rate of return, minimum expected equity percentage by investors, investors’ required future value, and equity share and payback period.
Sensitivity analysis
The sensitivity analysis estimates the company’s income statement heads, NPV, and the Payback period when Revenue and cost of goods sold are changed while keeping the same expense plan. The sensitivity analysis is done in two ways pessimistic and optimistic.
Dashboard
The dashboard provides a graphical representation of your company’s performance. Average gross profit, net profit, and revenue growth are also included in the dashboard to understand your business’s profitability better.
Advantages of this model
The model contains all the necessary calculations and graphs.
Properly integrated data, Change of input will result in a change of the other calculations linked with that input.
Detailed calculations with an accurate and standardized pattern.
Effortless and easy to use, there is no need to create formulas.
Cost-effective, as you don’t need to hire financial experts for financial modeling tasks for your startups.
This Best Practice includes
1 Excel File(7 Tabs)
Further information
The Template Contains 5 years of financial projections, including an Income statement, Cashflow Statement, balance sheet, Project valuation, sensitivity Analysis, break-even, and Dashboard.
For boutique hotels
