Originally published: 16/08/2024 11:44
Publication number: ELQ-18222-1
View all versions & Certificate
Publication number: ELQ-18222-1
View all versions & Certificate

Workforce Diversity Dashboard Template
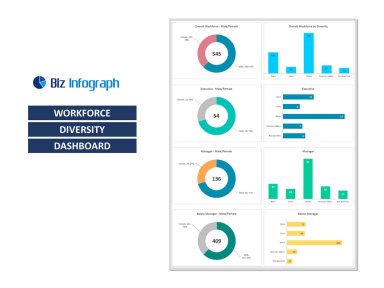
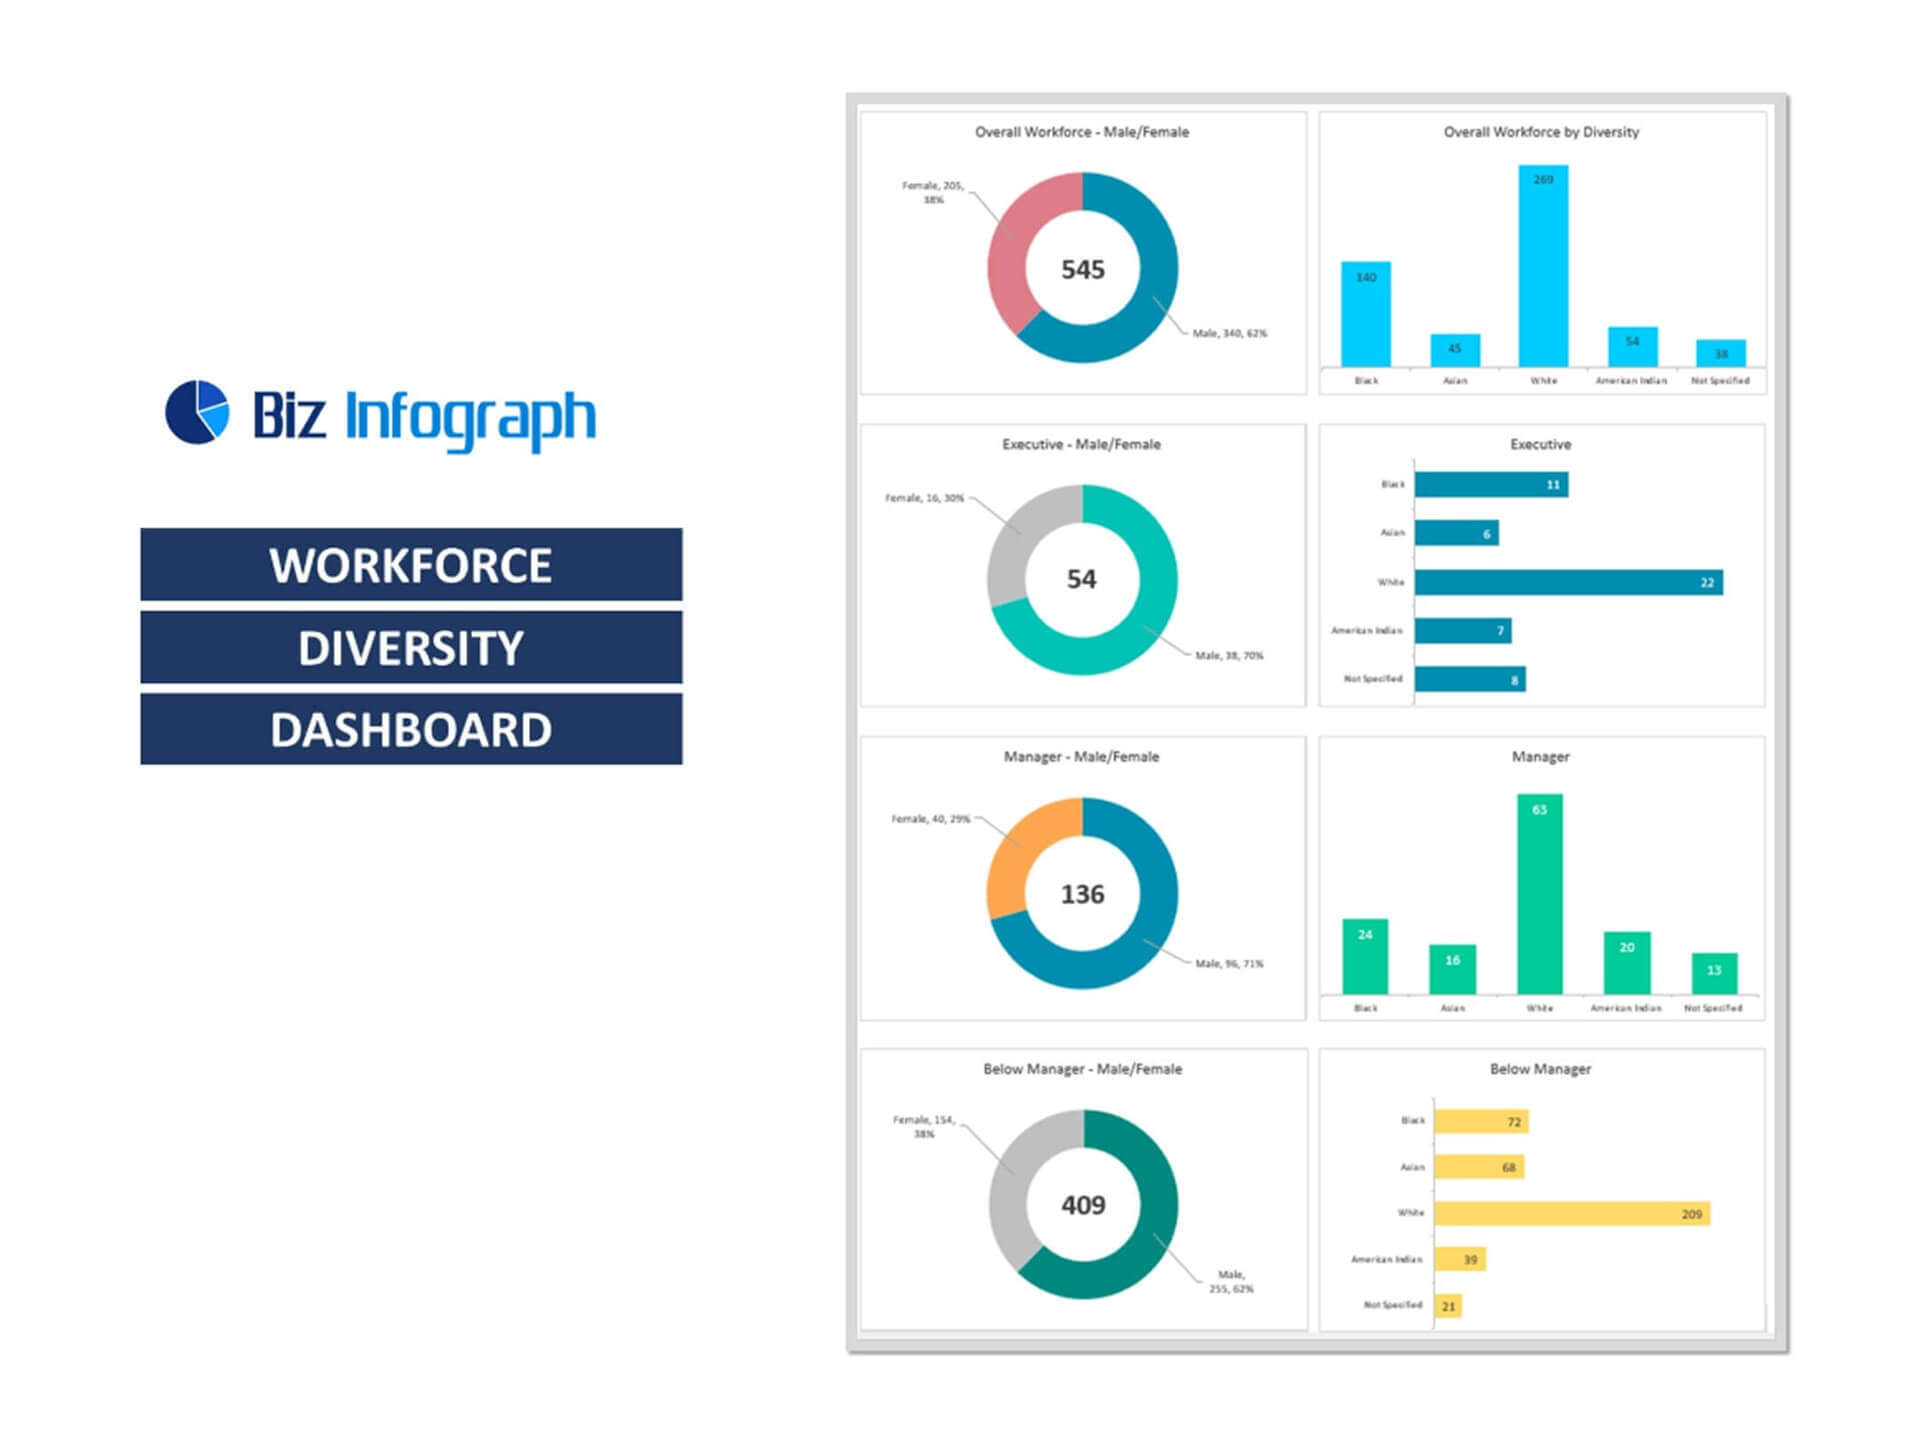
Track HR diversity metrics monthly with an editable, customizable Workforce Diversity Dashboard Excel template.
Biz Infograph is bringing clients a range of high-quality, well-designed, and easy-to-use professionally designed slides and dashboards.Follow 10

workforce diversity dashboardhr dashboardhr google sheetshr google sheets dashboardhr templategoogle sheets templatehuman resource dashboardhr excel dashboard templatehr excel dashboard
Description
HR Workforce diversity dashboard Excel Template and Google Sheets
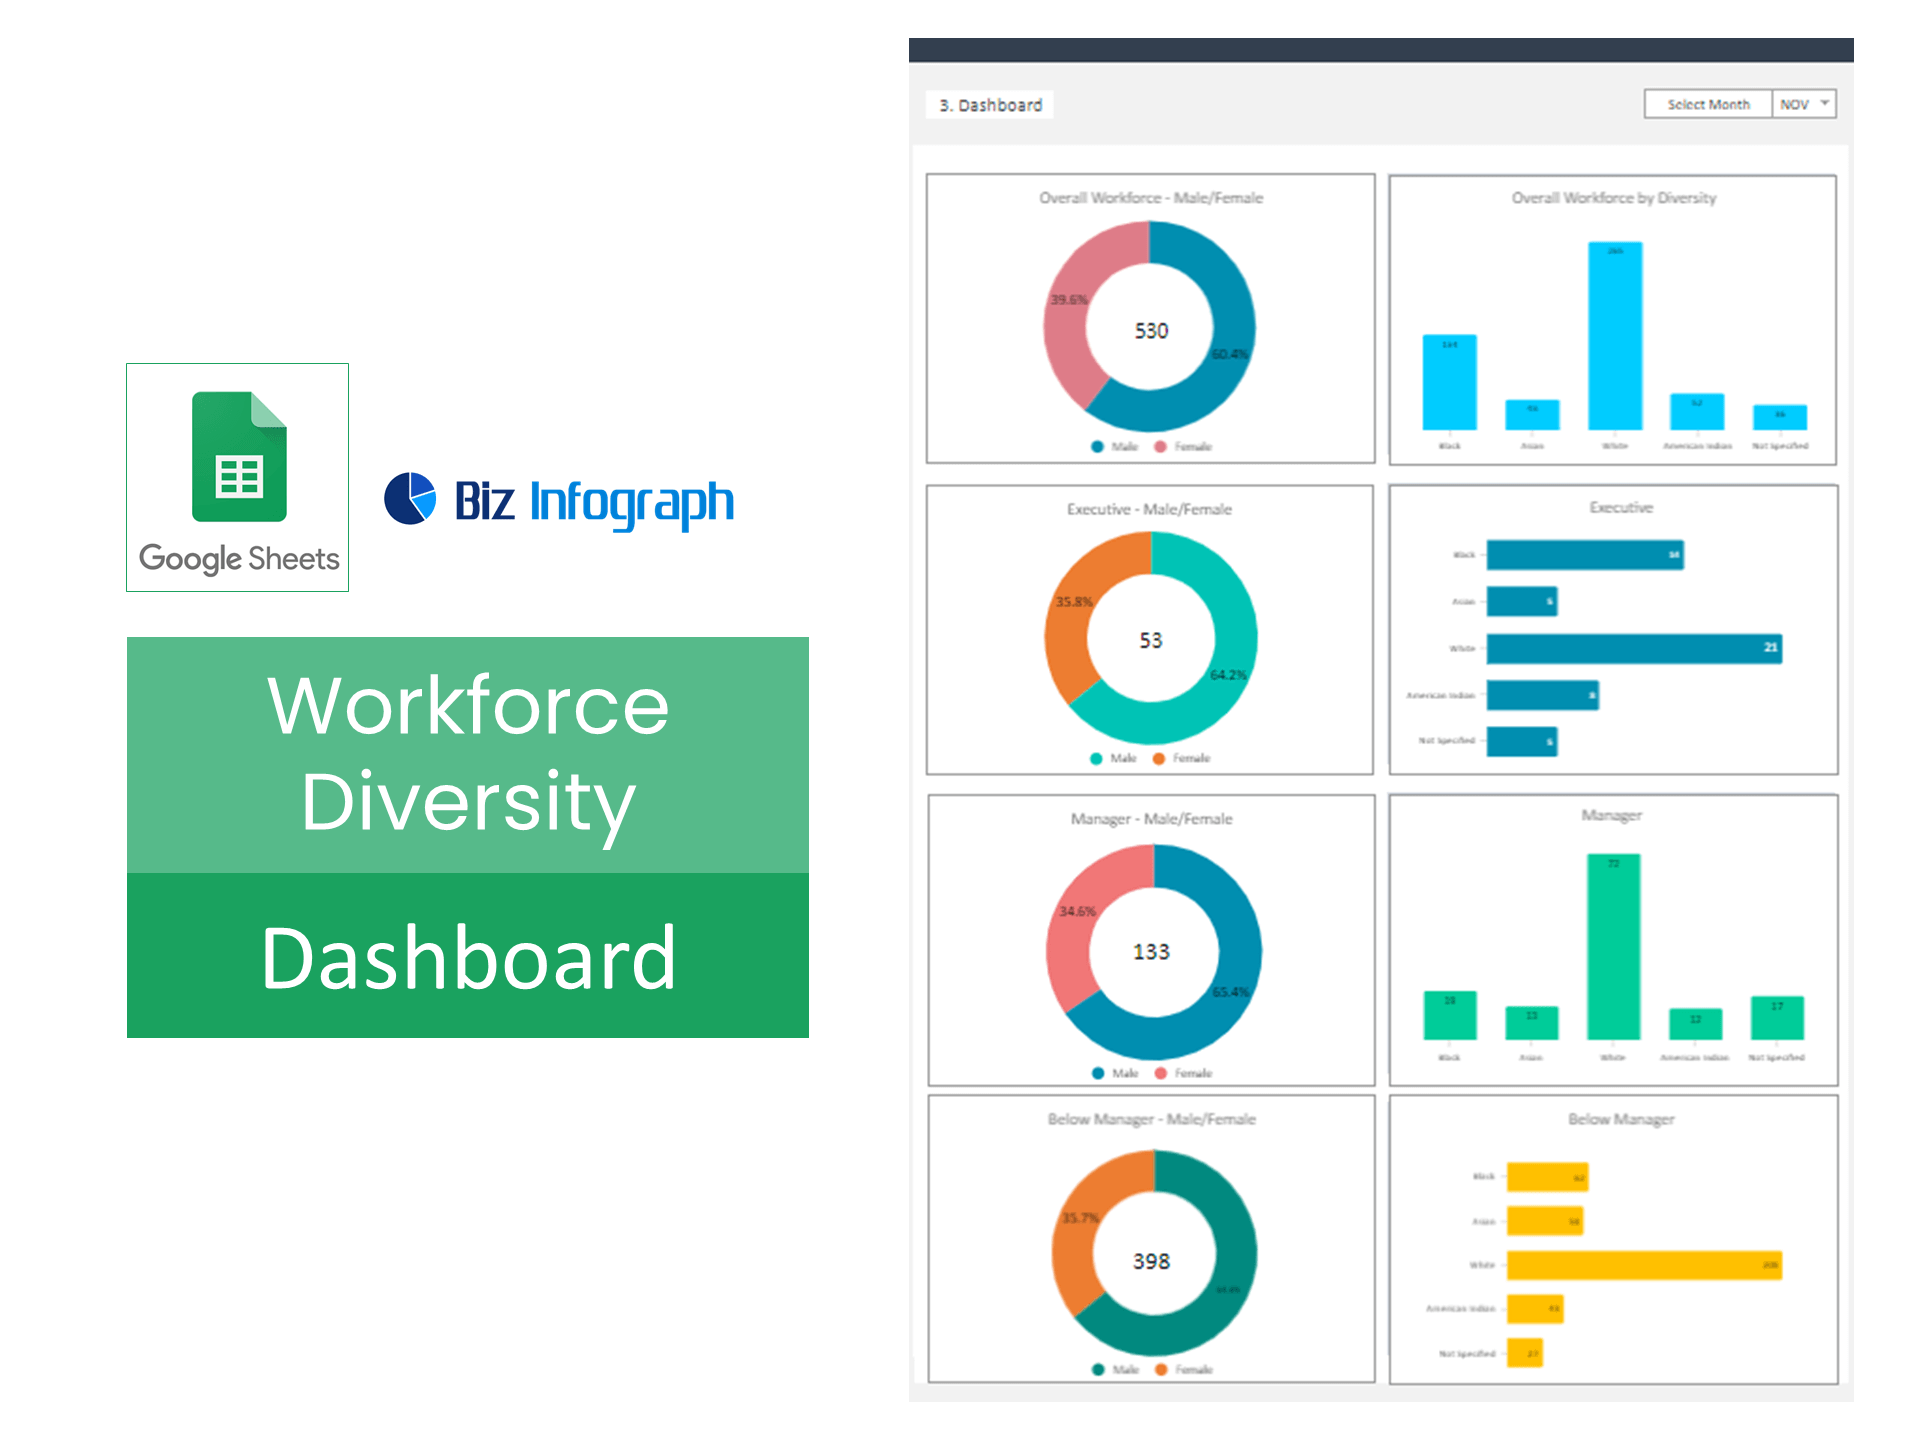
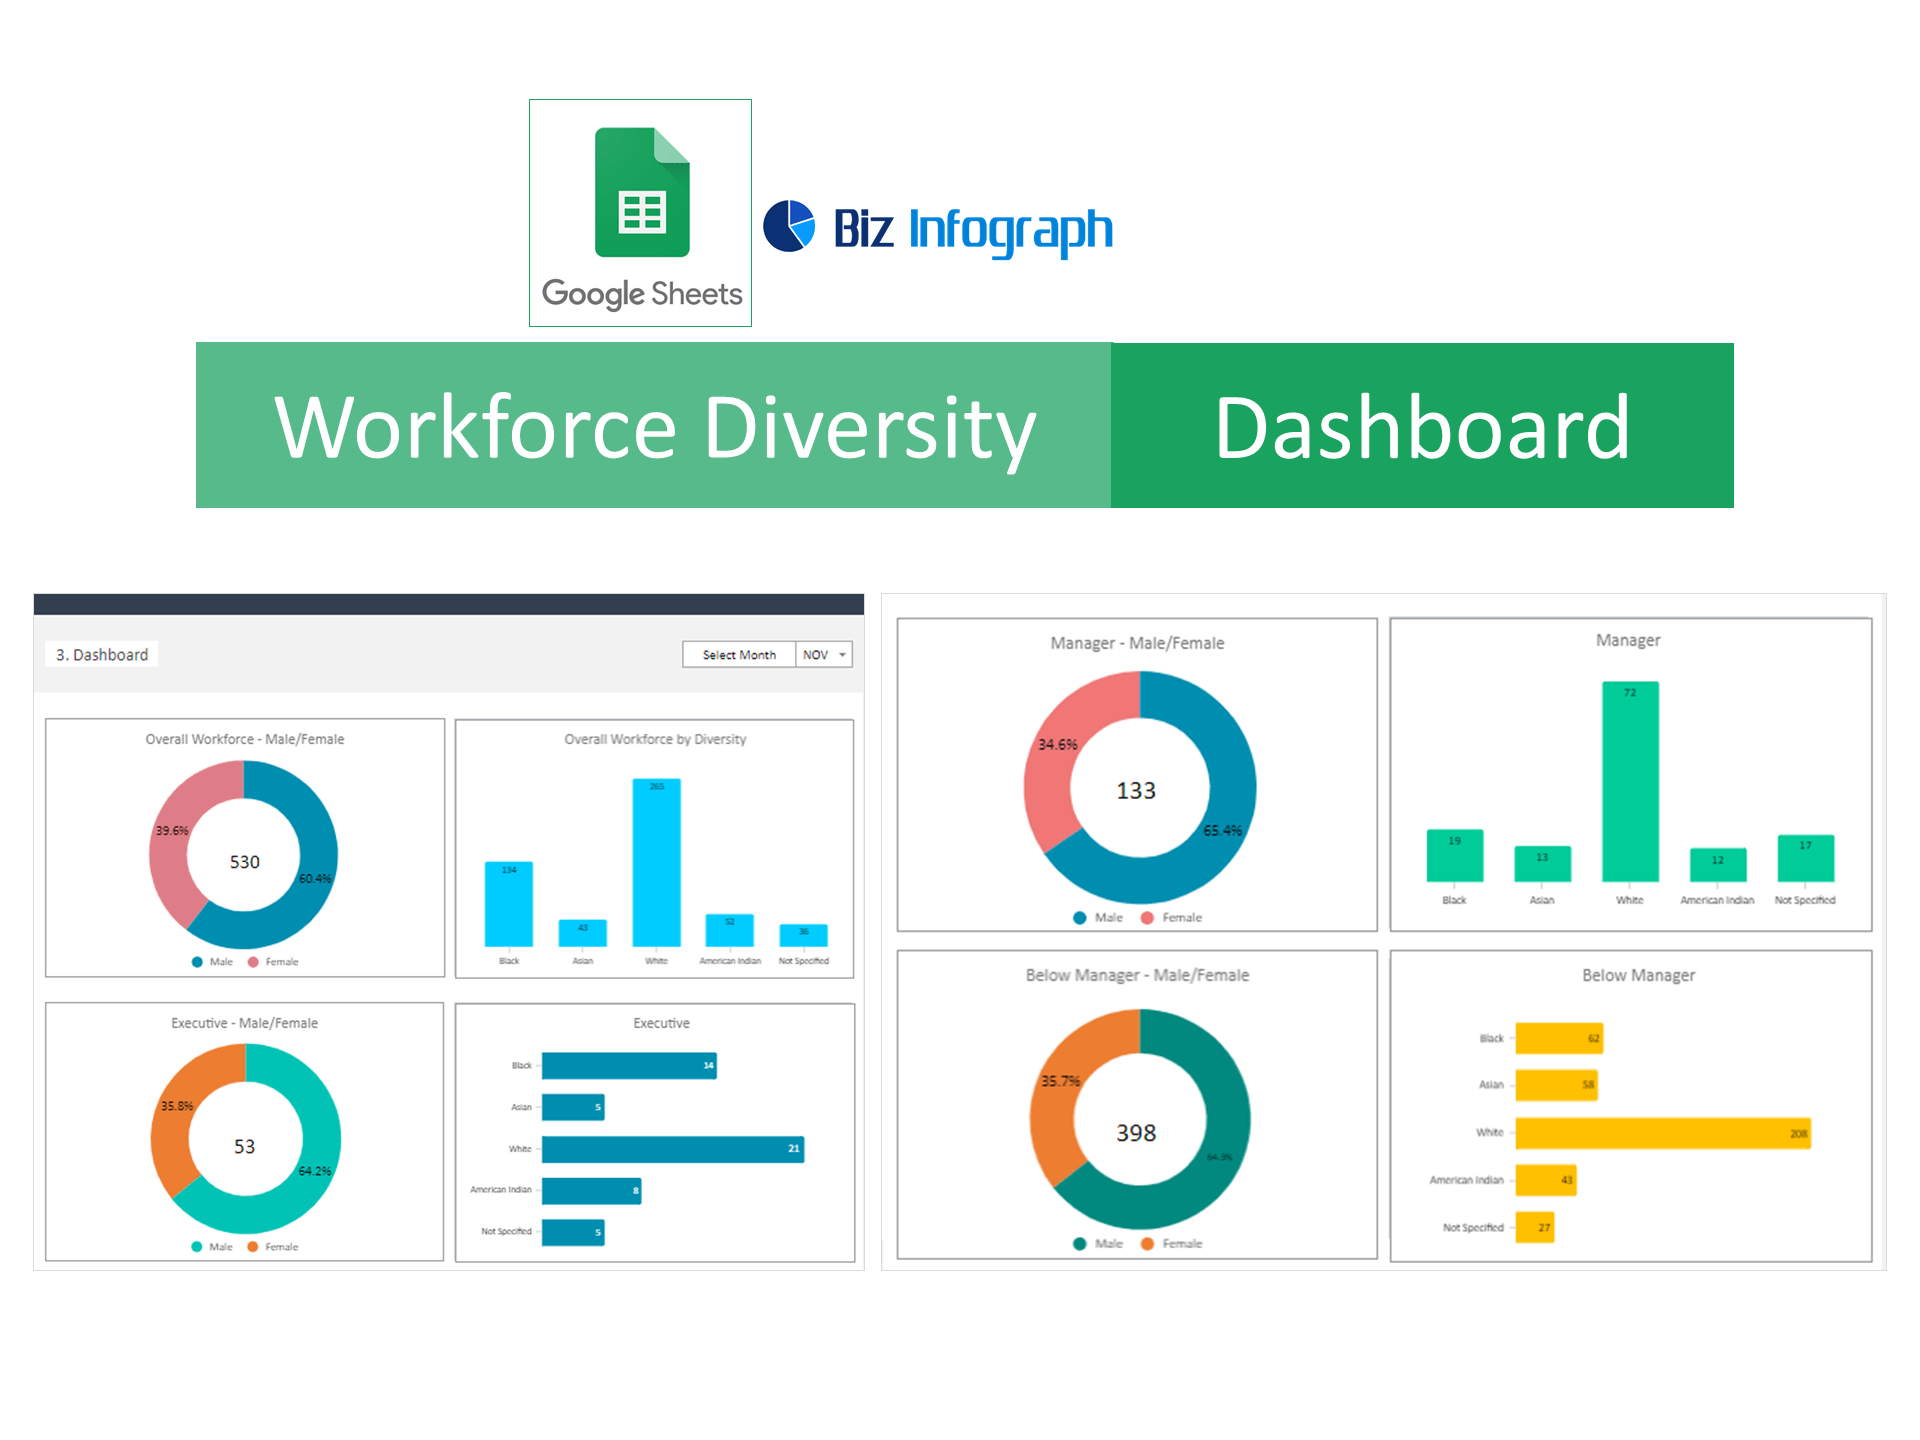
The Workforce diversity dashboard is an excel template (Workforce Diversity Dashboard Google Sheets) which represents a collection of metrics that provides a snapshot of how an organization is performing with respect to diversity and inclusion. The dashboard can help identify areas where the organization needs to focus its efforts to improve diversity and inclusion.
Key Features
HR Workforce diversity dashboard Excel Template and Google Sheets
The Workforce diversity dashboard is an excel template (Workforce Diversity Dashboard Google Sheets) which represents a collection of metrics that provides a snapshot of how an organization is performing with respect to diversity and inclusion. The dashboard can help identify areas where the organization needs to focus its efforts to improve diversity and inclusion.
Key Features
- Monitor HR Diversity indicators progress monthly
- Provide actionable insights
- Fully editable, easy to use, template with sample data
- Eye-catching design and customizable
- Change the sample data with your data
- Spreadsheets ready for printing without Biz Infograph logo
- Consolidate key business performance indicators in one dashboard
- No monthly fees
- Immediate download
- No VBA, no Macro
- No installation necessary
- Professionally designed
- Ready dashboard just plug your data and start using. The dashboard will be ready instantly.
- A guide to unlocking all the elements in the dashboard
- Video tutorial guide on how to navigate and use each Dashboard Template
- Professional service to customize dashboard template in excel as per business need
- Help and support in post-purchase
- Open the dashboard template
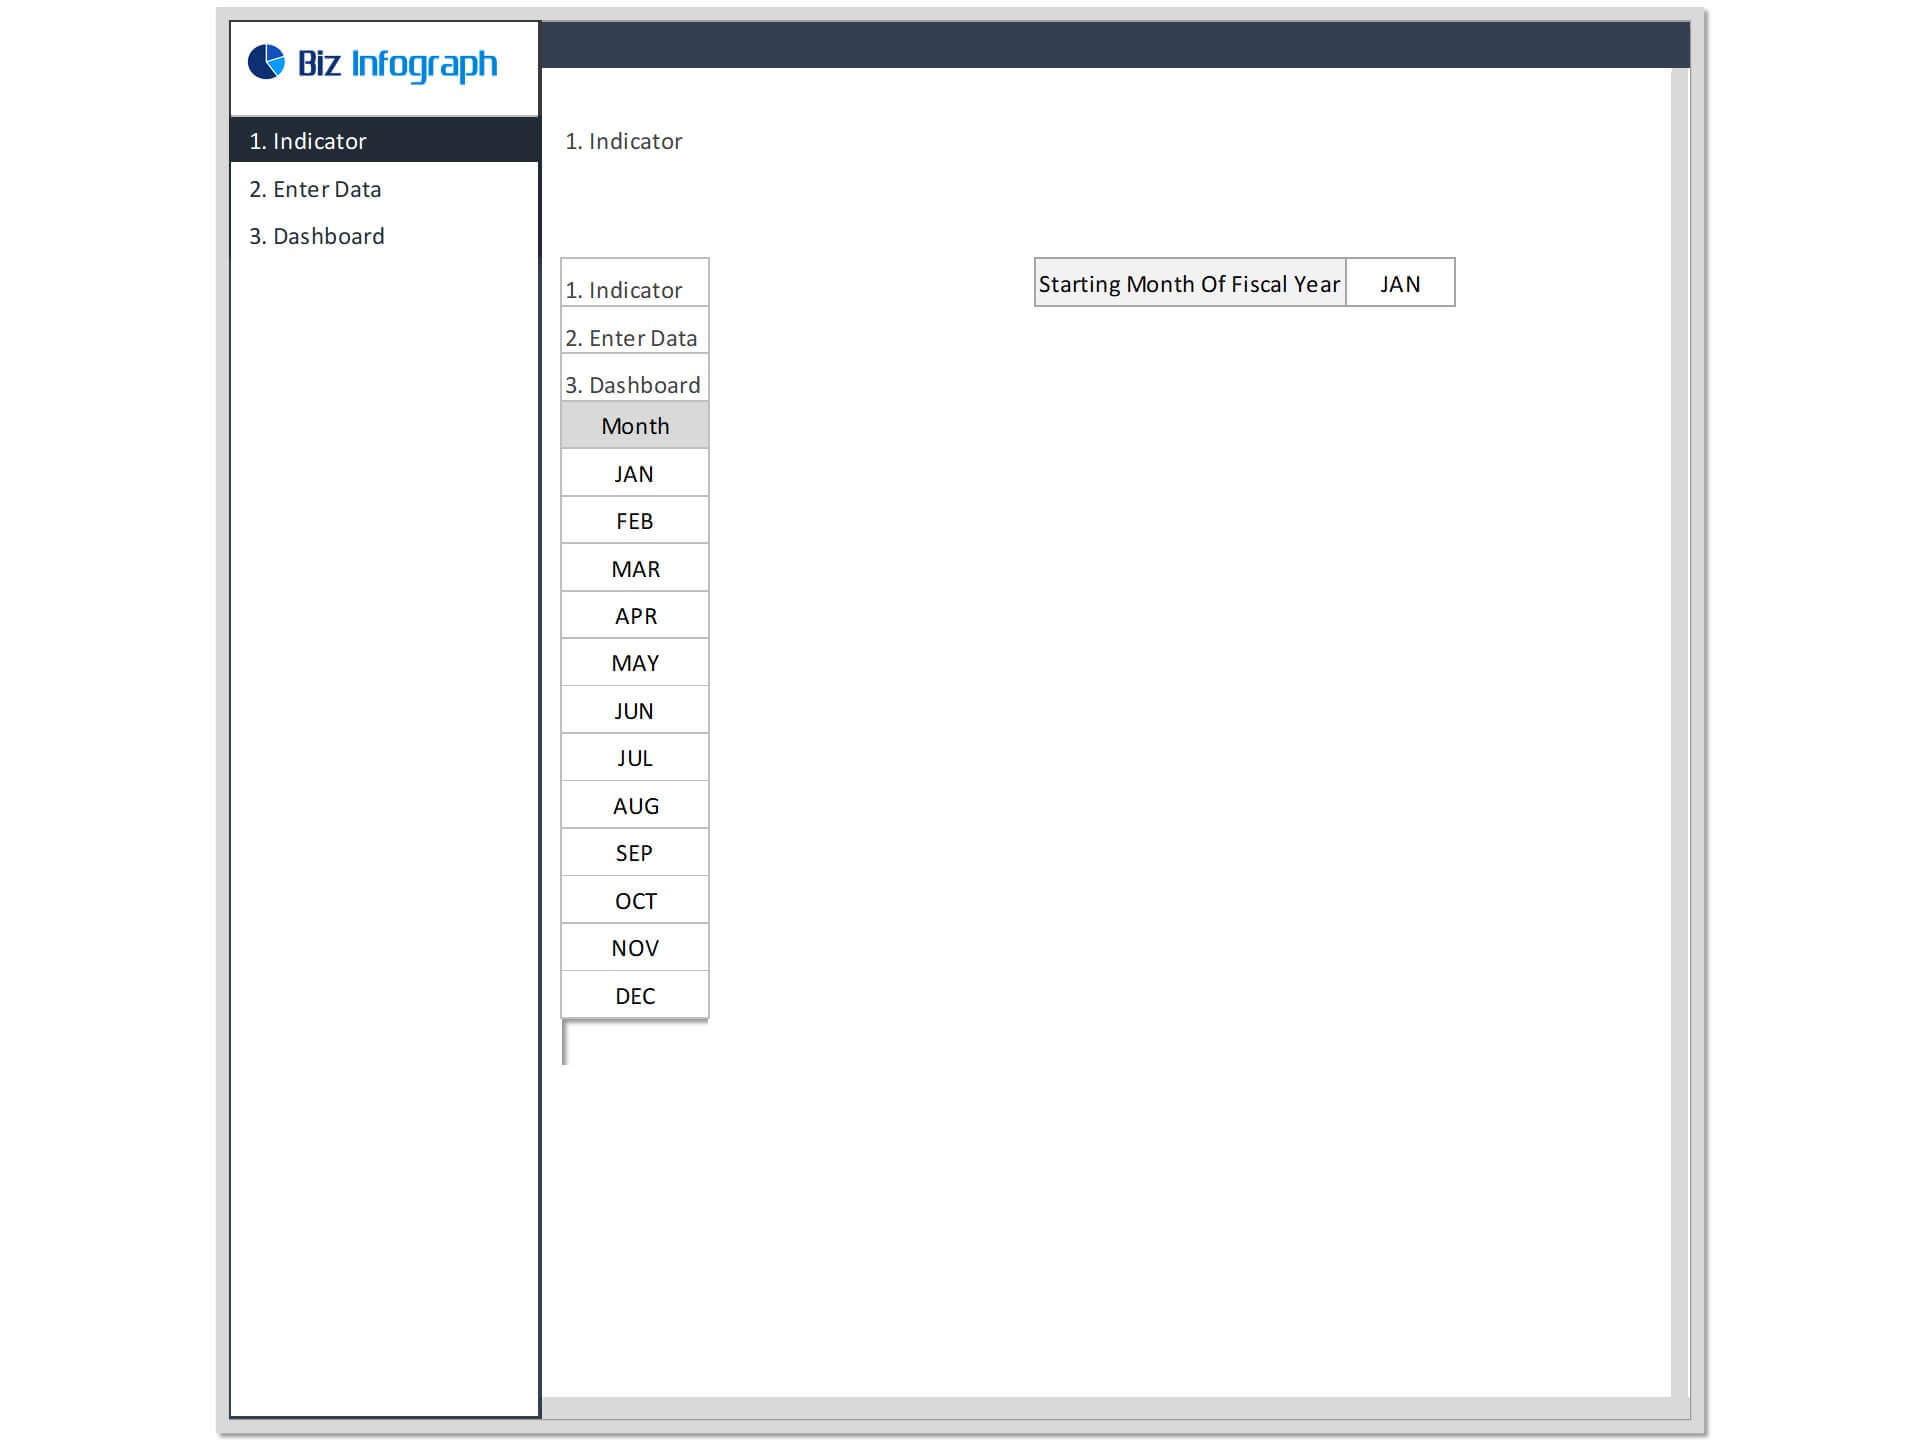
- Go to ‘Indicators’ menu – choose the start month of the fiscal year (i.e. Jan, Feb, Jul, etc.)
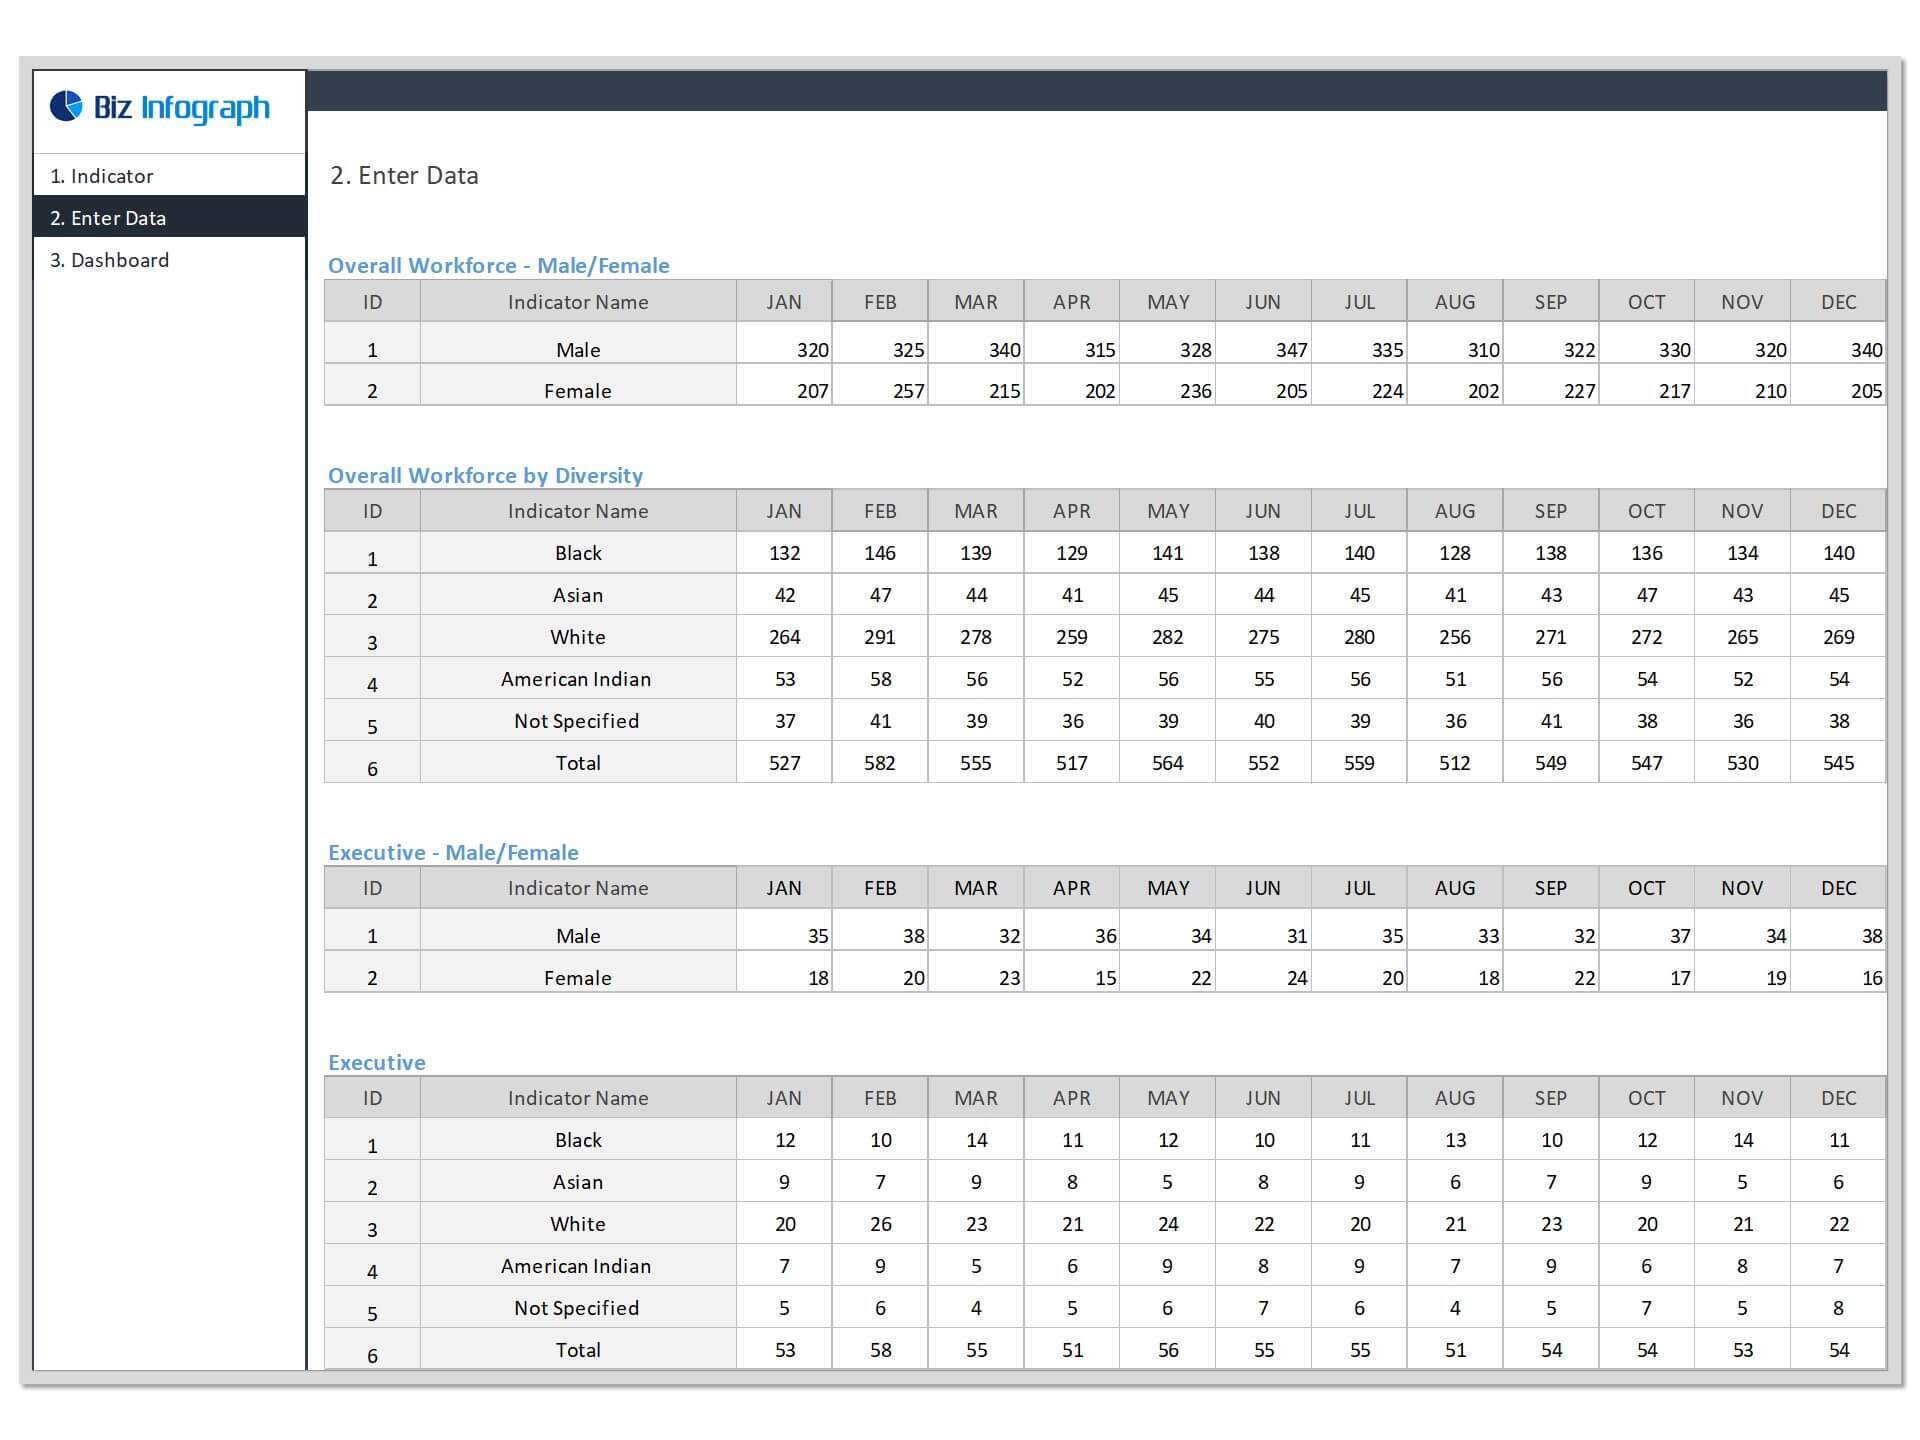
- Go to the ‘Enter Data’ menu – remove the sample data and give your actual data in the respective cells. Formula cells are locked, and you cannot edit it without a password.
- Go to ‘Dashboard’ menu - select month name from the drop-down to see the year-to-date picture of performance indicators
- Each page is ready for printing – just press CTRL+P
This Best Practice includes
1 Excel File, 1 Google Sheets file, 1 Word File
