
Originally published: 09/07/2018 12:57
Last version published: 11/03/2021 15:30
Publication number: ELQ-86879-5
View all versions & Certificate
Last version published: 11/03/2021 15:30
Publication number: ELQ-86879-5
View all versions & Certificate

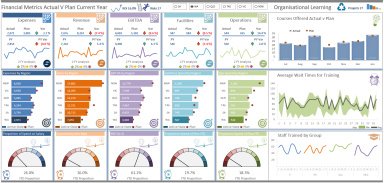
Key Financial Metrics Report Excel Model
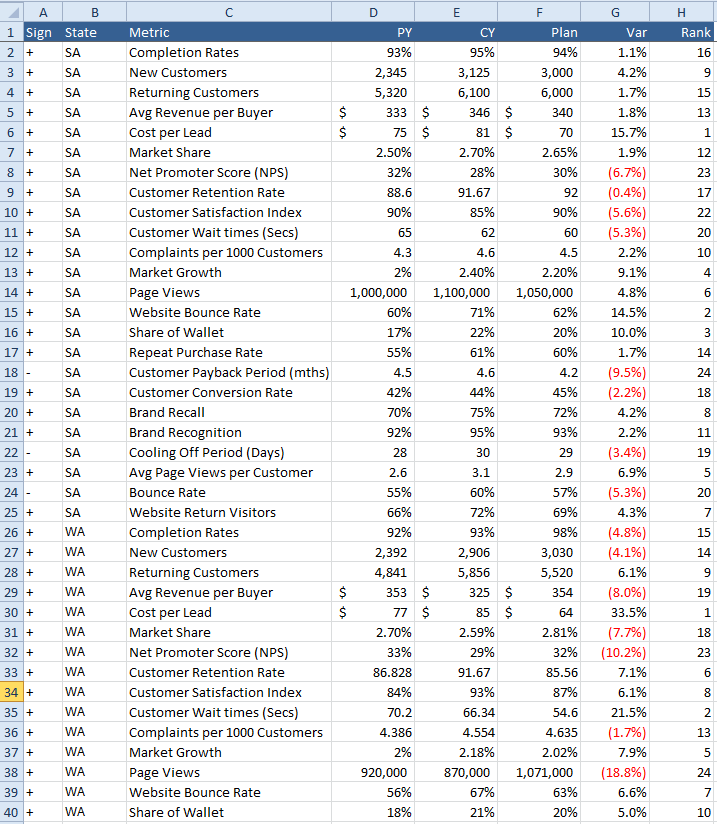
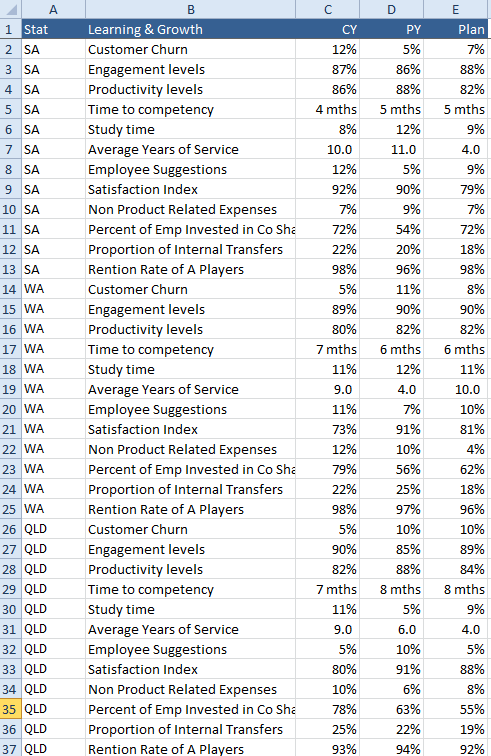
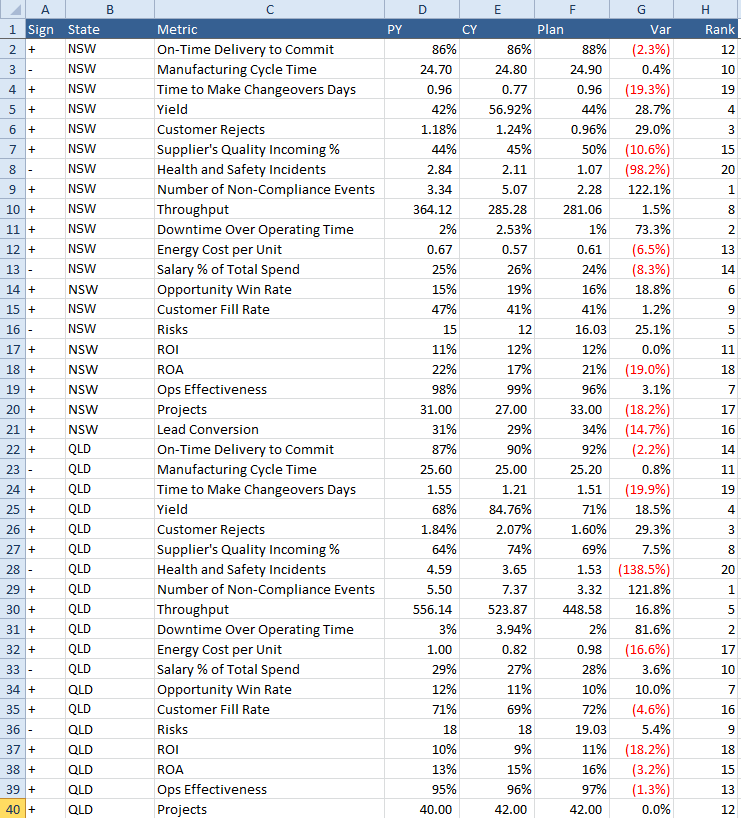
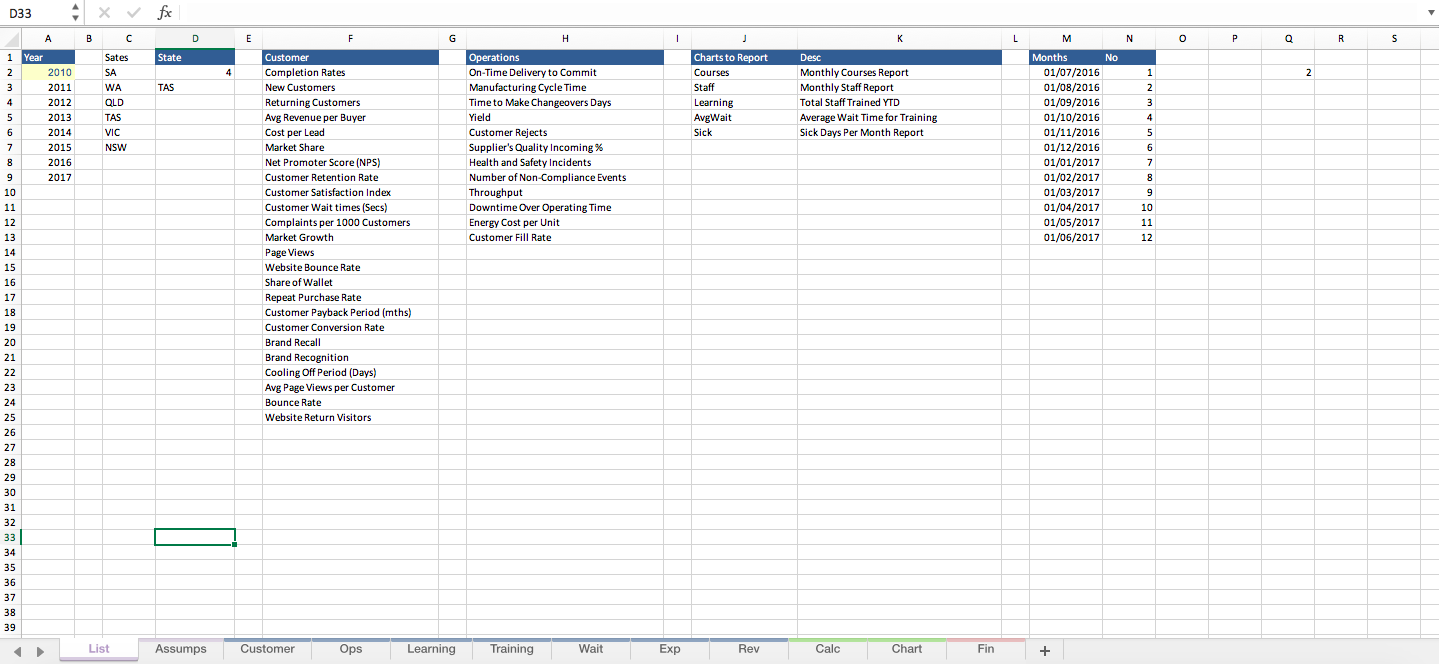
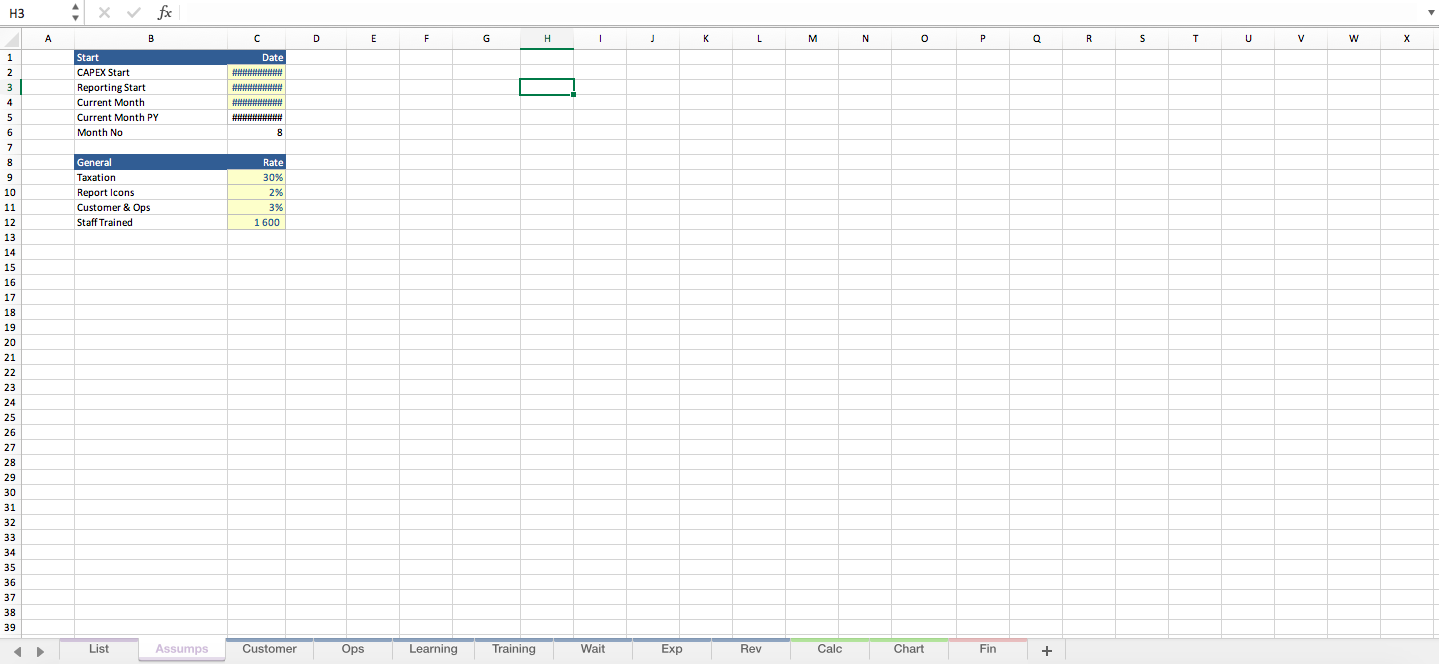
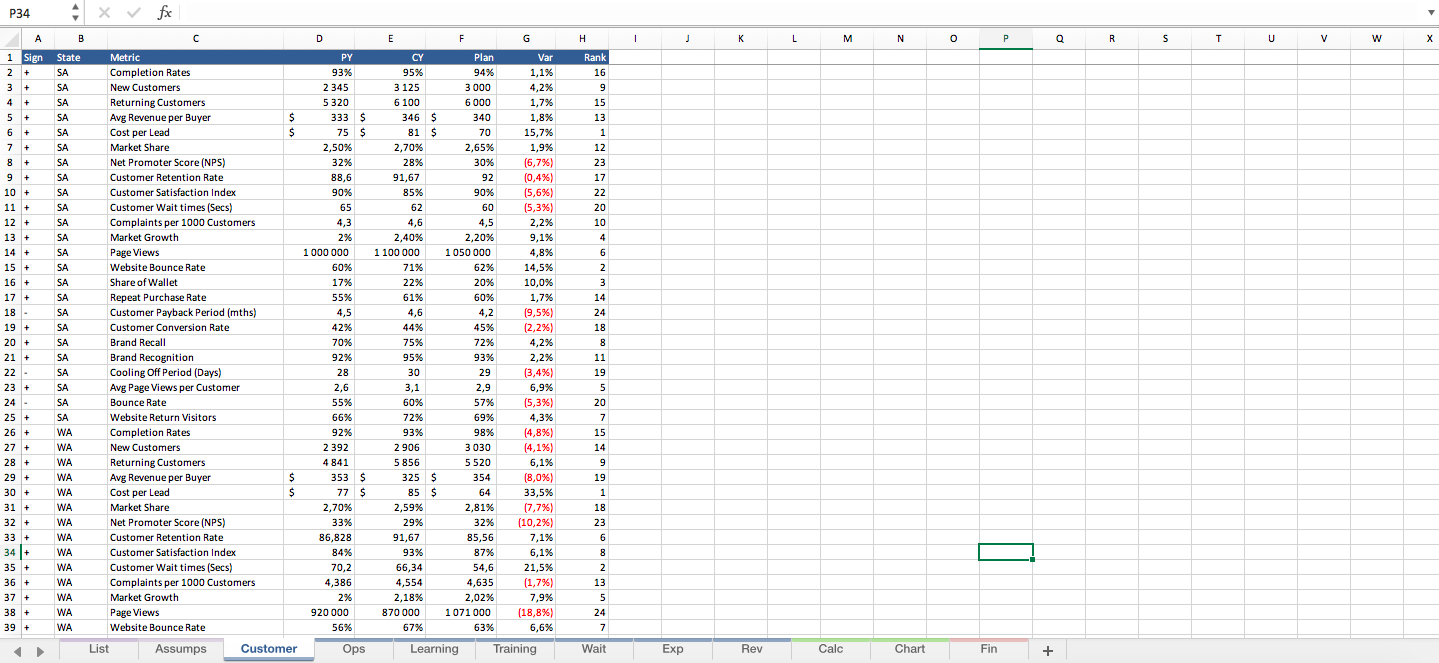
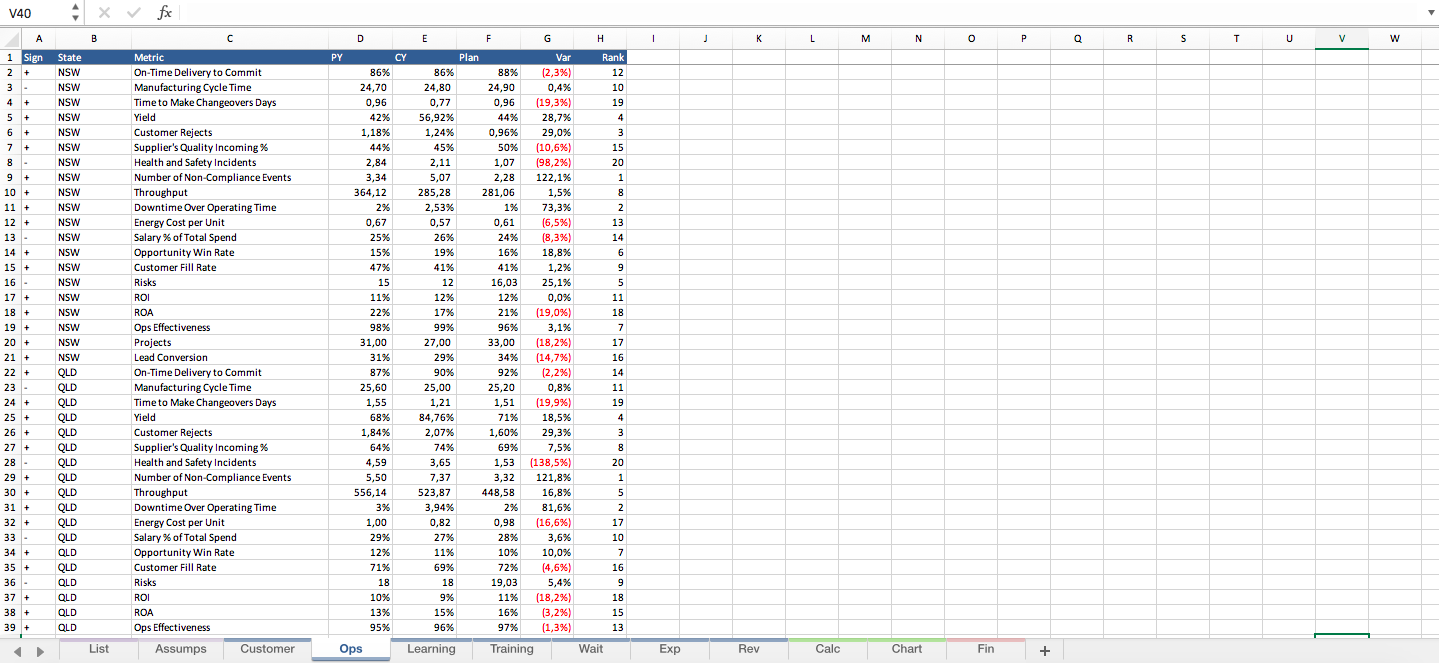
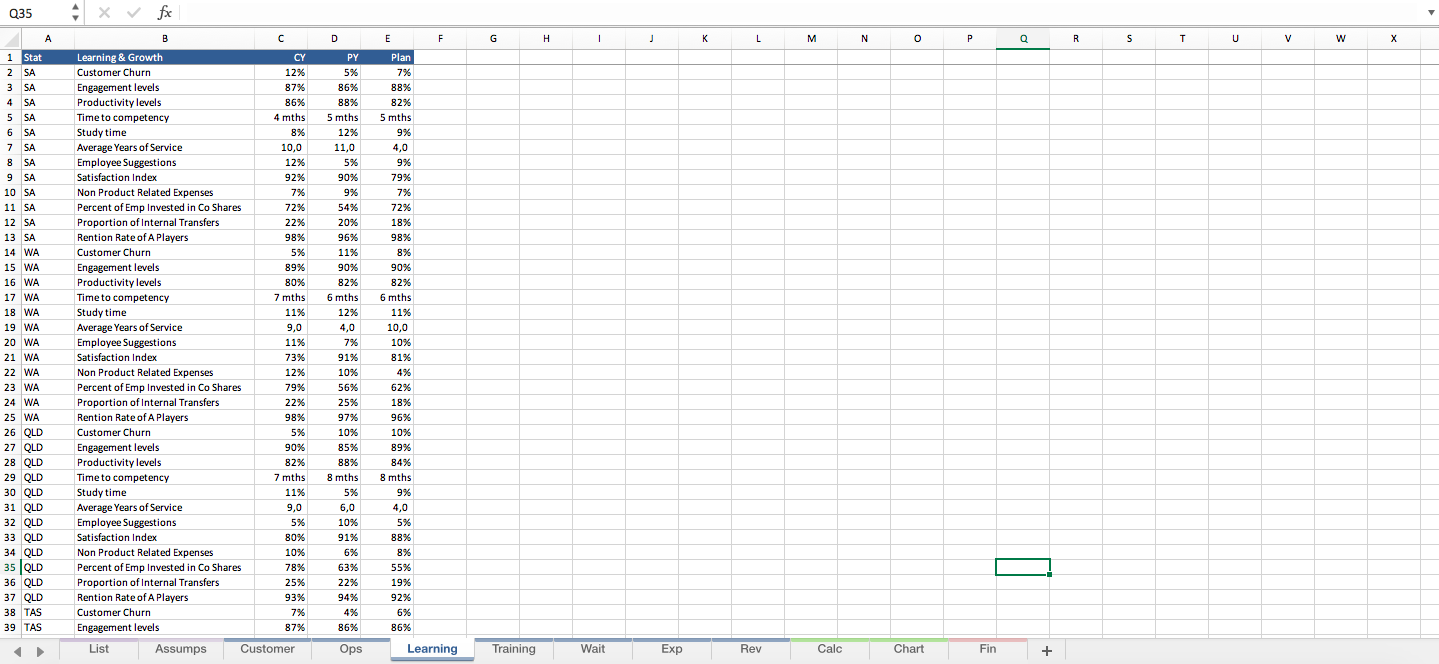
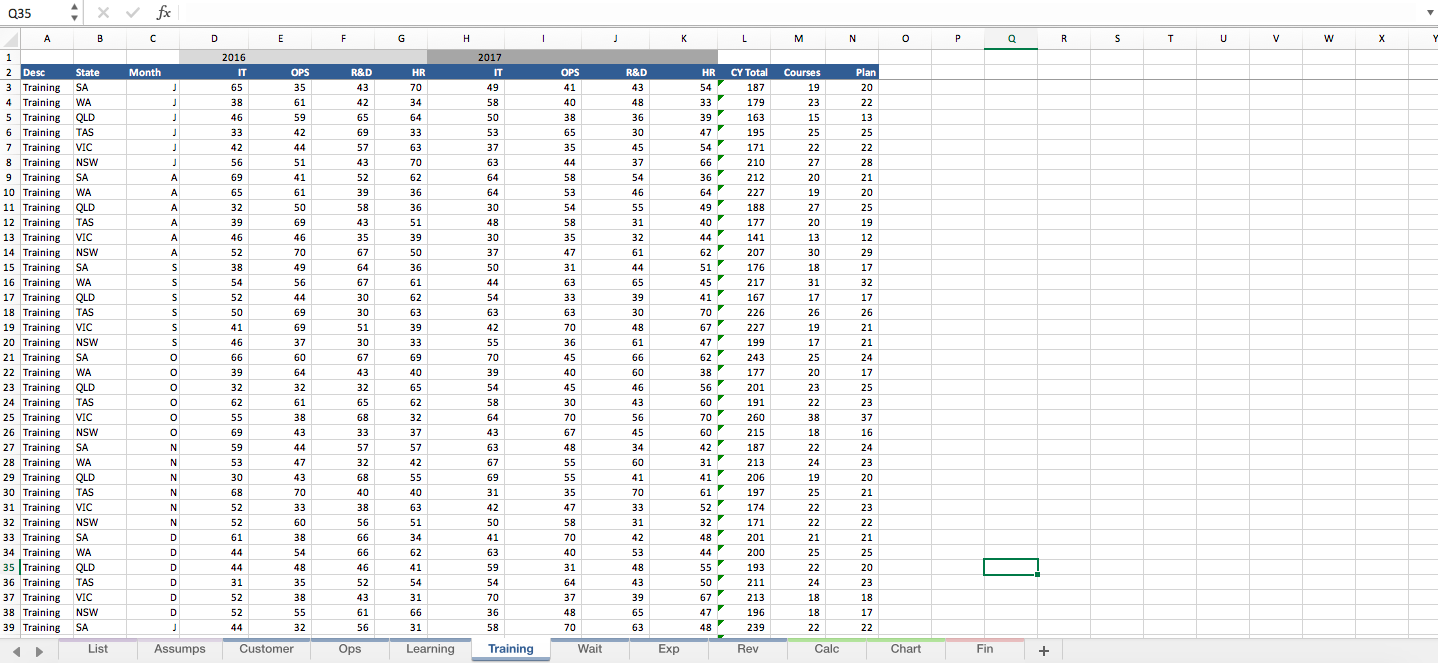
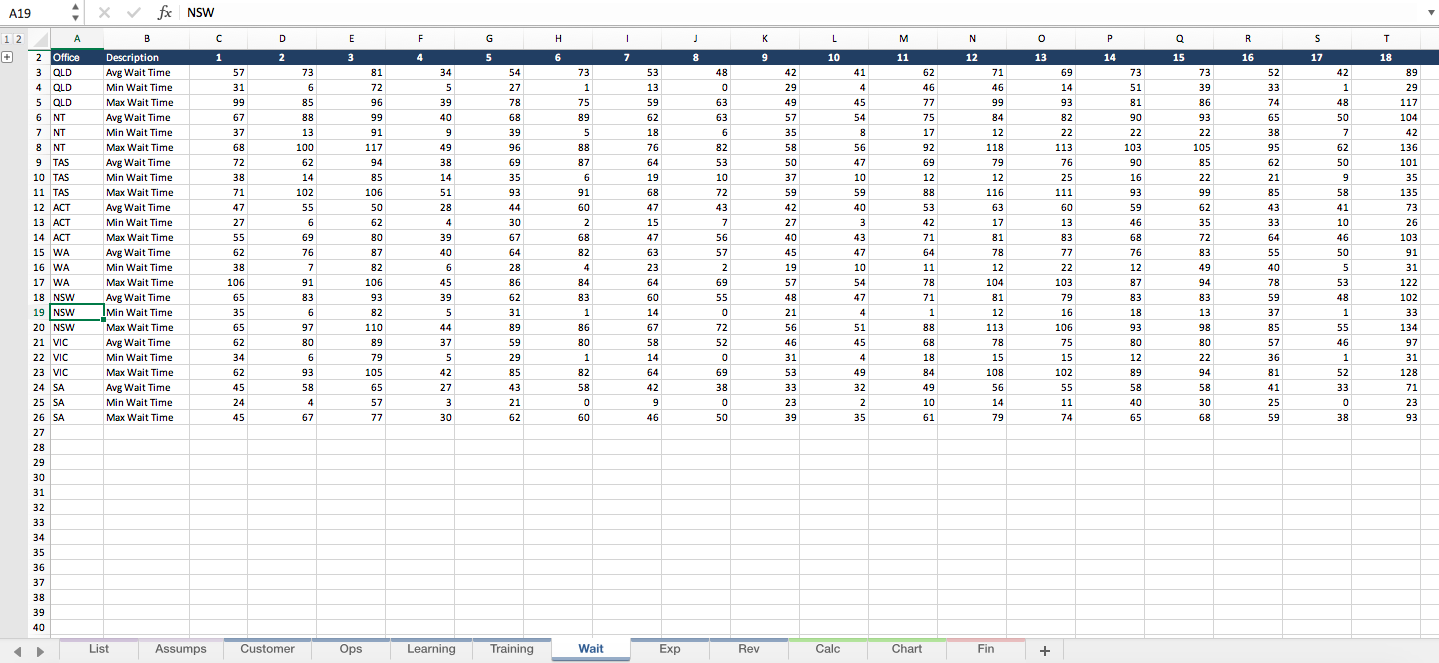
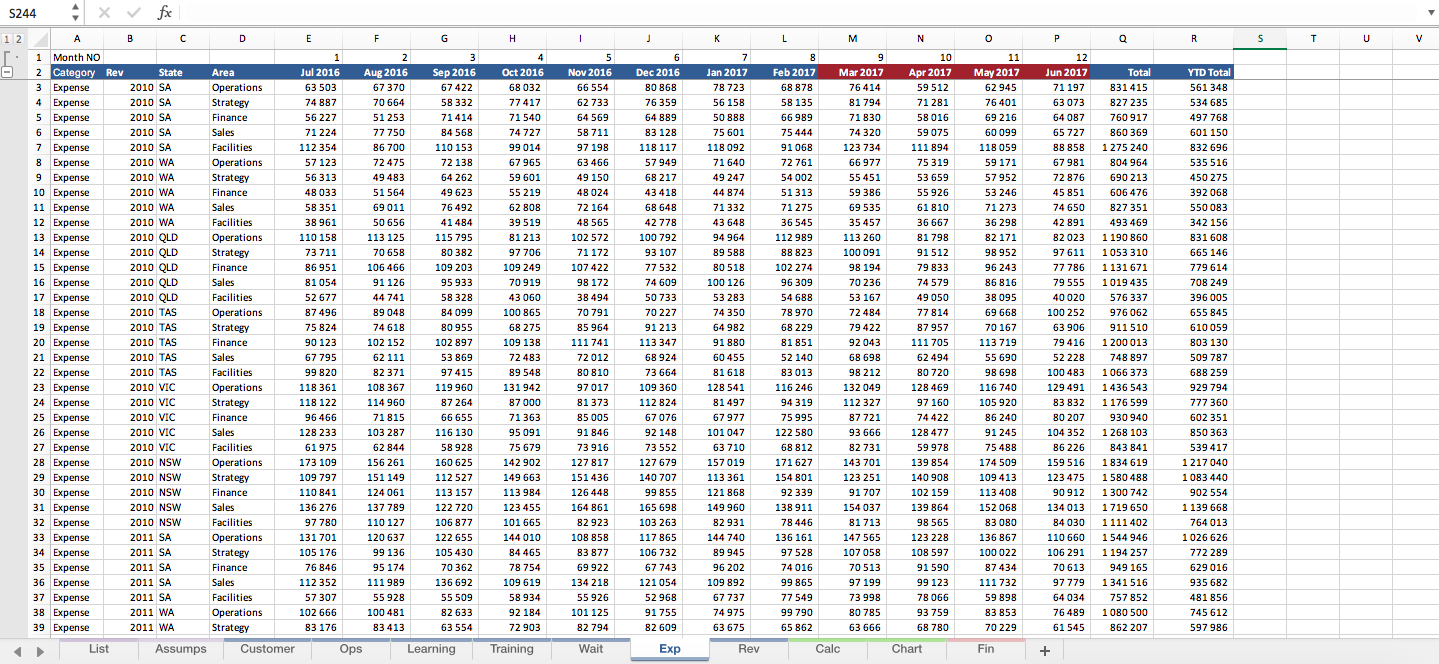
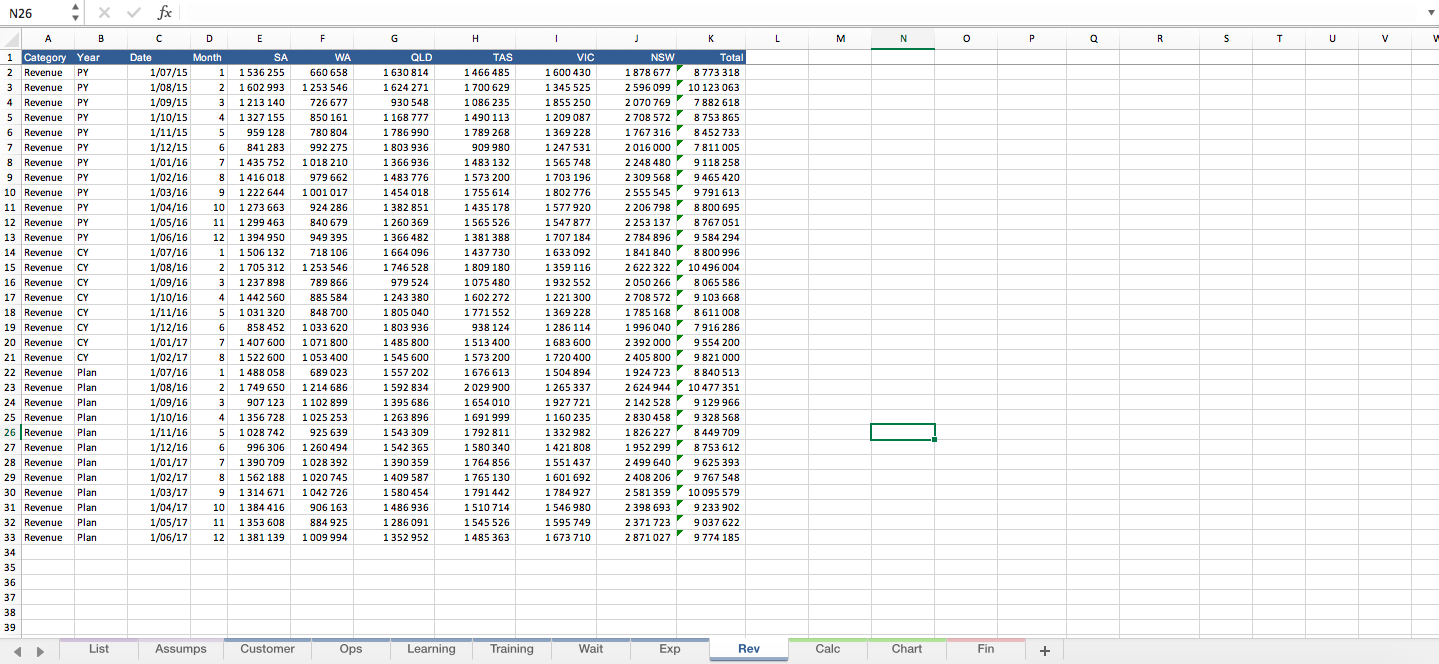
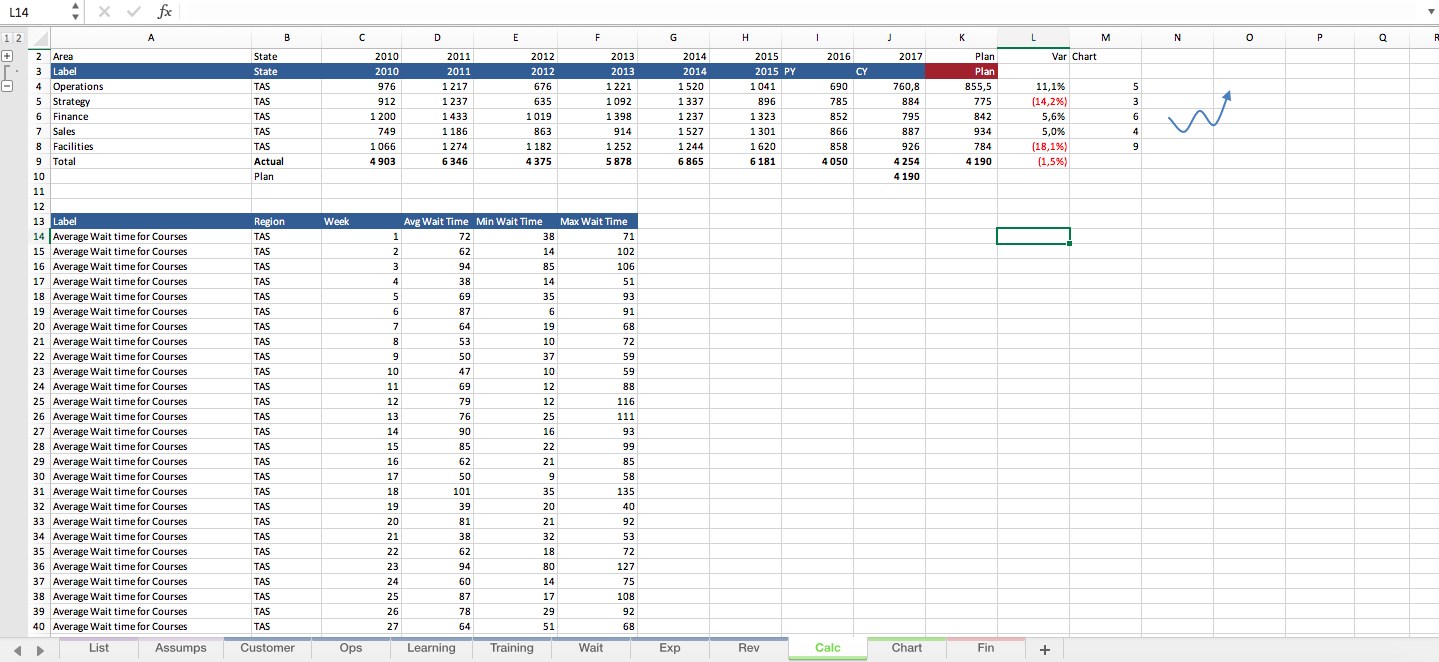
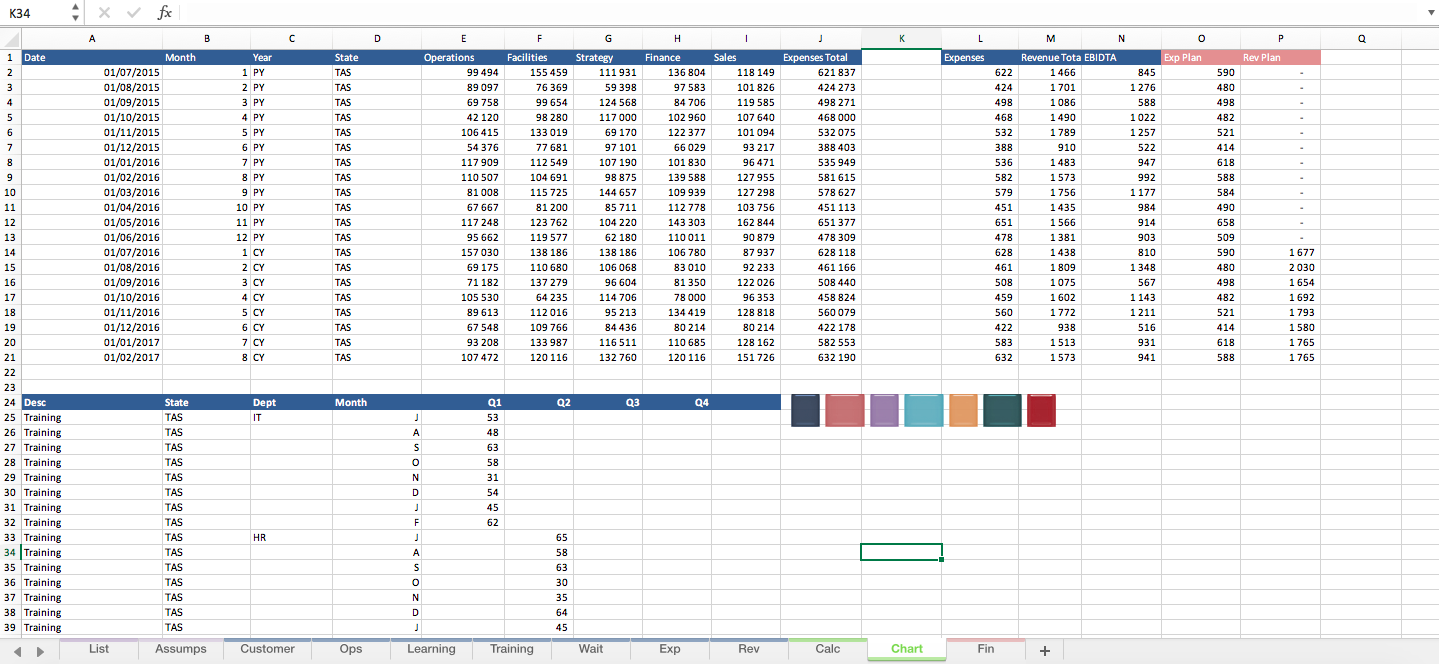
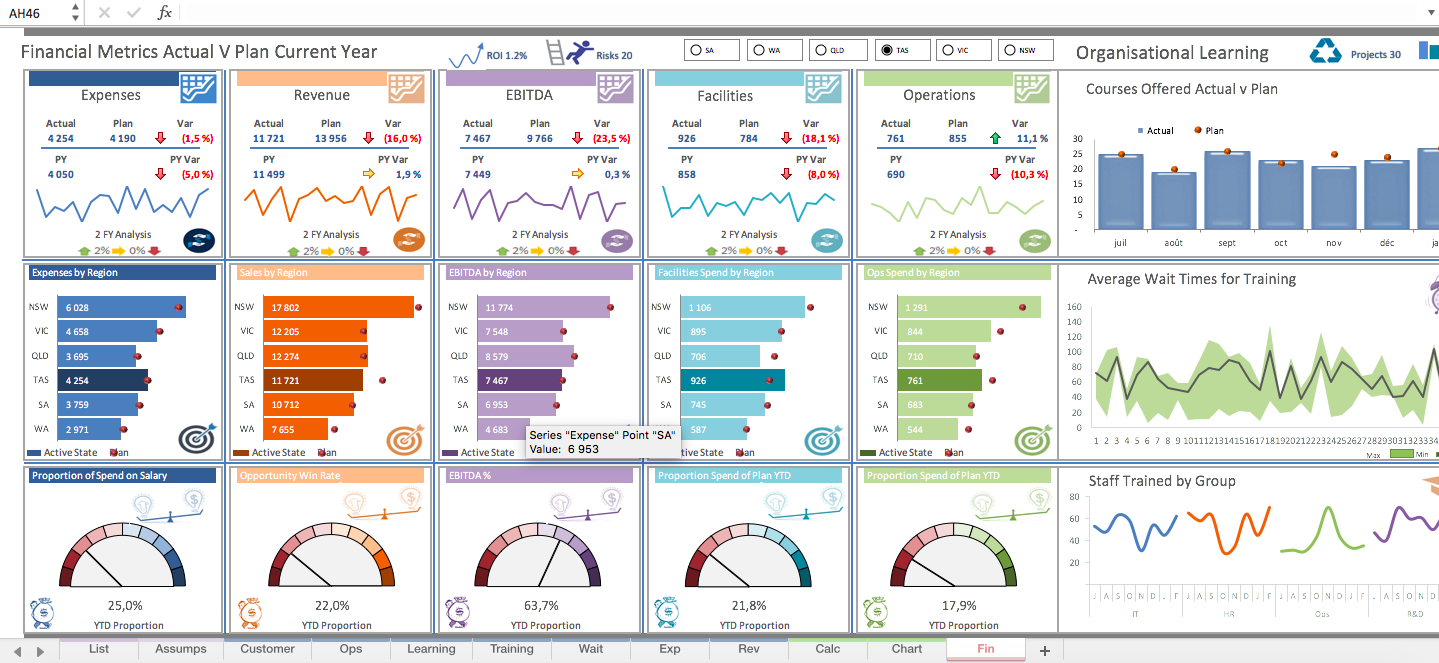
The workbook compares a range of metrics by region. It is simple to update and presents data clear concise way.
Further information
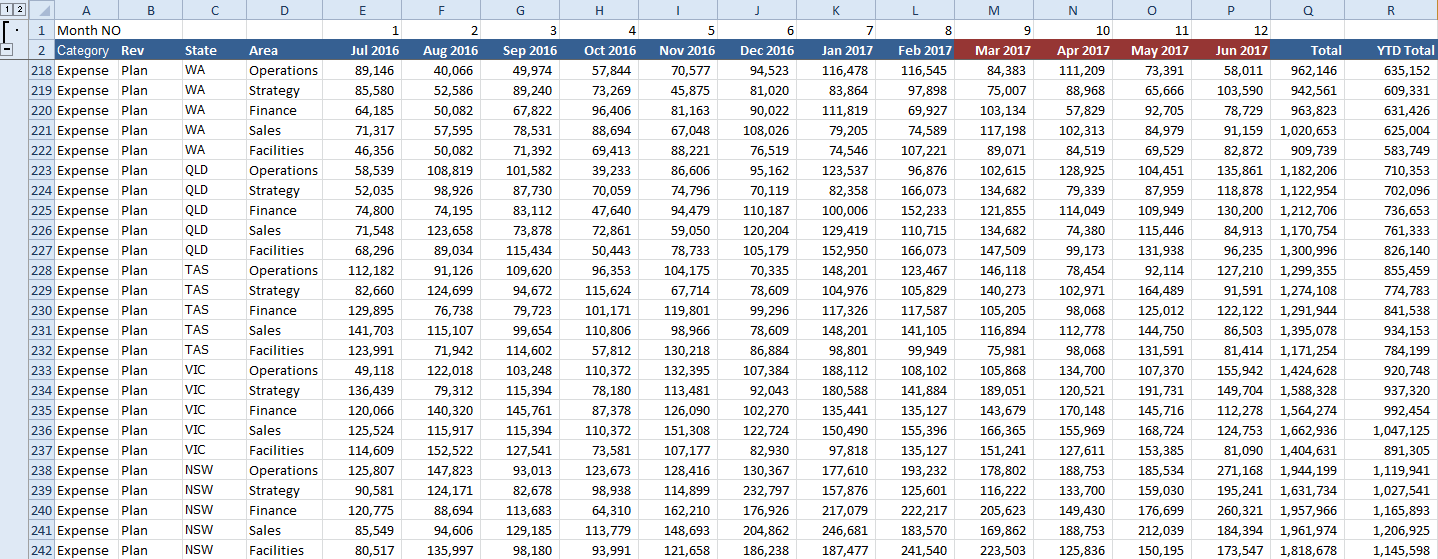
The file acts as a comparative report for business to analyse how things are tracking when comparing actual to plan to prior year.
When reporting a range of metrics actual v plan across a range of disciplines. The report is quite simple to update and presents data in a clear concise way.
