E-Commerce Landed Cost & SKU Profitability Factory — Google Sheet
Originally published: 30/12/2025 21:07
Last version published: 17/07/2026 20:35
Publication number: ELQ-85375-2
View all versions & Certificate
certified

E-Commerce Landed Cost & SKU Profitability Factory — Google Sheet

Eliminate margin illusion with automated true landed COGS, customs tariff allocations, and real-time SKU profitability alarms natively in Google Sheets.

Description

Most e-commerce spreadsheets and standard retail pricing calculators operate on a dangerous margin illusion. They track simple factory FOB (Free on Board) prices against retail targets, completely ignoring the silent profit killers that bleed physical product brands dry: ocean and air freight allocations, shifting customs duties, 3PL pick-and-pack fees, inbound pallet shipping, and marketplace transaction rates.


When your catalog pricing operates without true unit-cost visibility, you inevitably scale low-margin SKUs, misallocate ad spend, and discover at the end of the quarter that your top-selling products are actually losing money.


The E-Commerce Landed Cost & SKU Profitability Factory transforms standard spreadsheet tracking into an executive-grade unit economics command center. Built natively and exclusively for Google Sheets, it bridges the gap between raw manufacturing costs and true net margin profitability with deterministic mathematical precision:


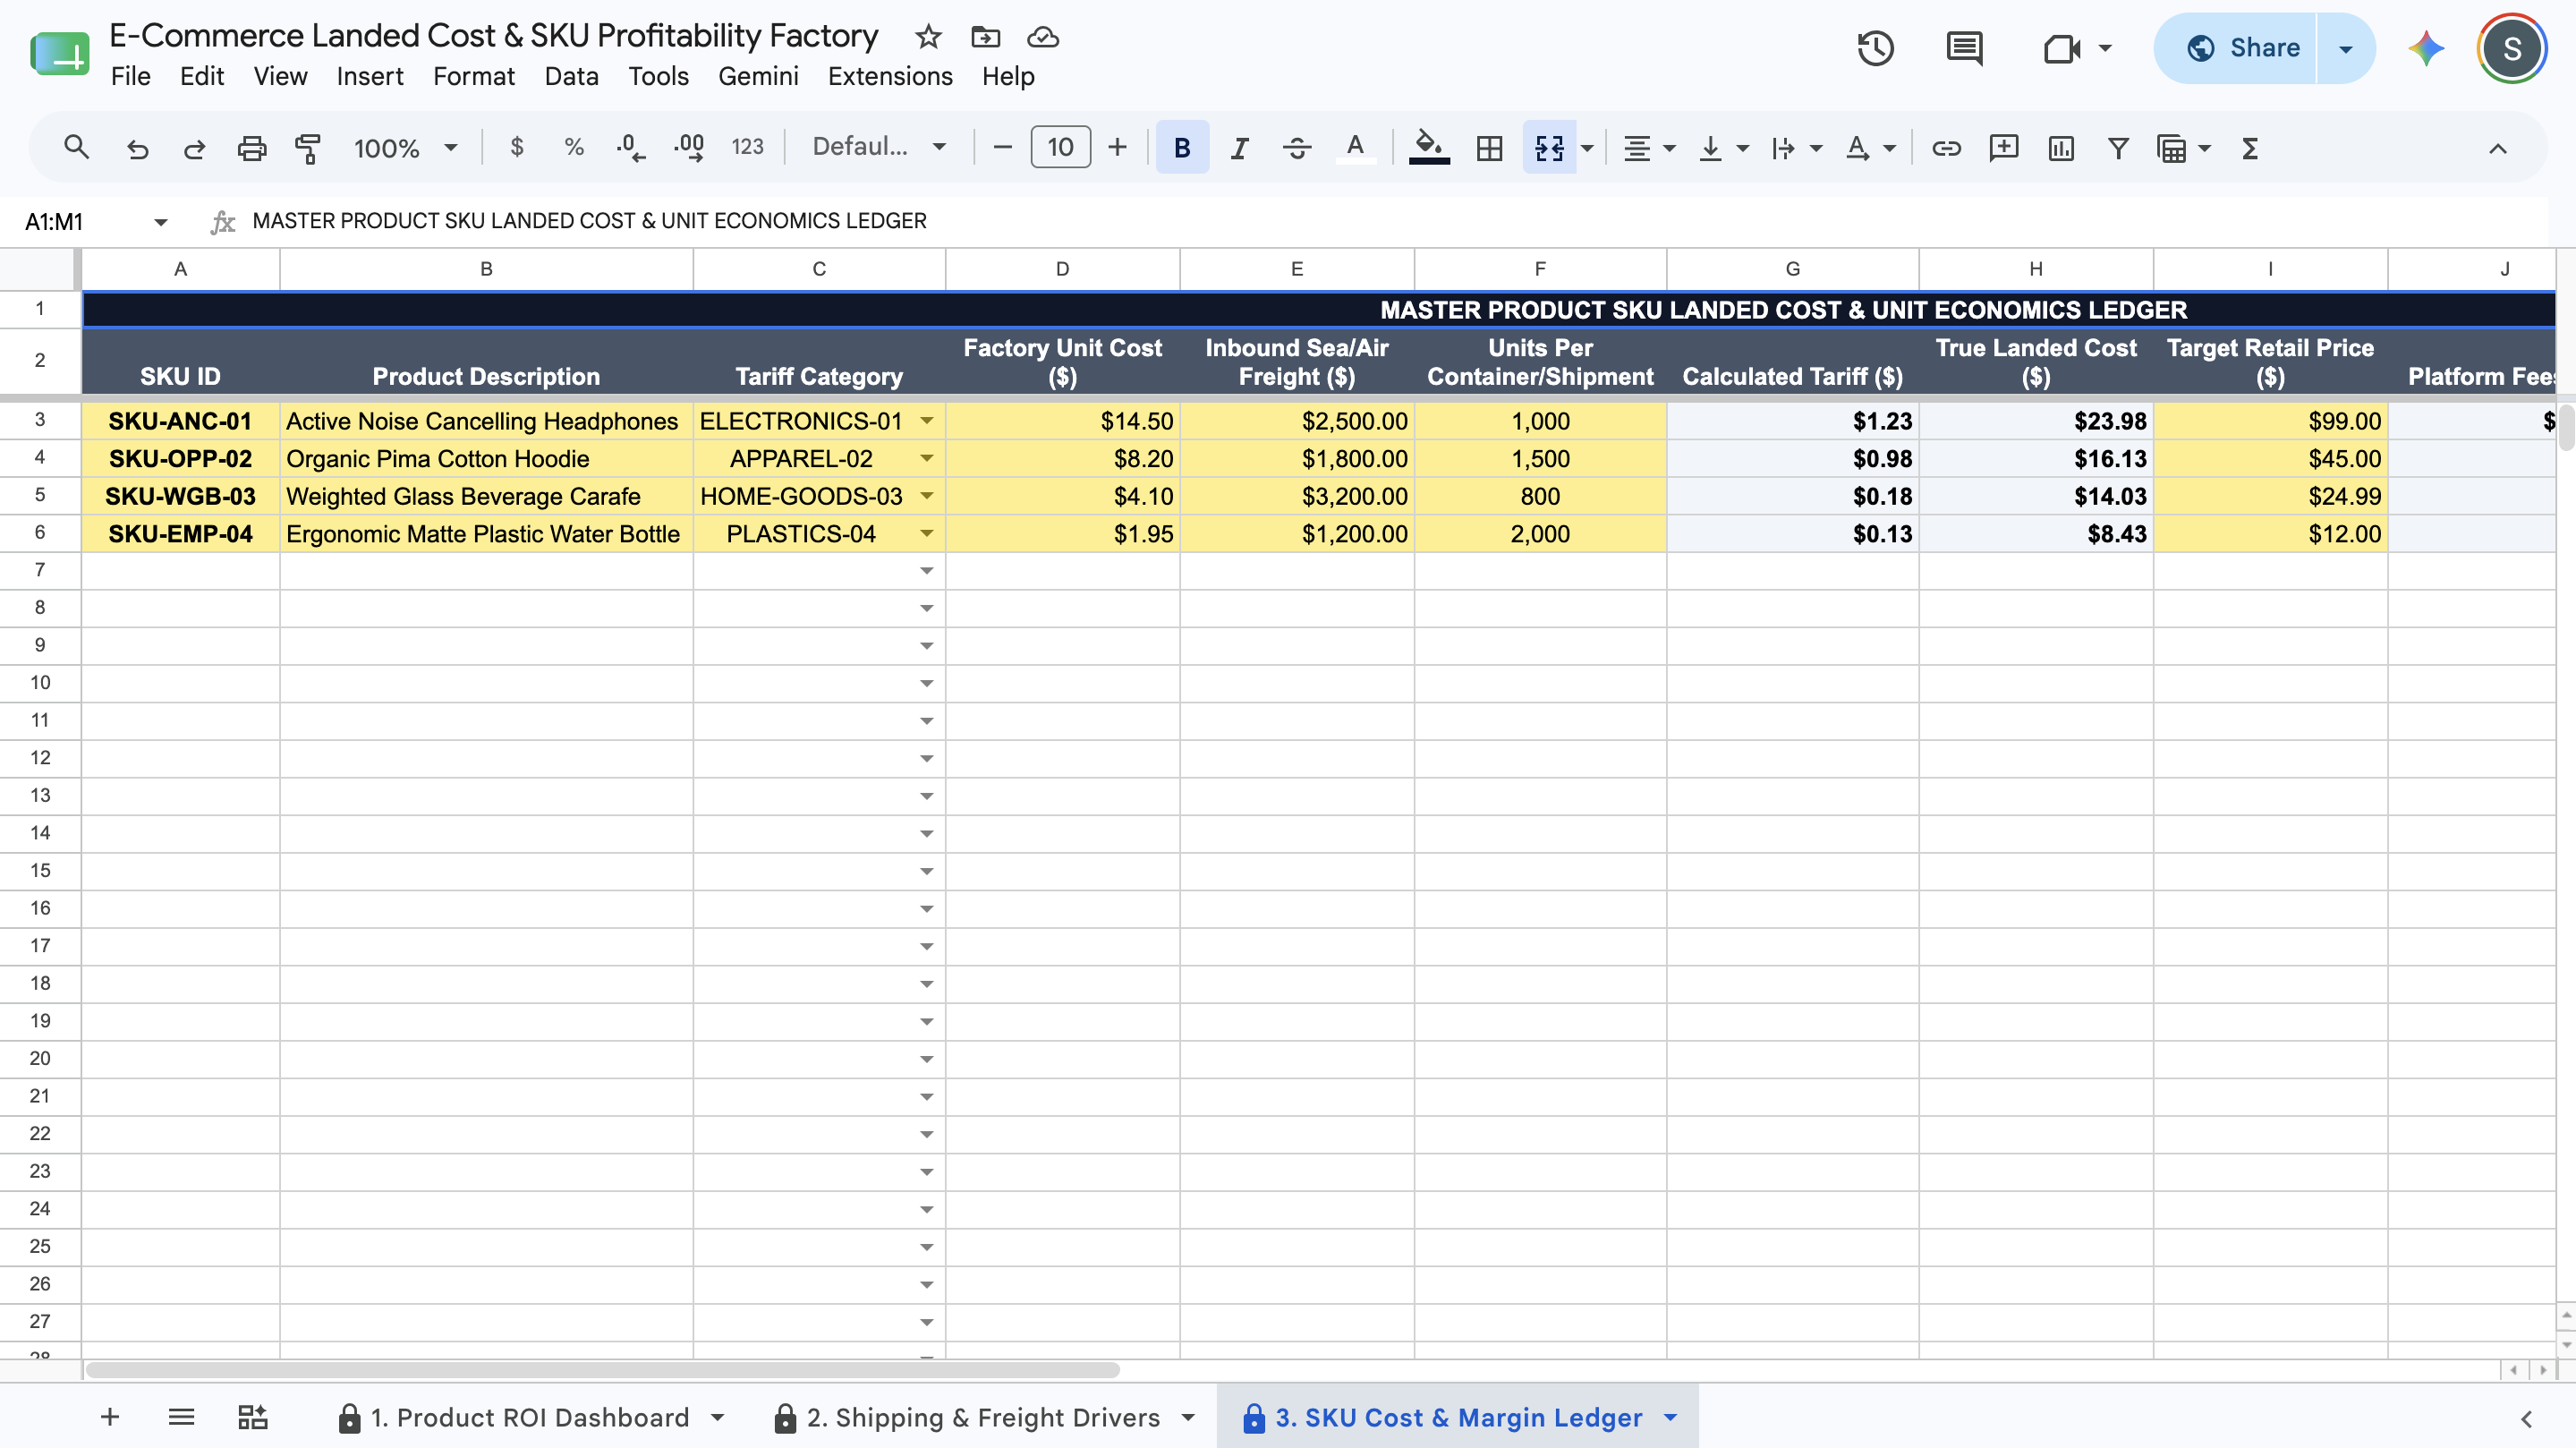
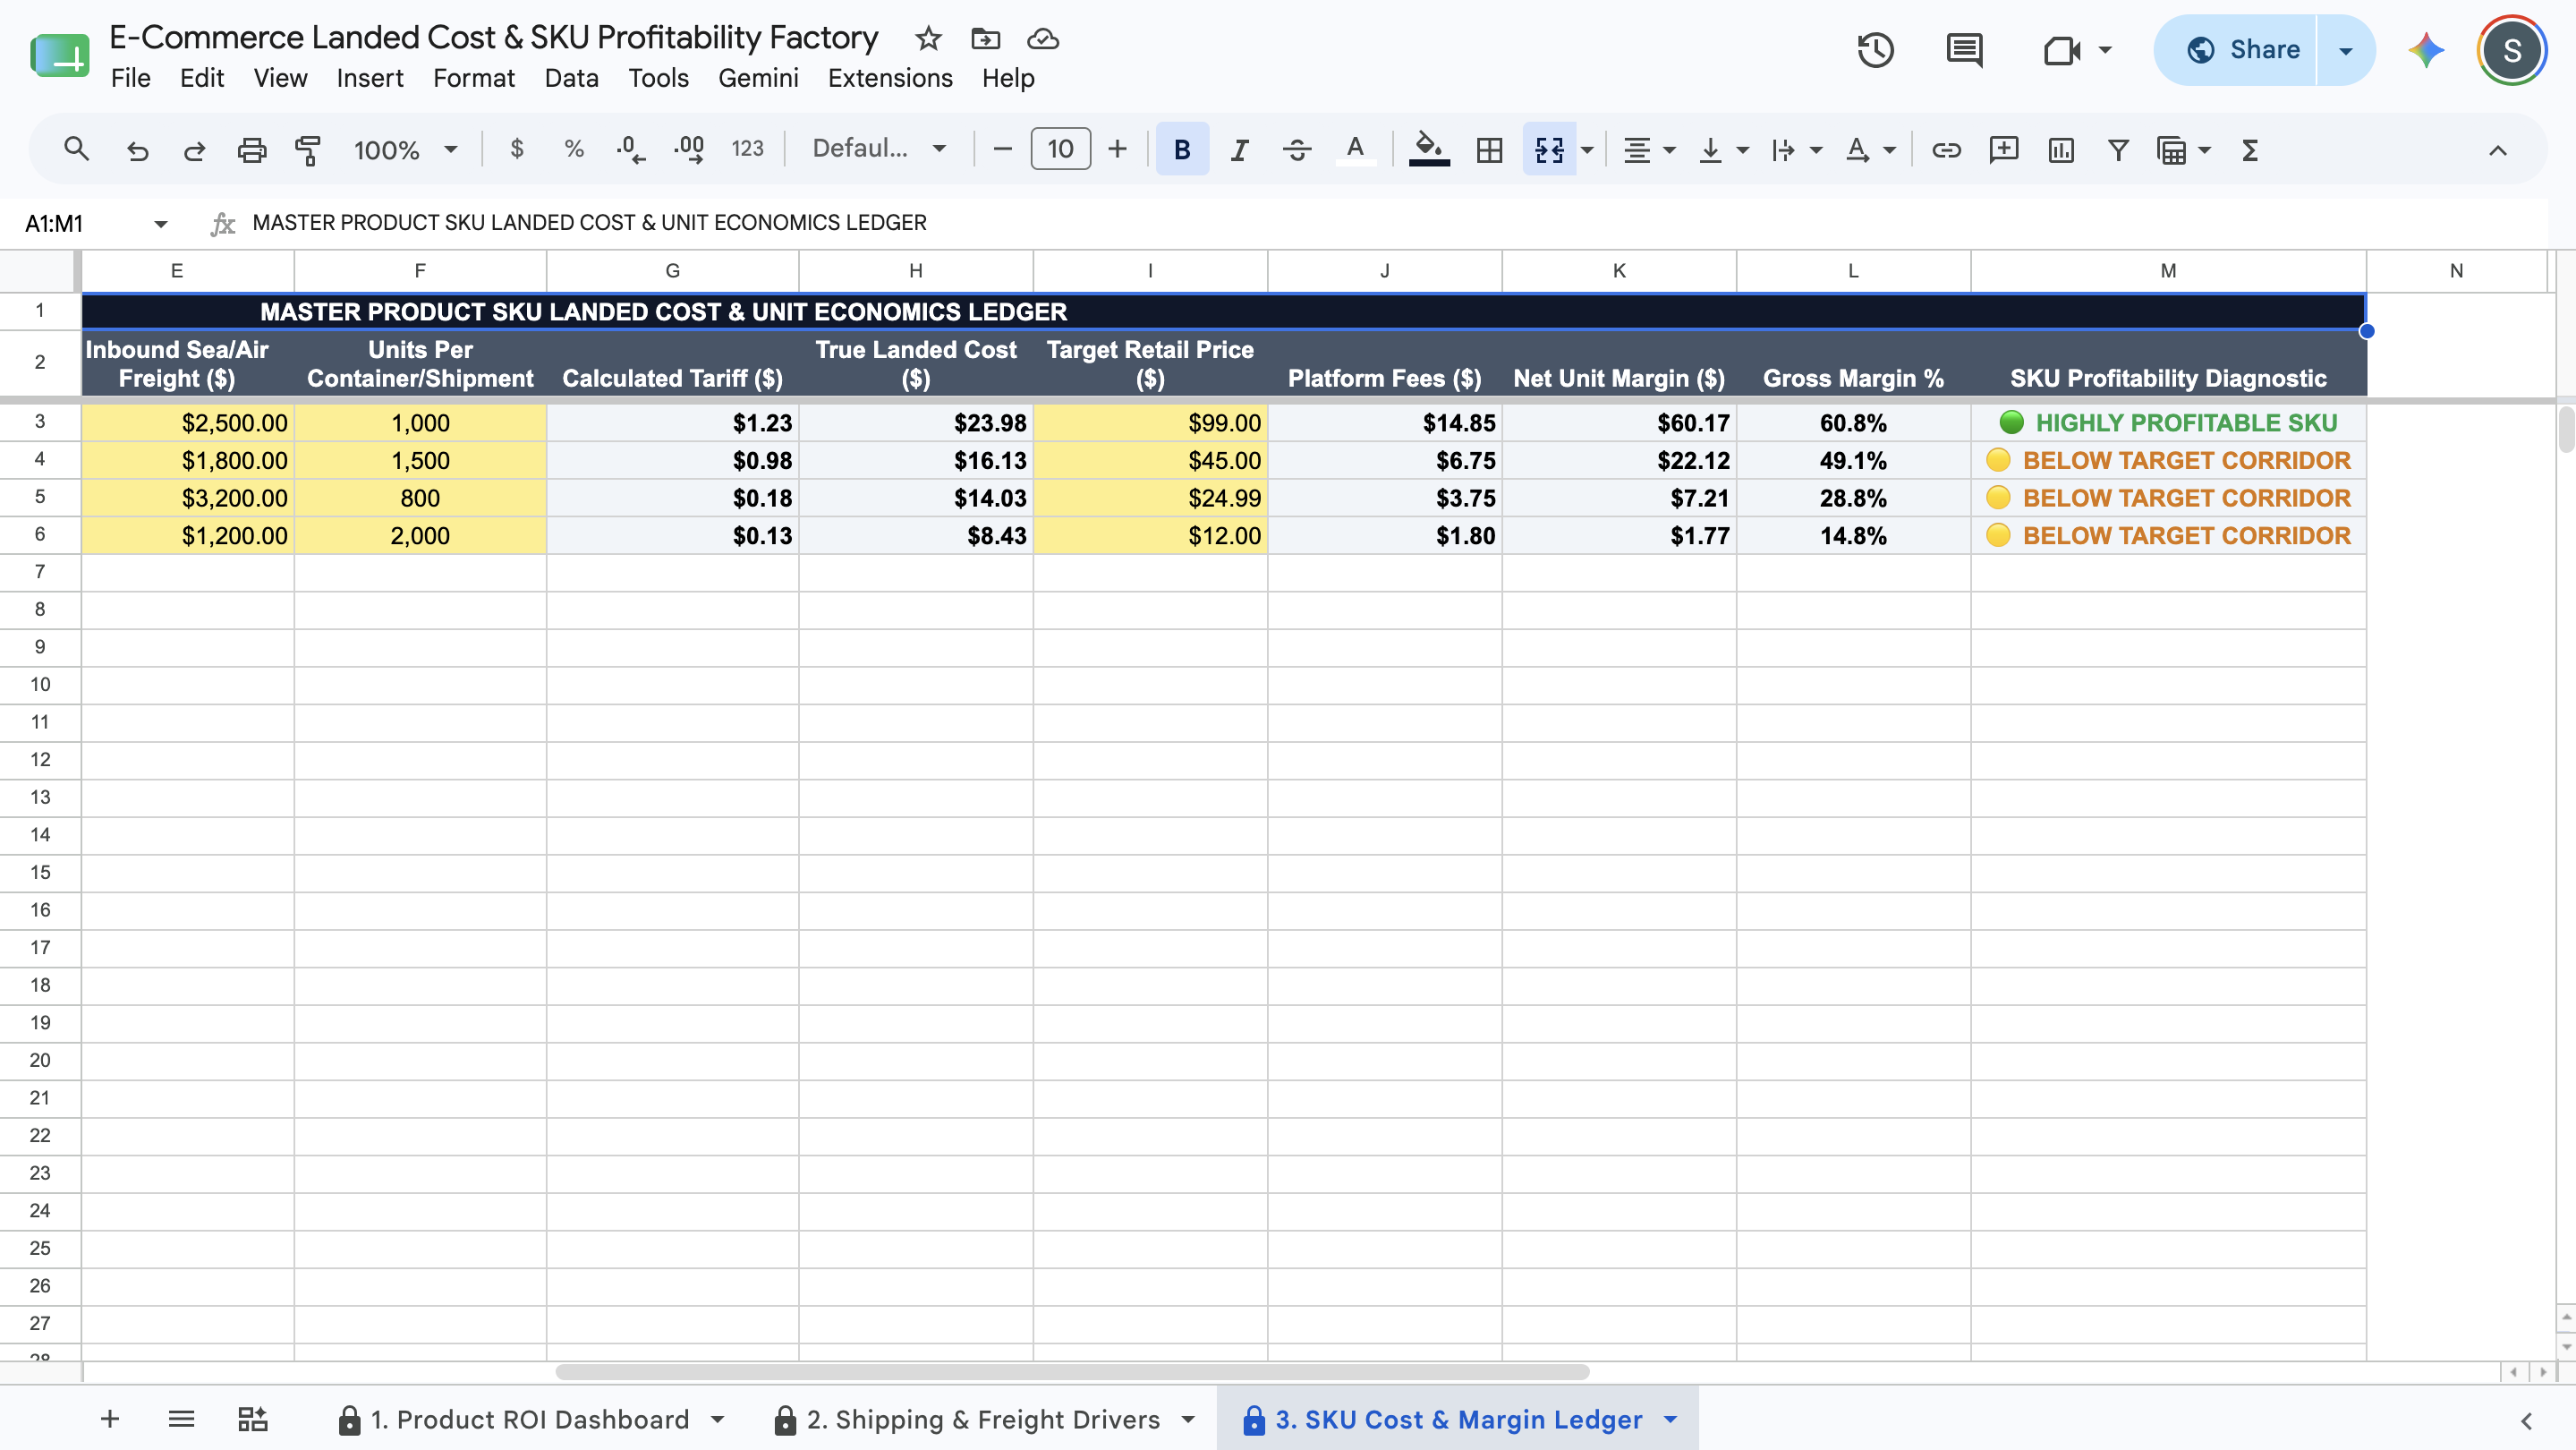
  • Automated Landed Cost Algebra: Stop guessing your true COGS. Input your raw factory unit cost, shipment freight, total units per container, and target retail price. The background engine instantly allocates container freight per unit and computes your exact True Landed Cost ($), Platform Fees ($), Net Unit Margin ($), and Gross Margin %.

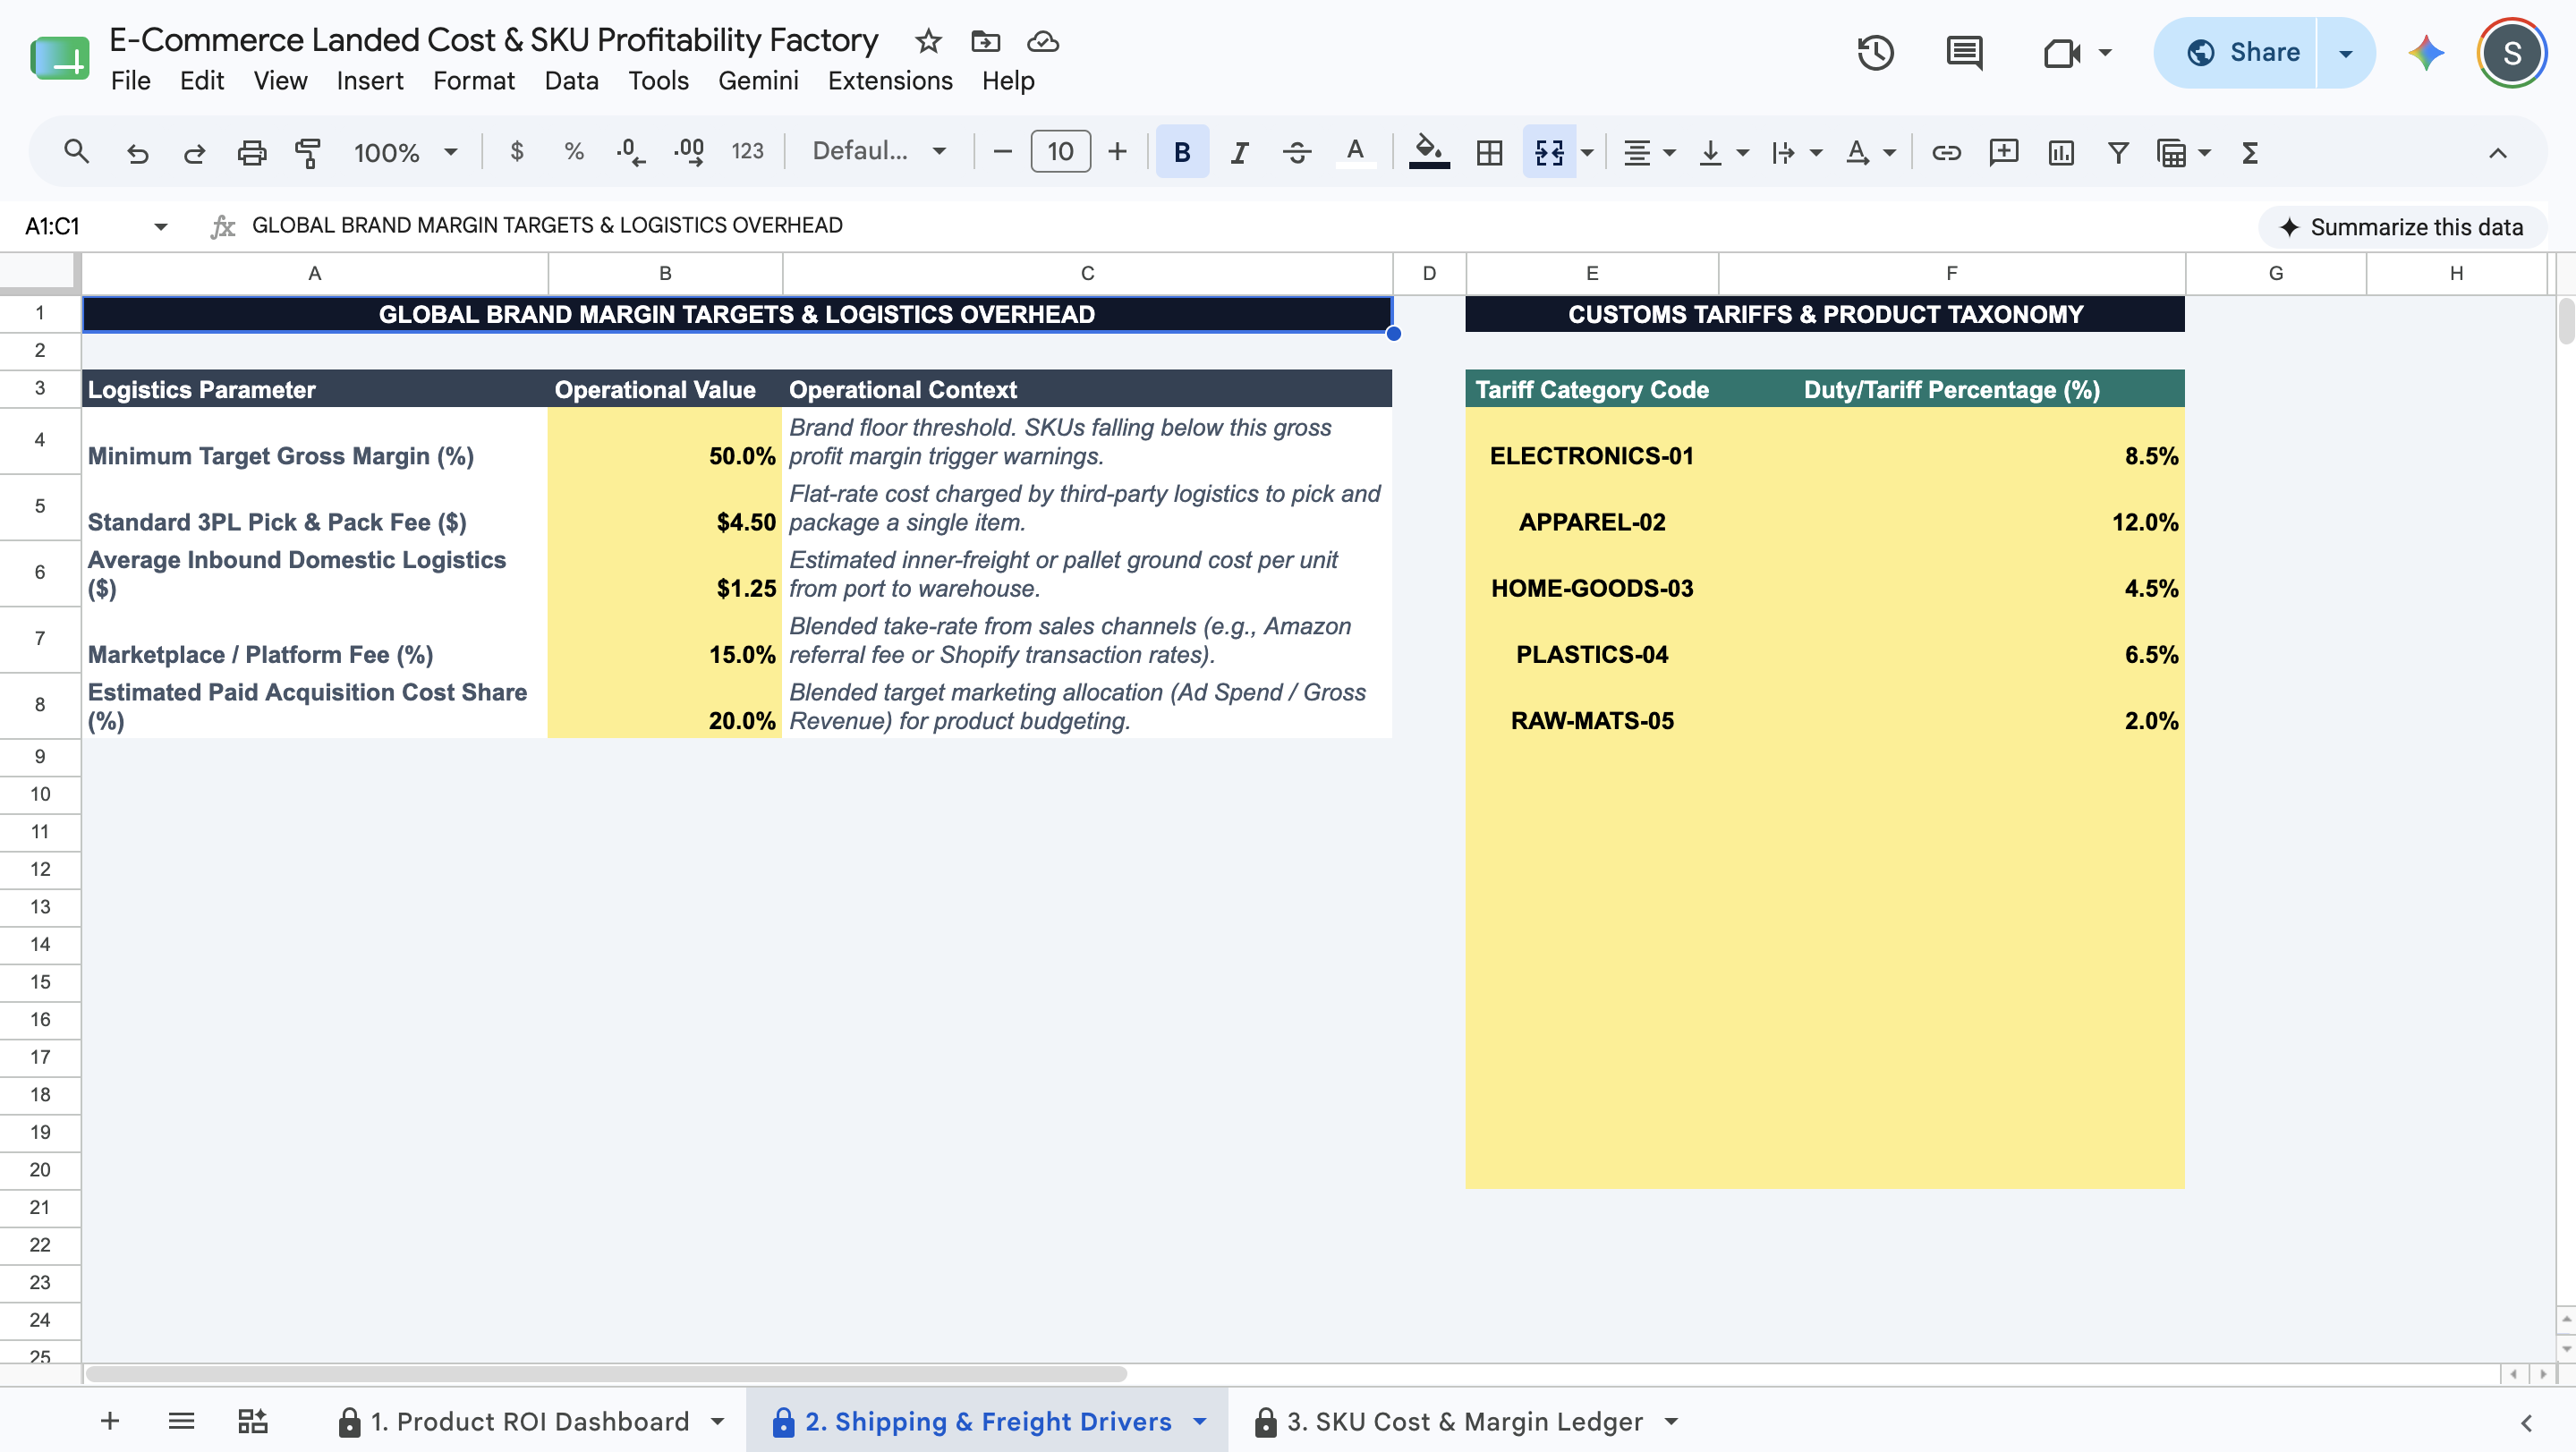
  • Dynamic Customs & Tariff Mapping: Easily establish up to 17 product tax categories (e.g., ELECTRONICS-01, APPAREL-02, HOME-GOODS-03) alongside their exact customs duty percentages. Map SKUs via simple validation dropdowns, and the engine automatically calculates and adds precise unit tariff liabilities to your cost stack.

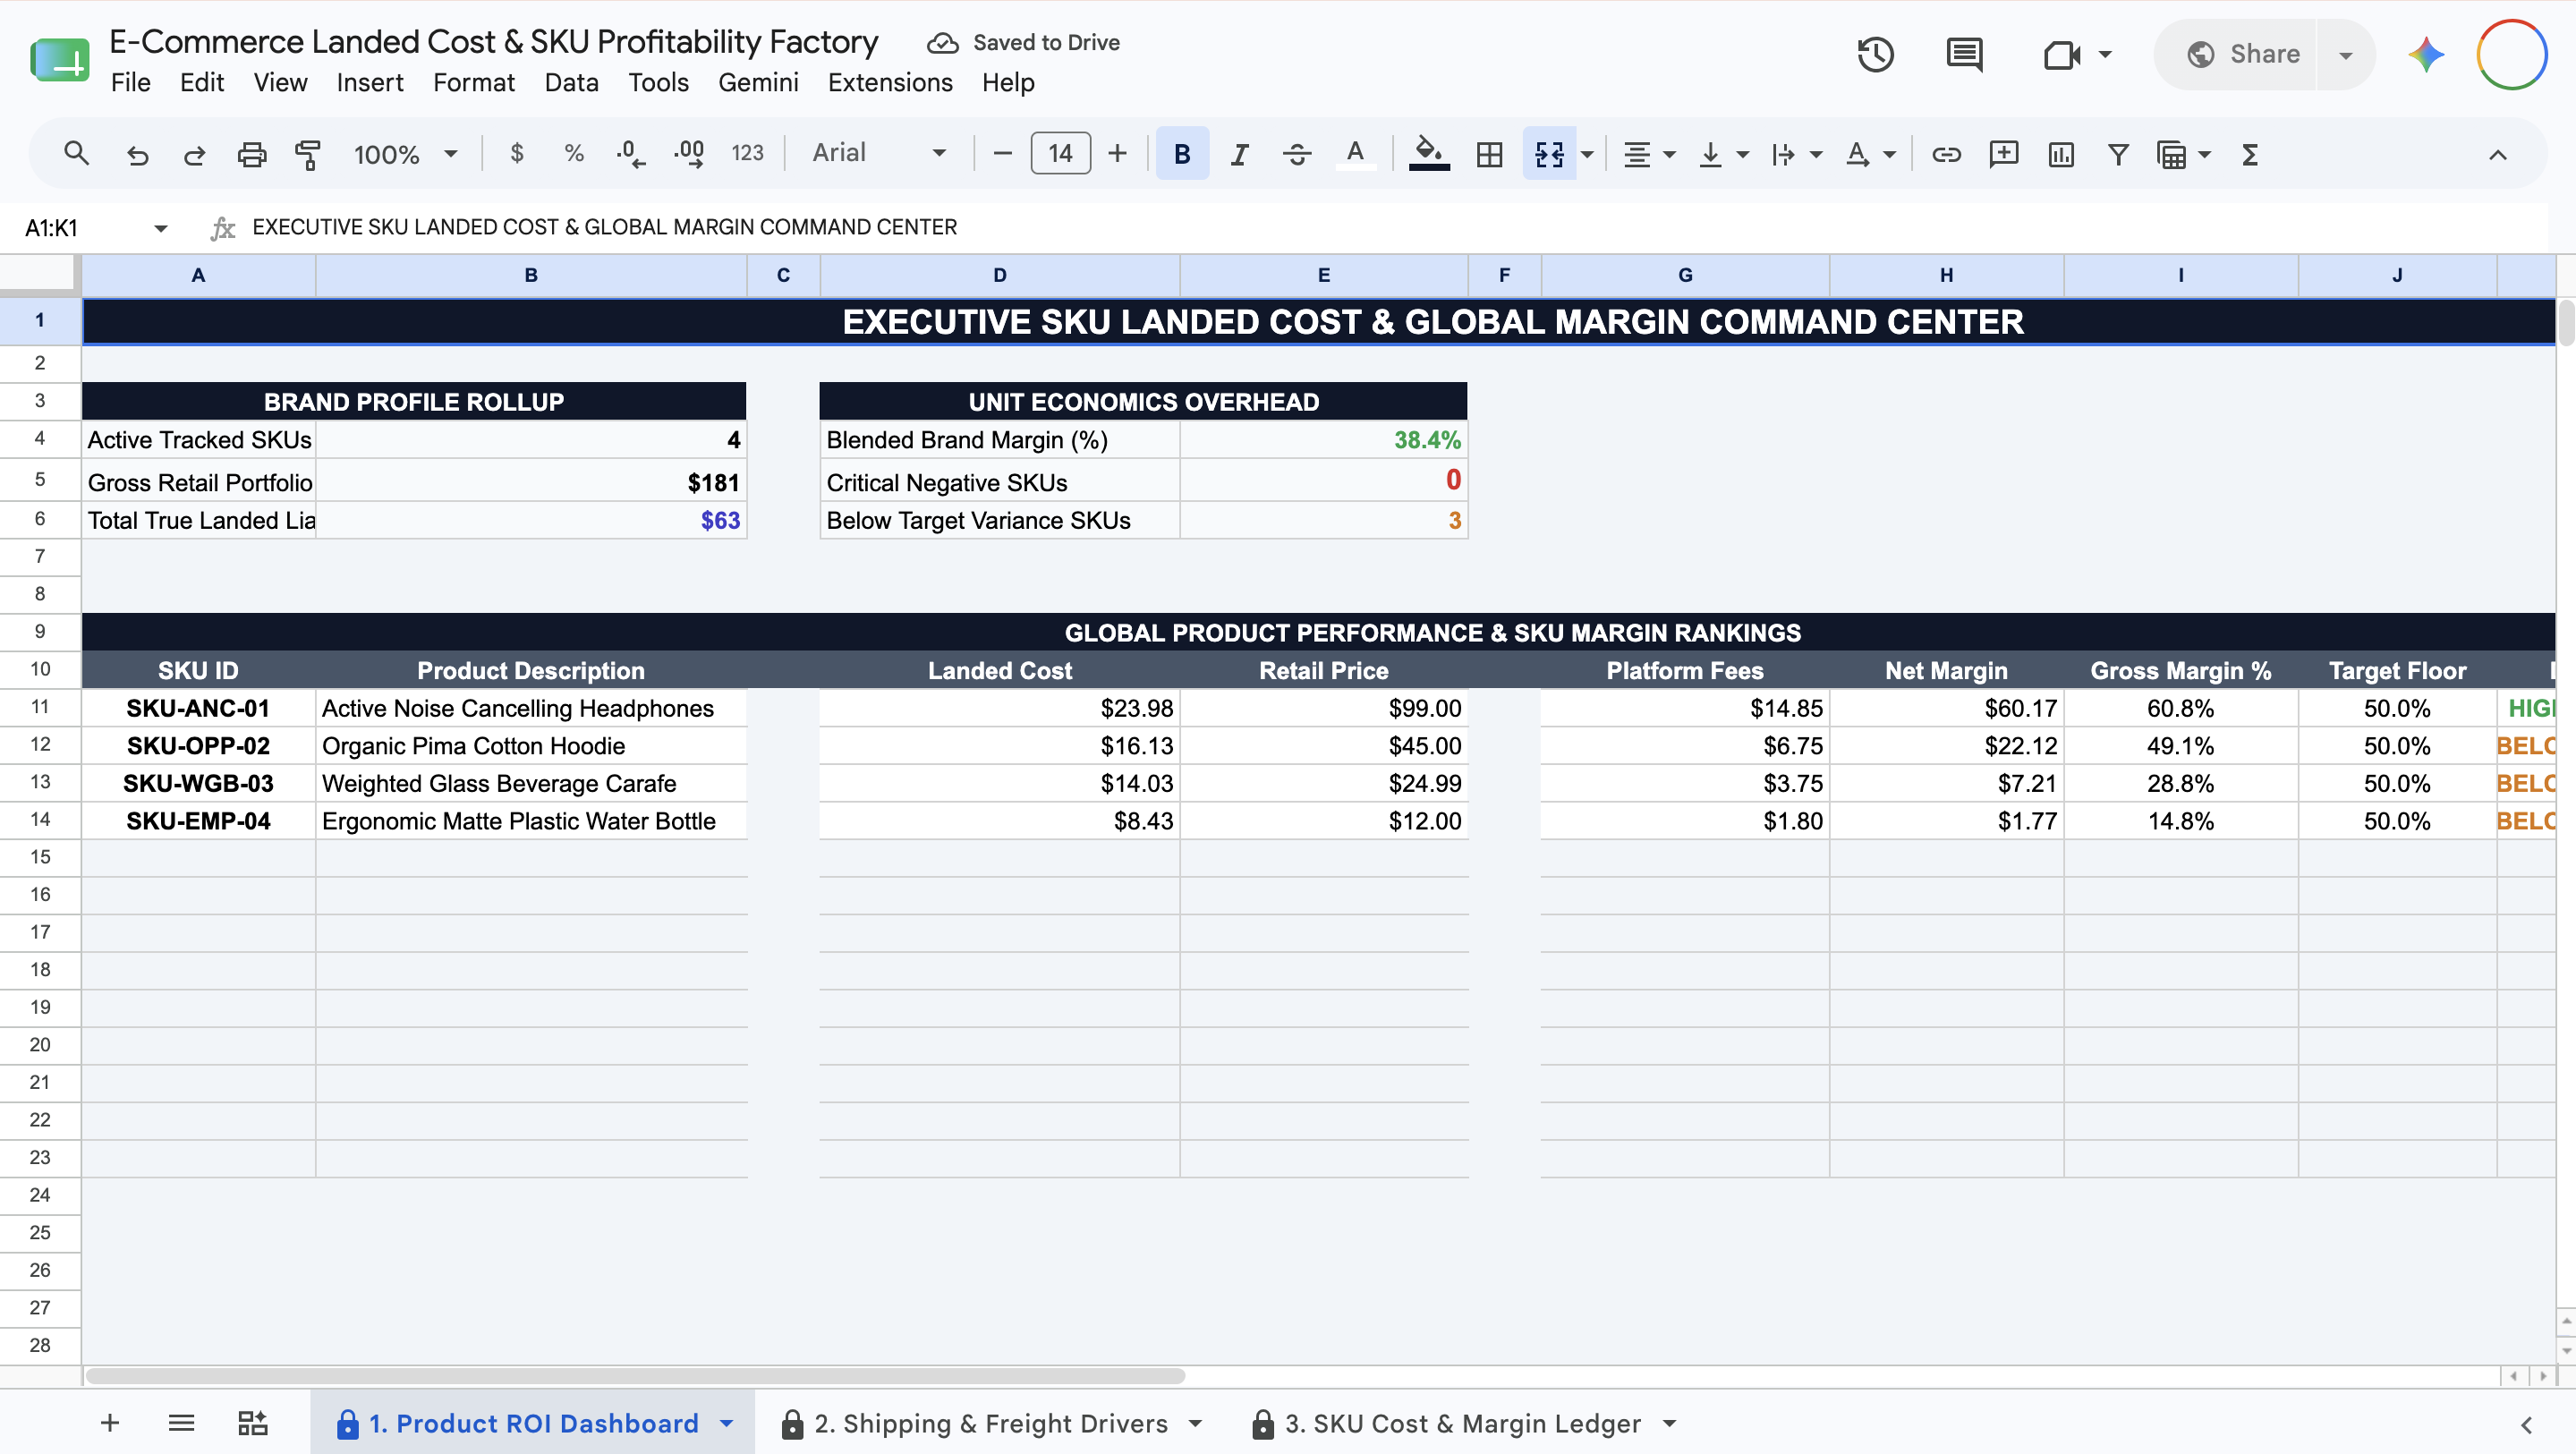
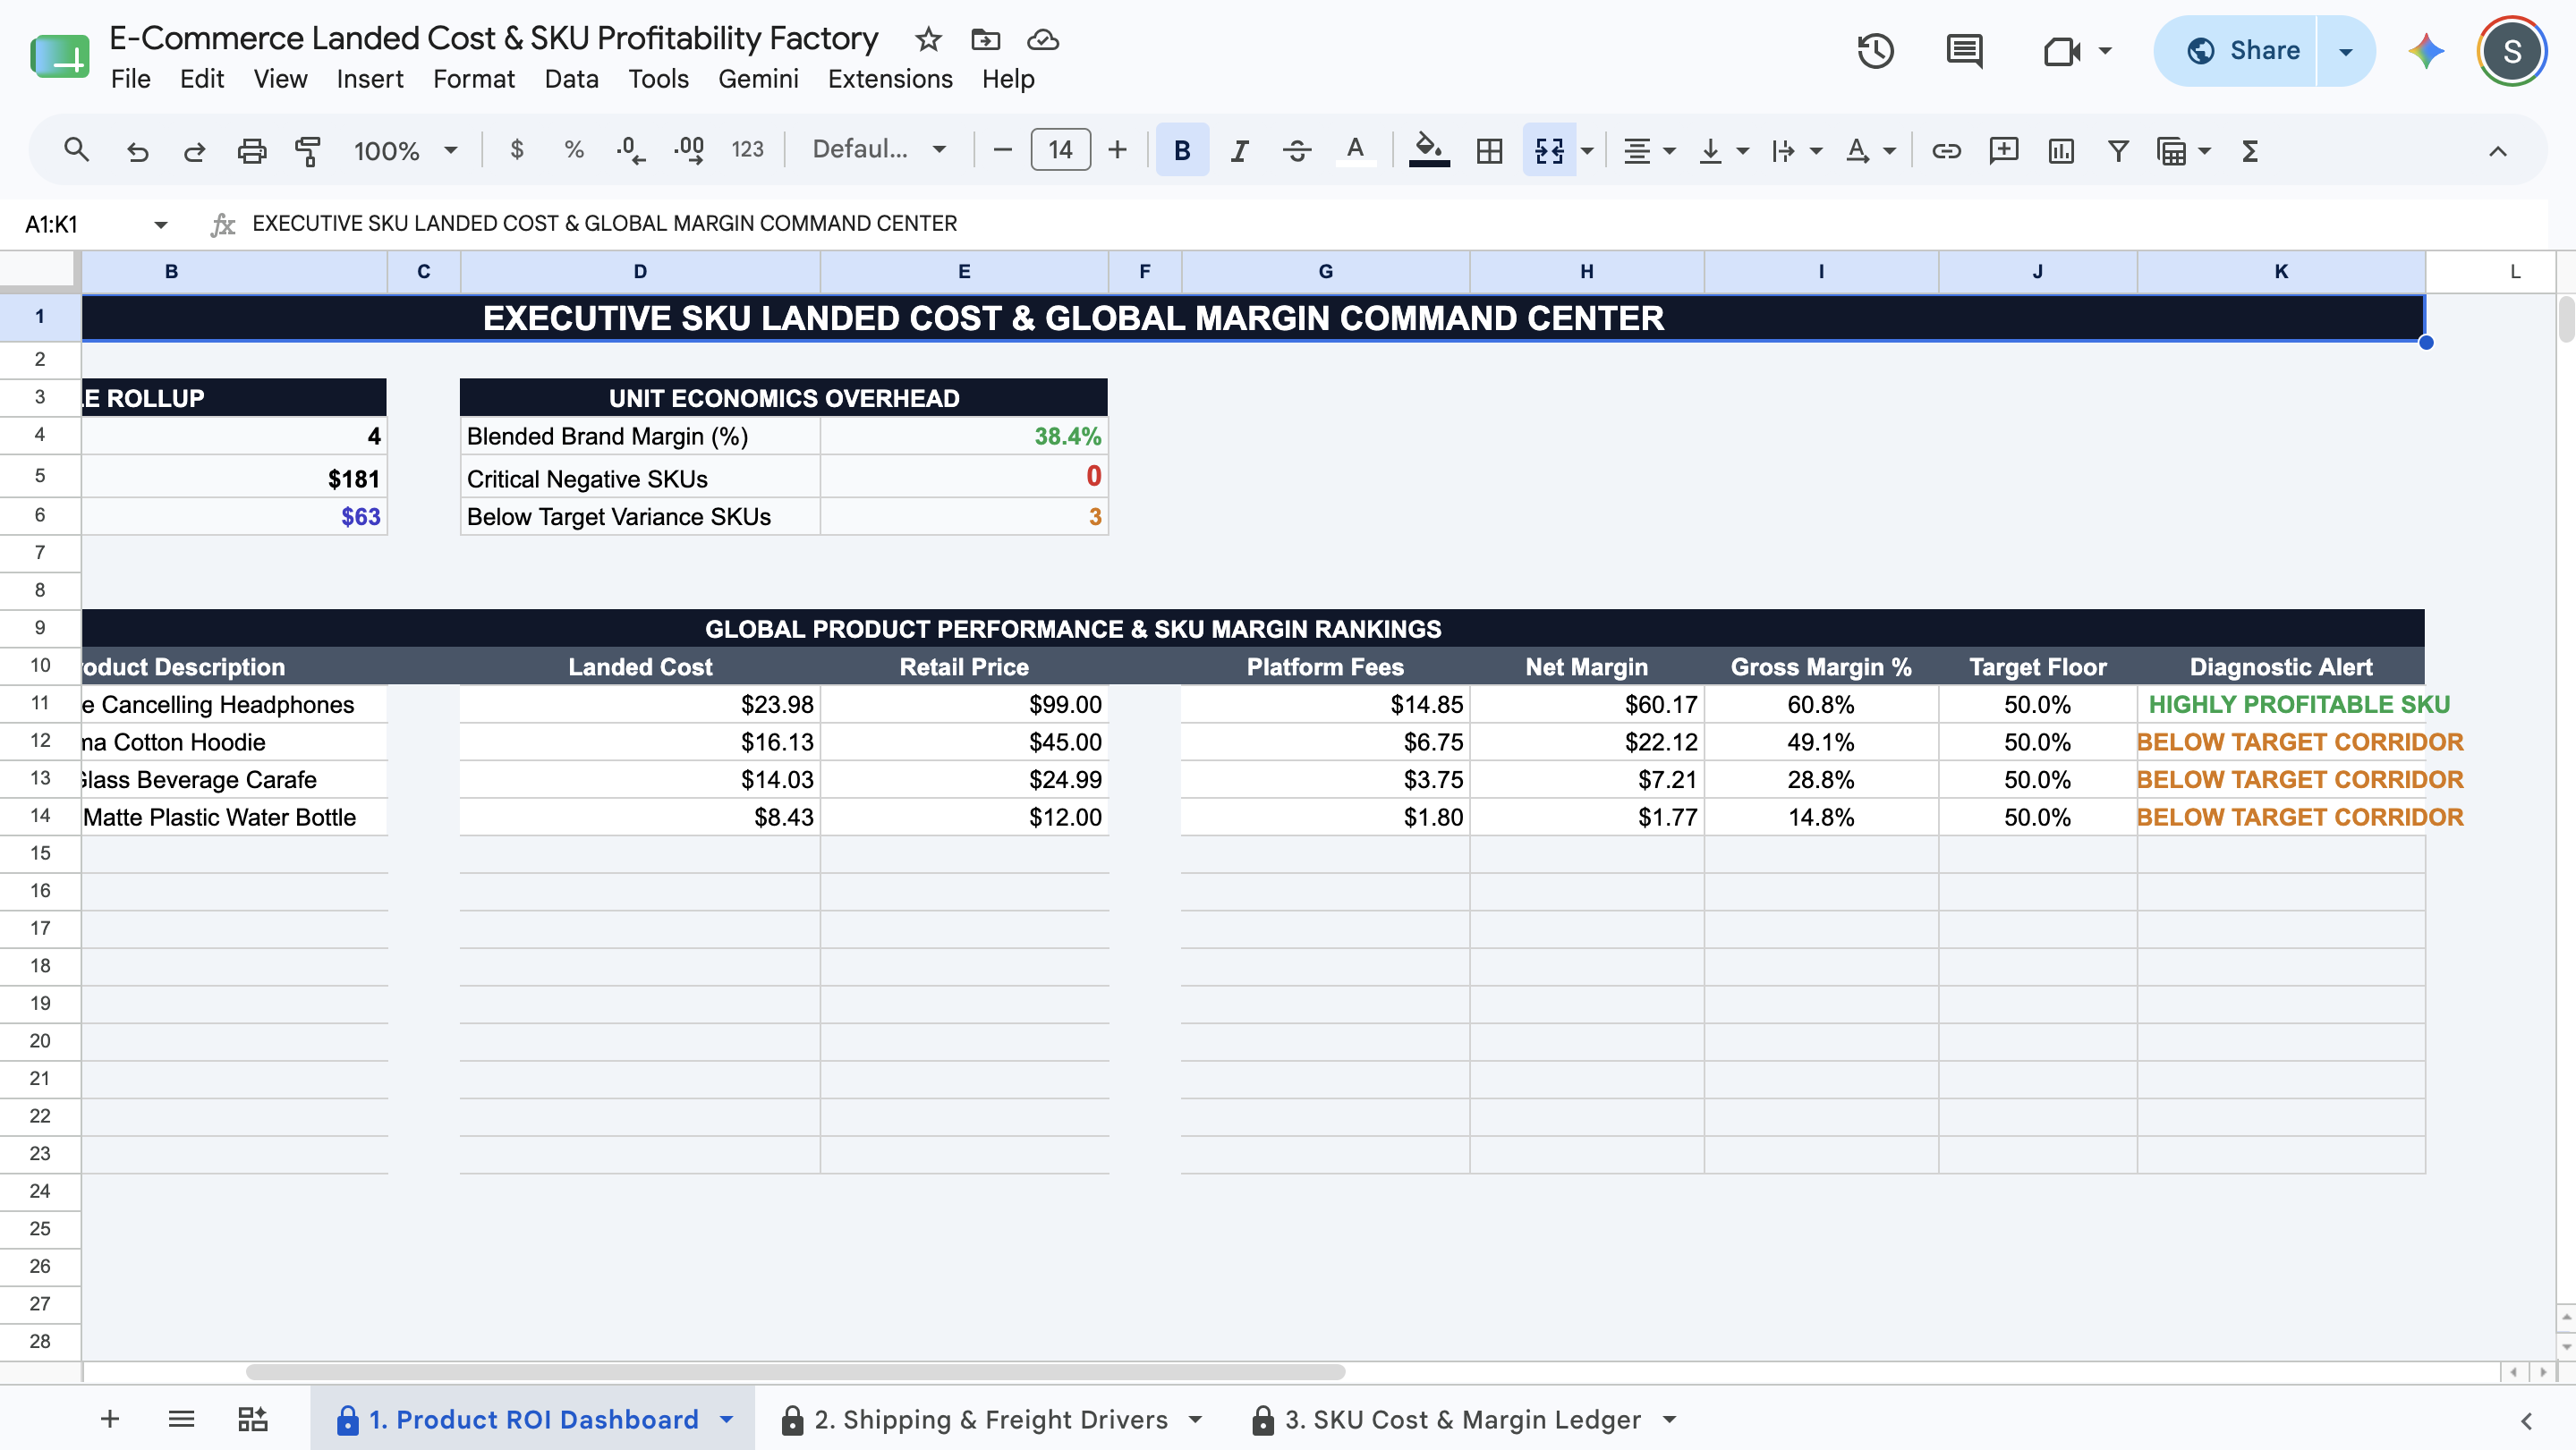
  • Automated Profitability Diagnostics: Every logged SKU is dynamically audited against your brand's acceptable margin floor (e.g., 50.0%). The system triggers clear visual tags: 🟢 HIGHLY PROFITABLE SKU for healthy items, 🟡 BELOW TARGET CORRIDOR for products requiring supplier renegotiation or price hikes, and 🚨 NEGATIVE MARGIN SKU when landed liabilities and platform take-rates exceed retail pricing—signaling immediate cash burn.

  • Macro Logistics Setup Canvas: Establish global operational rules on a dedicated setup dashboard. Define your minimum target gross margin floor, flat-rate 3PL pick-and-pack fees ($), average inbound domestic ground shipping ($), and marketplace referral take-rates (%) to drive universal accuracy across your entire product line.

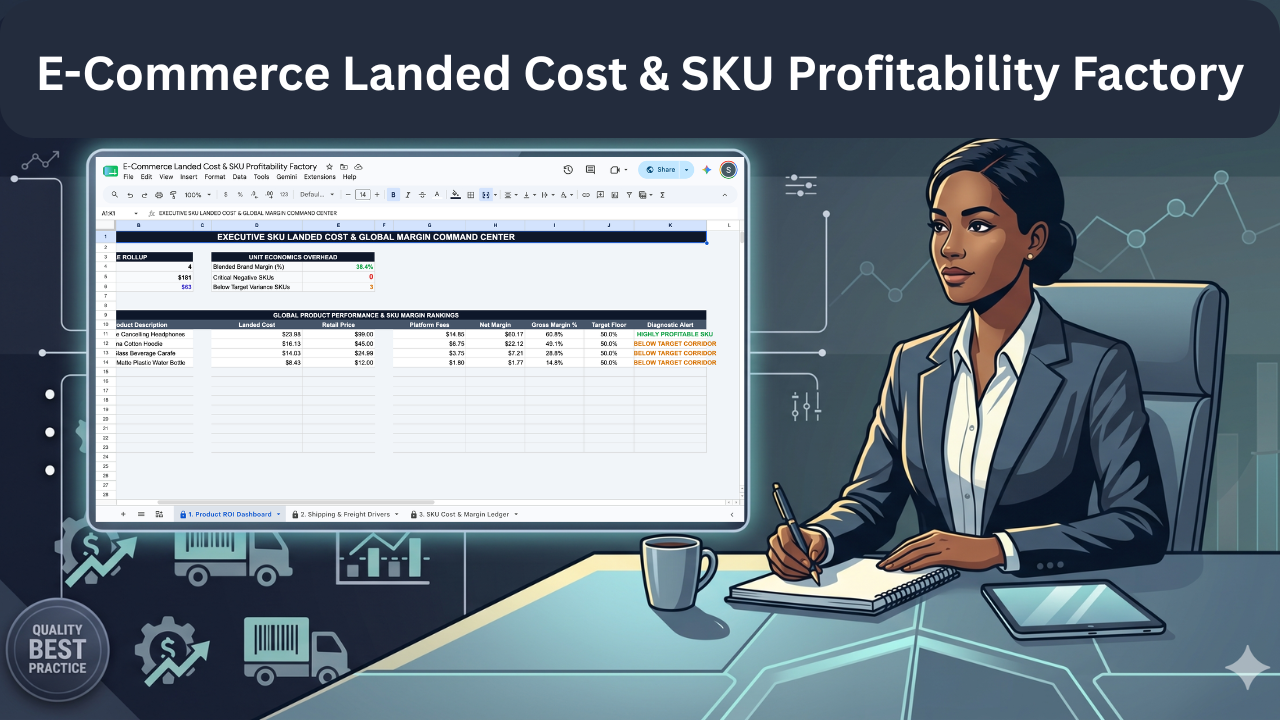
  • The C-Suite Command Center Dashboard: Get an instant, bird's-eye view of your brand's financial health. Monitor Active Tracked SKUs, Gross Retail Portfolio Value, Total True Landed Liabilities, Blended Brand Margin (%), and isolate risk immediately with automated count summaries for Critical Negative SKUs and Below Target Variance SKUs.

  • Global Product Performance Hierarchy: A software-grade executive summary table that ranks your active catalog side-by-side. Identify your true profit drivers at a glance and prune cash-draining SKUs with institutional authority.

  • Digitally Shrink-Wrapped Architecture: Engineered strictly as a cloud-native Google Sheet. Only the soft yellow (#FEF08A) input cells are unprotected. Your master tracking equations, freight allocation math, and presentation grids are entirely locked down to guarantee zero operational calculation drift or #REF! errors.


Stop scaling unprofitable products, guessing your true cost of goods sold, or paying recurring SaaS subscriptions for basic retail analytics. Establish institutional command over your physical product economics, protect your operating margins, and export clean, grid-free PDF executive performance memos natively from your web browser.

This Best Practice includes
1 Google Sheet, 1 User Guide

Acquire business license for $20.00 $2.00

Add to cart

Add to bookmarks

Discuss

Further information

Calculate deterministic unit economics (True Landed COGS, Net Margin $, and Gross Margin %) across individual physical product SKUs

Allocate container freight costs, customs tariffs, 3PL fulfillment fees, and platform take-rates down to the individual unit level automatically

Automate profitability diagnostics to instantly flag cash-burning products where landed liabilities exceed retail pricing

Aggregate catalog-wide retail value, total landed liabilities, and blended brand margins into a centralized C-suite monthly dashboard

Evaluate product performance hierarchies side-by-side to systematically reallocate marketing budget toward high-margin SKUs

Export an immutable, grid-free PDF product profitability memorandum for supplier negotiations, executive syncs, or investor reporting

Brand owners, Amazon FBA sellers, and Shopify D2C operators managing physical product catalogs and global supply chains

E-commerce growth leads and fractional CFOs needing a transparent, cloud-sharable unit economics ledger to prove product viability

Operations teams seeking to bridge the data gap between factory purchase orders and final net retail profitability

Teams looking to replace expensive, recurring inventory analytics software with an institutional, flat-fee cloud spreadsheet

E-commerce operations requiring real-time, bi-directional API data integrations with Shopify, Amazon Seller Central, or 3PL warehouse management systems

Brands requiring automated, multi-currency real-time foreign exchange (FX) rate hedging and dynamic daily currency conversions

Users looking for a standard Microsoft Excel (.xlsx) file workbook (This asset is built natively and exclusively for Google Sheets)


0.0 / 5 (0 votes)

please wait...