Originally published: 01/05/2018 09:15
Last version published: 03/04/2019 13:03
Publication number: ELQ-66154-5
View all versions & Certificate
Last version published: 03/04/2019 13:03
Publication number: ELQ-66154-5
View all versions & Certificate

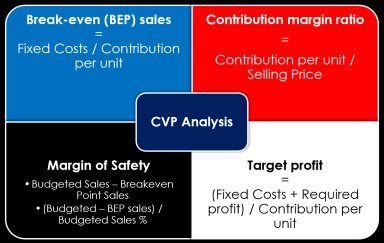
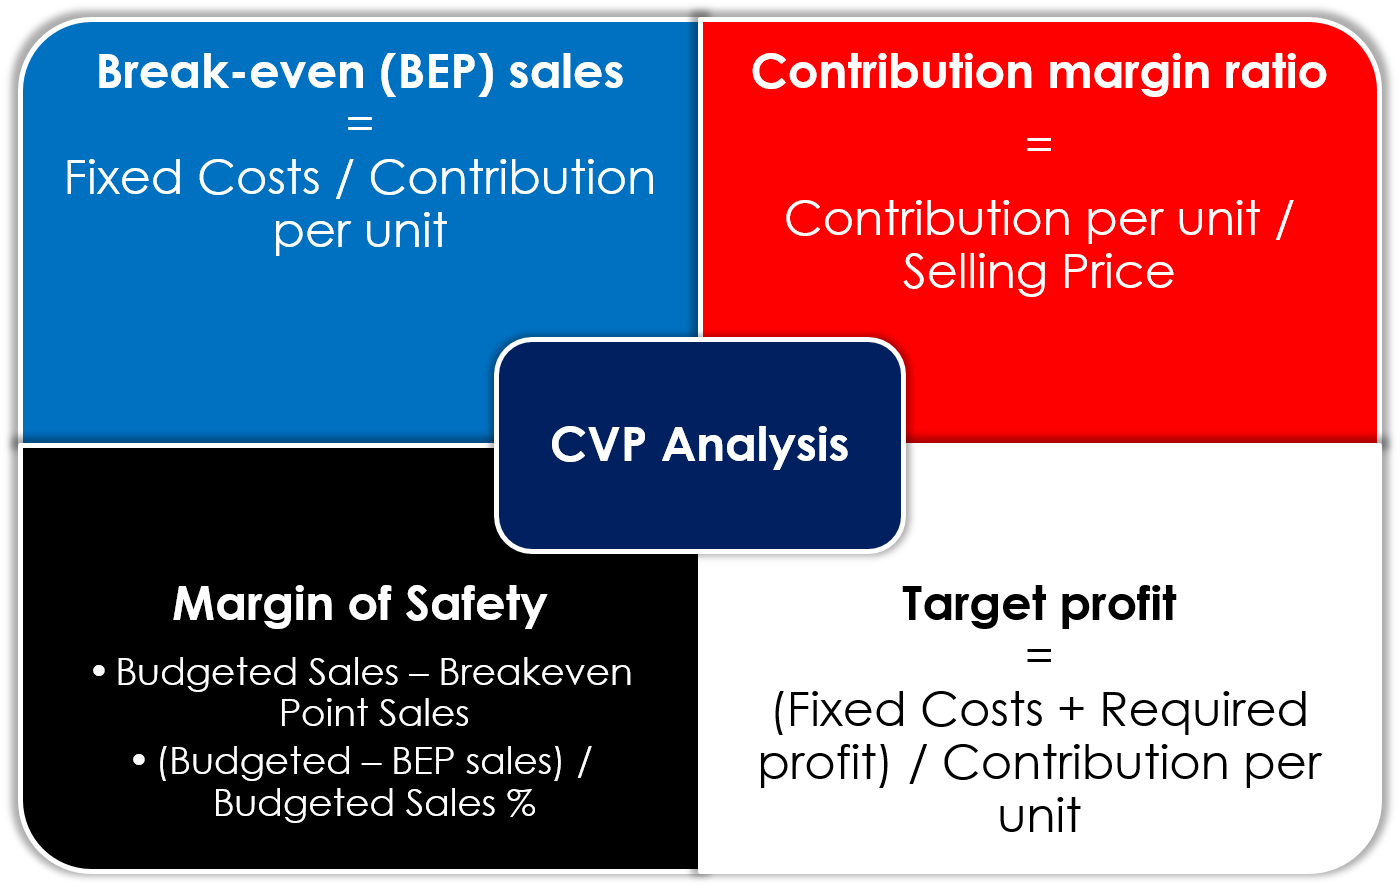
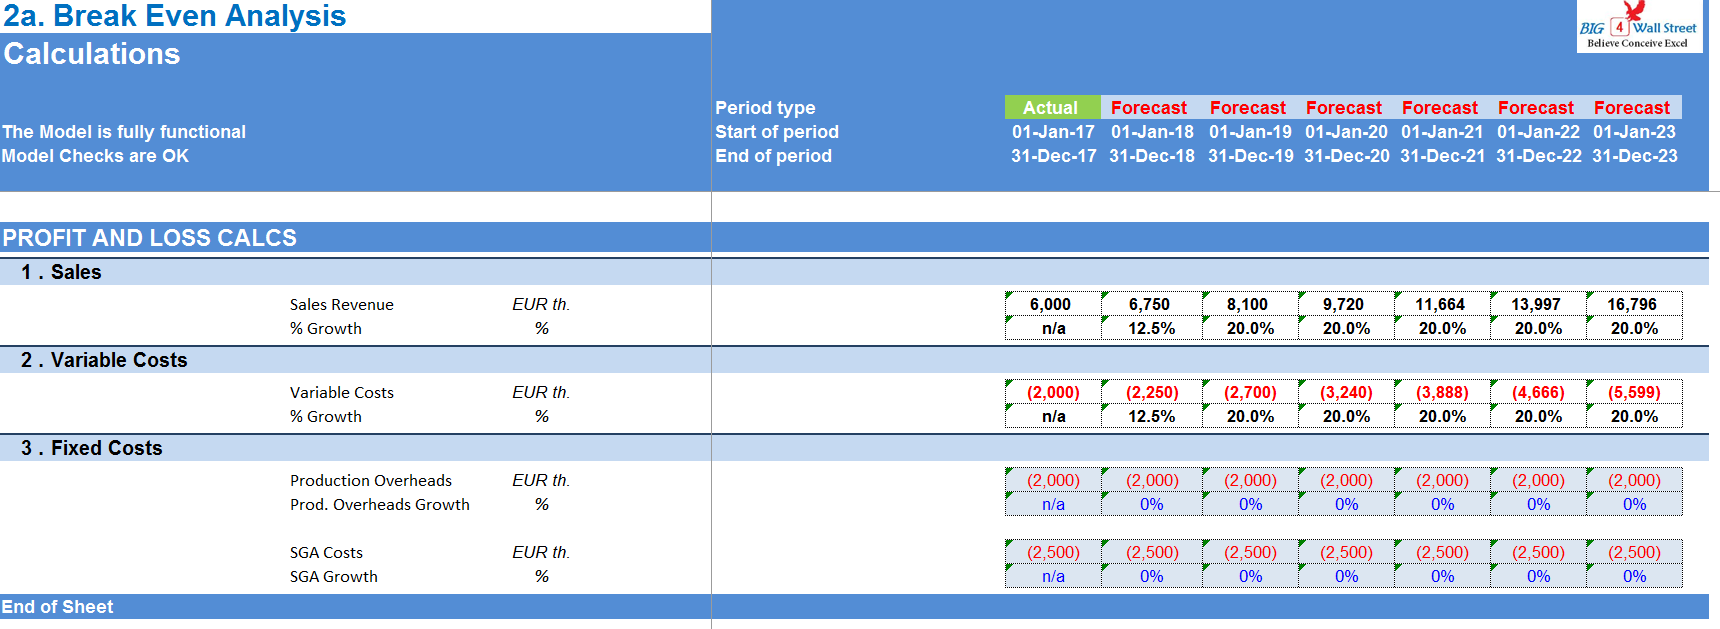
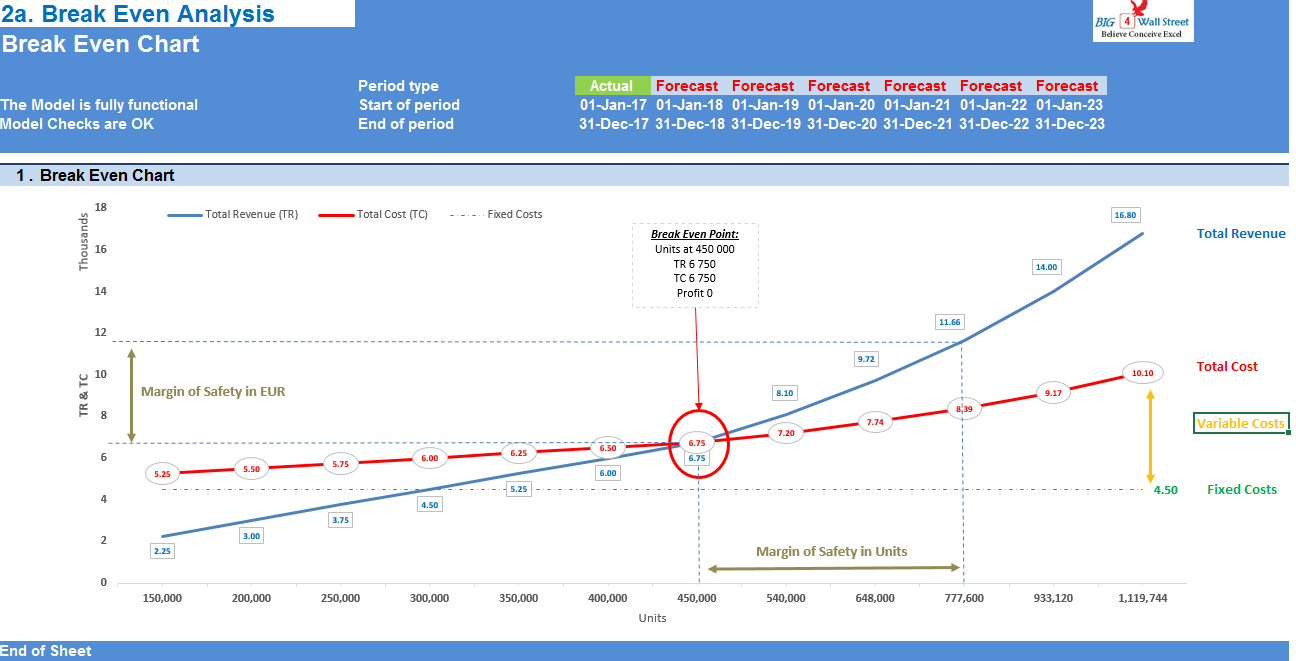
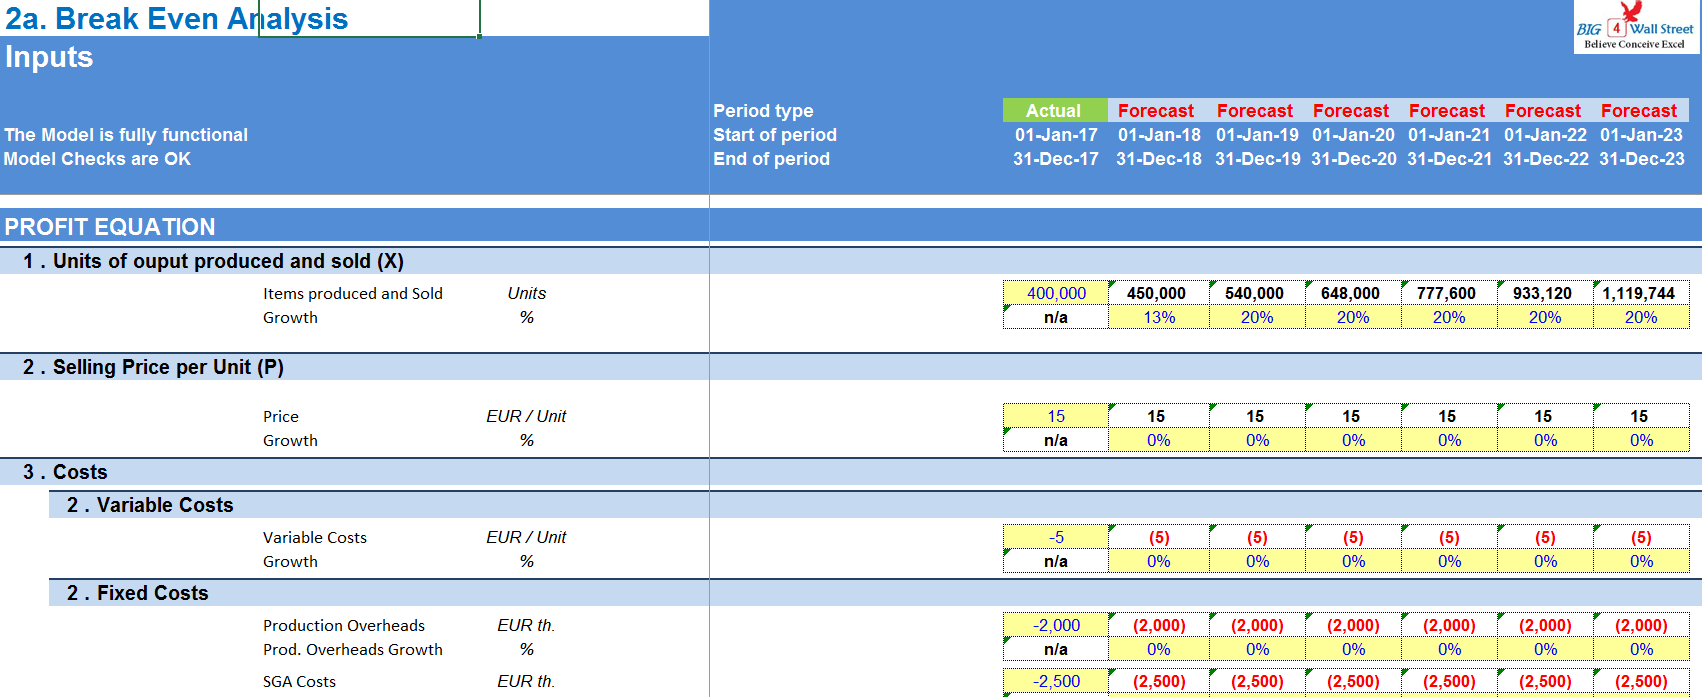
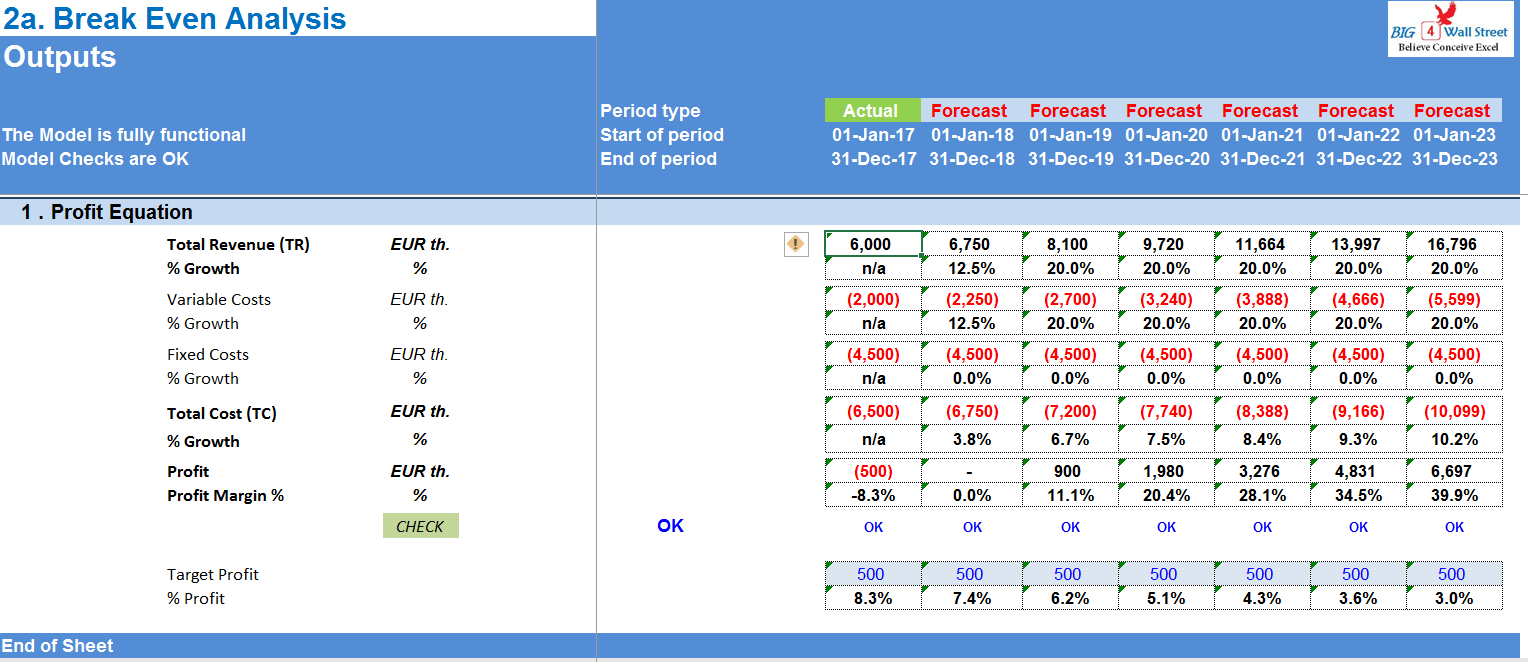
Break Even Analysis / Cost Volume Profit Analysis Excel Model
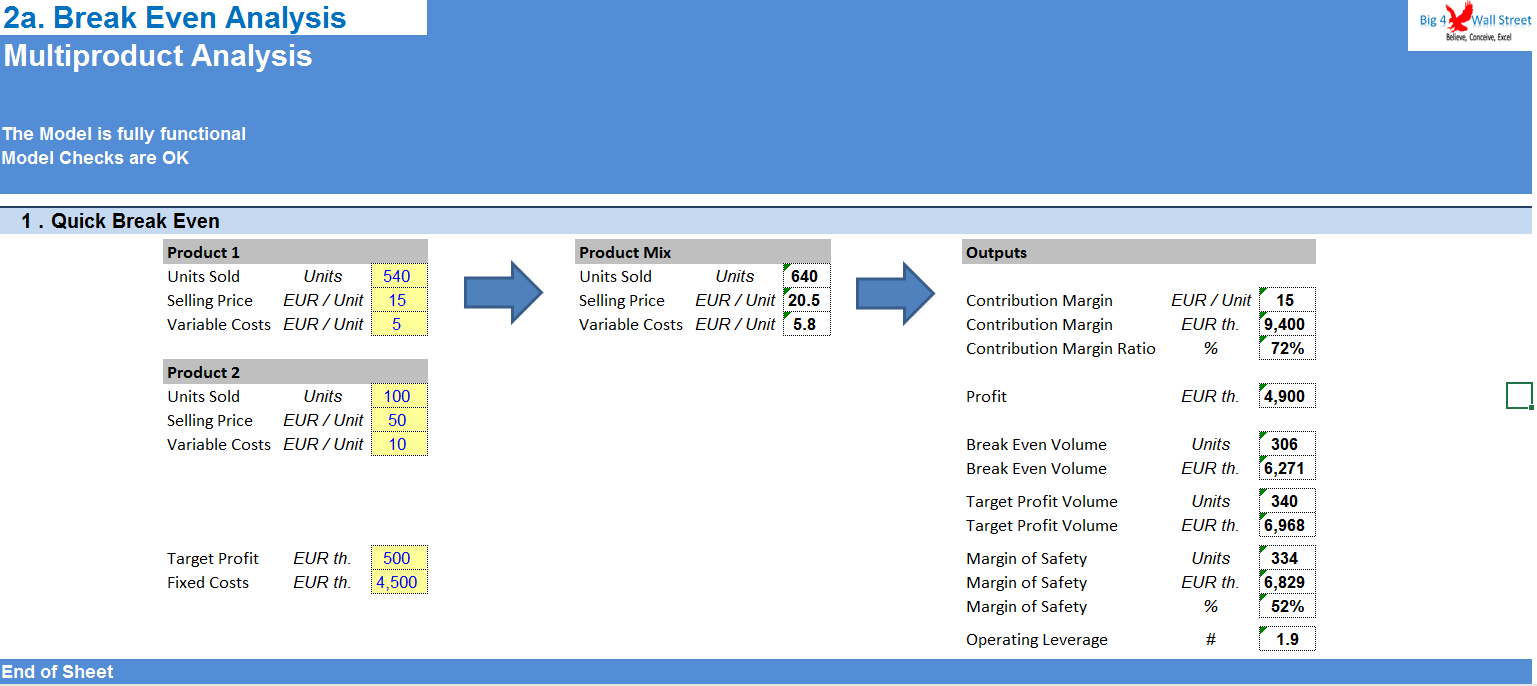
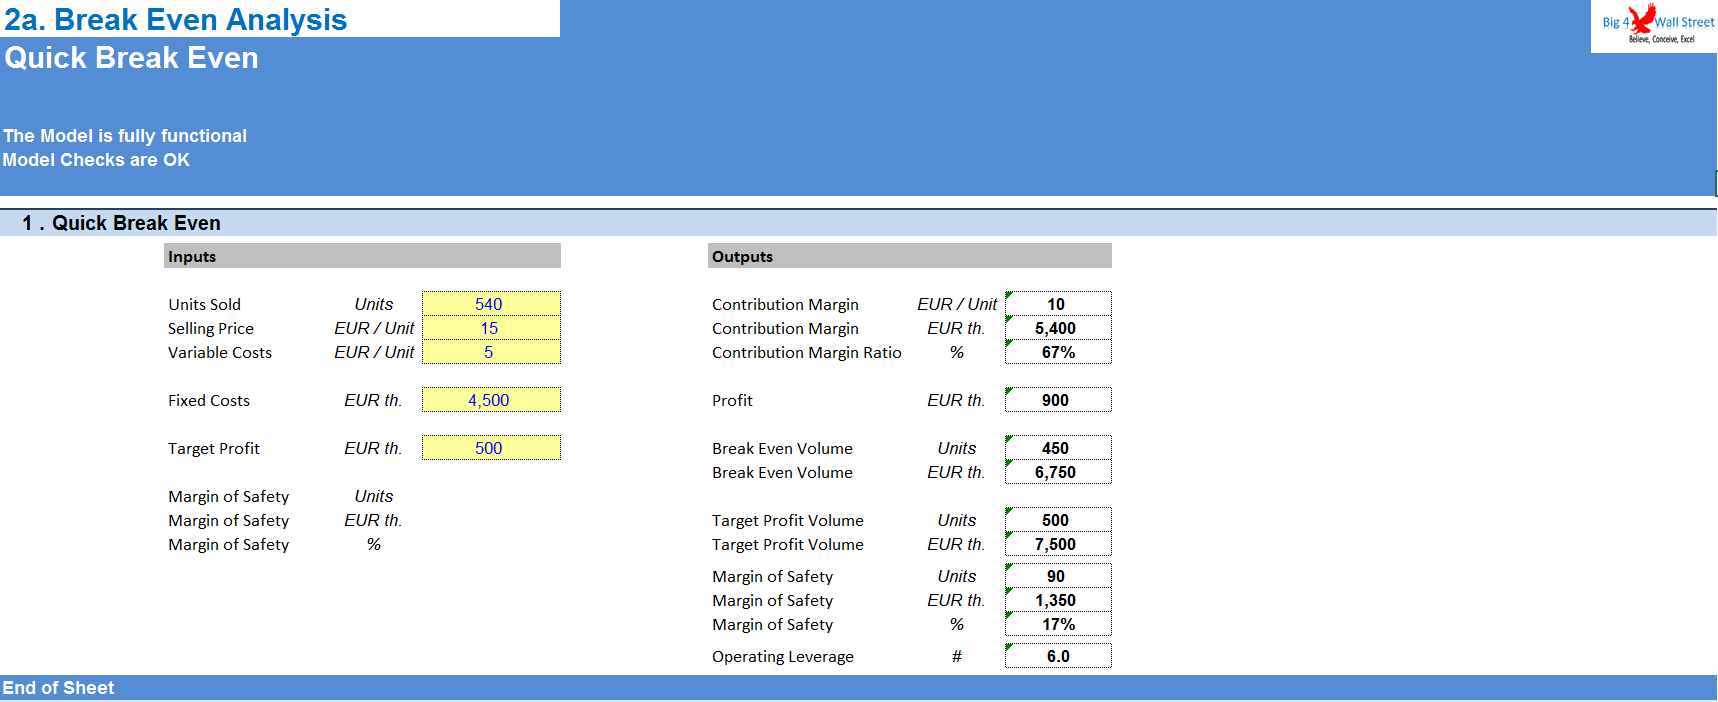
A full Break-even analysis Excel Model to analyse when your product/service reaches profitability.
Further information
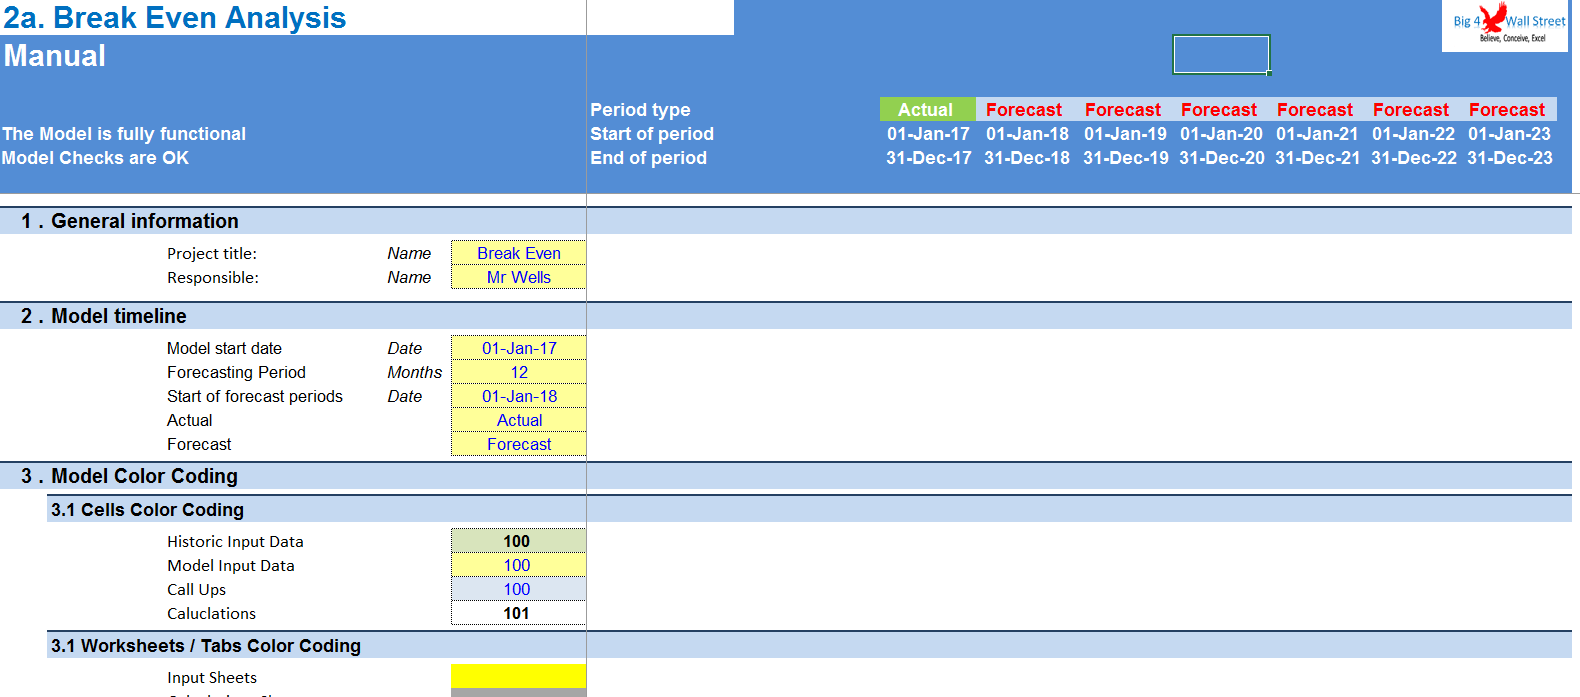
To help the user perform a break even analysis to see the point above which he is able to make a profit.
Simple linear assumptions for costs
Does not apply to economies of scale
