


Originally published: 05/09/2022 07:56
Last version published: 03/01/2024 15:58
Publication number: ELQ-28024-3
View all versions & Certificate
Last version published: 03/01/2024 15:58
Publication number: ELQ-28024-3
View all versions & Certificate

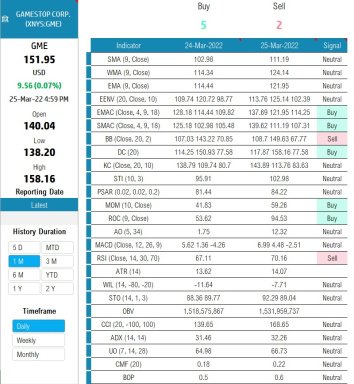
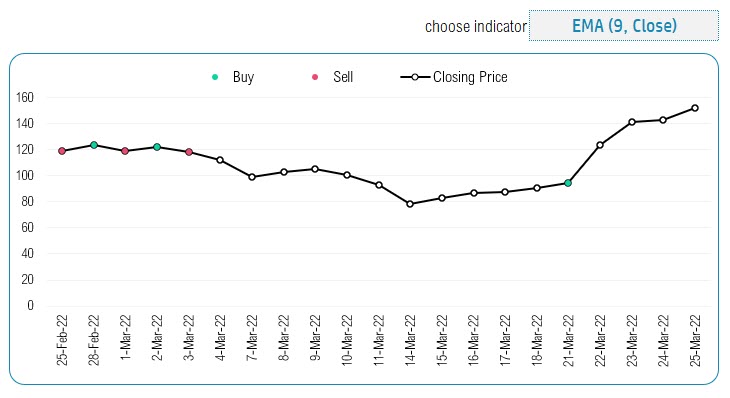
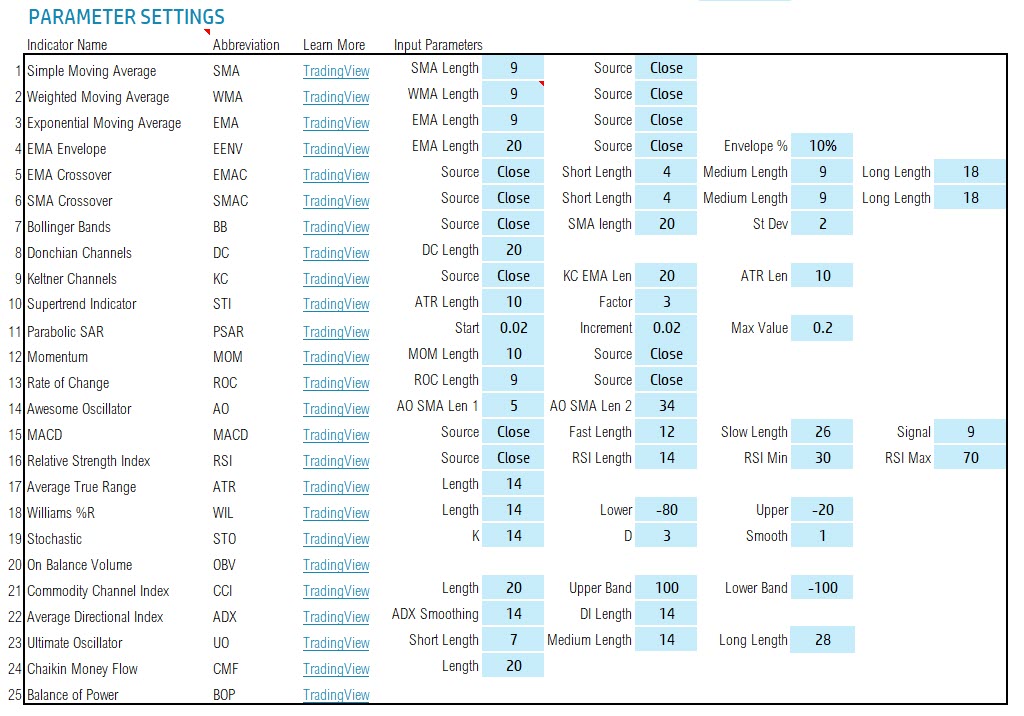
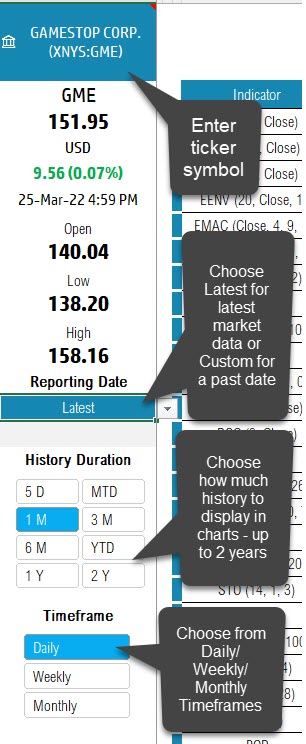
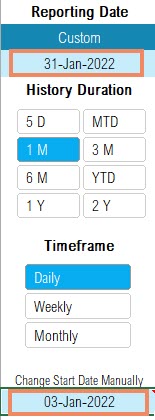
Technical Analysis Pro Excel Template (25 Technical Indicators)
We present to you our ‘Technical Analysis Pro Excel Template’ for technical chart analysis of various indicators effectively.
Further information
DISCLAIMER: We do not provide any trading or financial advice. The template uses Excel formulas calculate mathematically the technical indicator values and applies specific rules or conditions to determine Buy/Sell signal. They are documented in our support portal.
