


Originally published: 19/09/2022 11:34
Publication number: ELQ-88373-1
View all versions & Certificate
Publication number: ELQ-88373-1
View all versions & Certificate

E-Commerce Monthly Sales Analytics
A dynamic analytics dashboard for e-commerce start-ups to monitor their monthly sales and generate useful analytics on their products, customers and segments.
Description
Even before the Covid period, businesses were becoming more and more serious about their e-commerce aspect of operations. Only those businesses that were robust and agile to shift their operations electronically, had managed to generate good returns during the lock-down months.
Despite the vast availability of software and developers to customize solutions for businesses that allow them to perform sales analytics, still it is sometimes useful to do it the old-fashioned way by downloading this data onto a spreadsheet and generate this analytics. At least till your organization has built a full-fledged ERP and linked it to live e-commerce sales while generating the necessary visualizations.
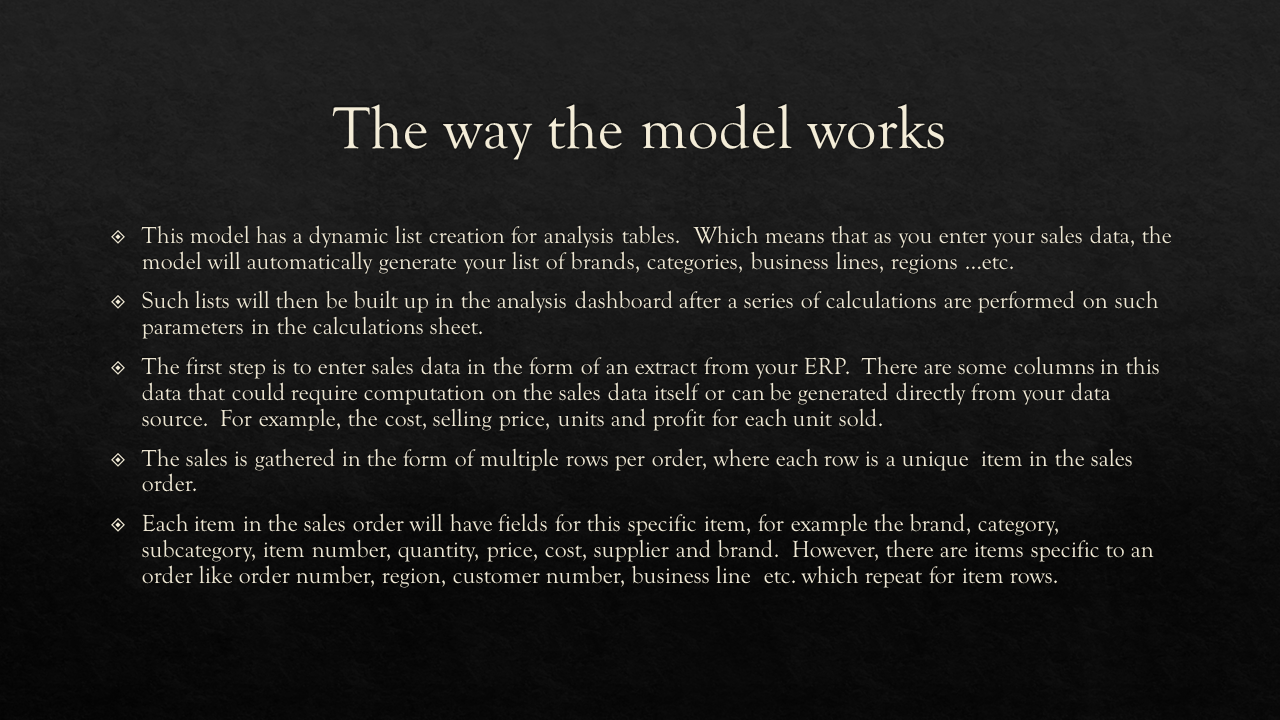
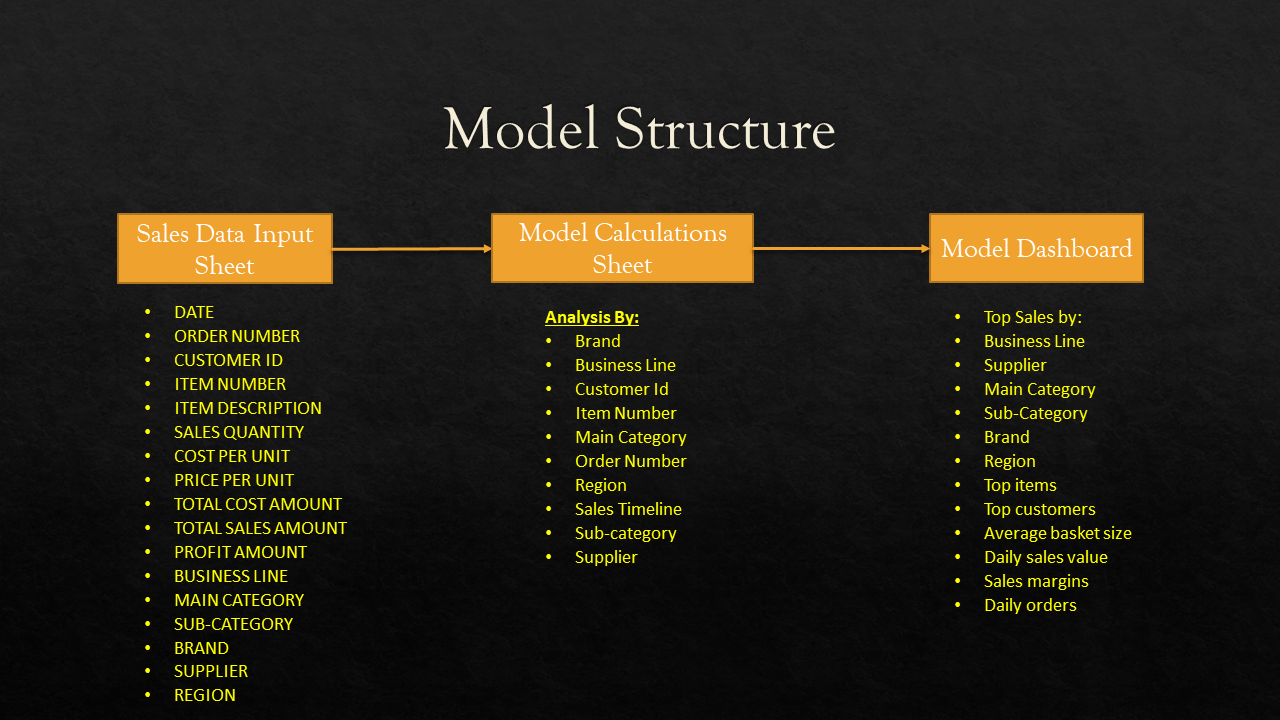
This model has a dynamic list creation for analysis tables. Which means that as you enter your sales data, the model will automatically generate your list of brands, categories, business lines, regions …etc. Such lists will then be built up in the analysis dashboard after a series of calculations are performed on such parameters in the calculations sheet.
The first step is to enter sales data in the form of an extract from your ERP. There are some columns in this data that could require computation on the sales data itself or can be generated directly from your data source. For example, the cost, selling price, units and profit for each unit sold.
The sales is gathered in the form of multiple rows per order, where each row is a unique item in the sales order. Each item in the sales order will have fields for this specific item, for example the brand, category, subcategory, item number, quantity, price, cost, supplier and brand. However there are items specific to an order like order number, region, customer number, business line etc.
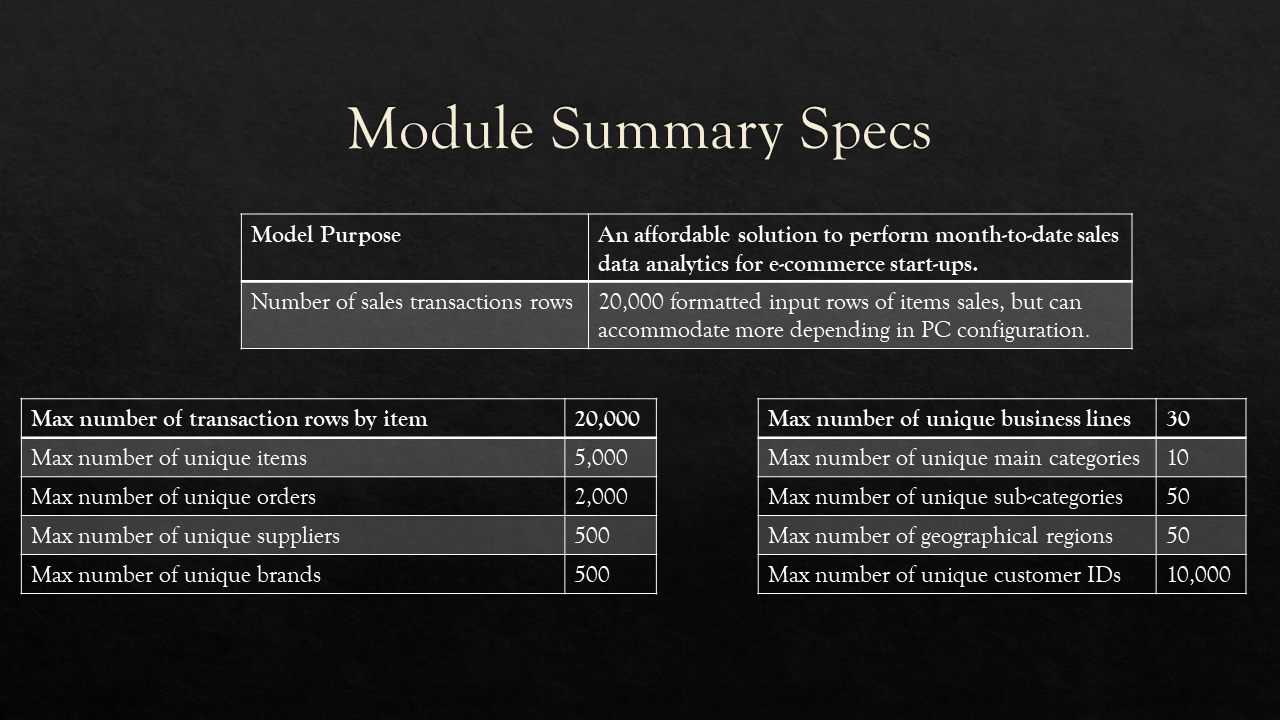
Model Purpose: An affordable solution to perform month-to-date sales data analytics for e-commerce start-ups.
Model Specs:
Number of sales transactions rows: 20,000 formatted input rows of items sales, but can accommodate more depending in PC configuration.
Max number of transaction rows by item: 20,000
Max number of unique items: 5,000
Max number of unique orders: 2,000
Max number of unique suppliers: 500
Max number of unique brands: 500
Max number of unique business lines: 30
Max number of unique main categories: 10
Max number of unique sub-categories: 50
Max number of geographical regions: 50
Max number of unique customer IDs: 10,000
Model Components:
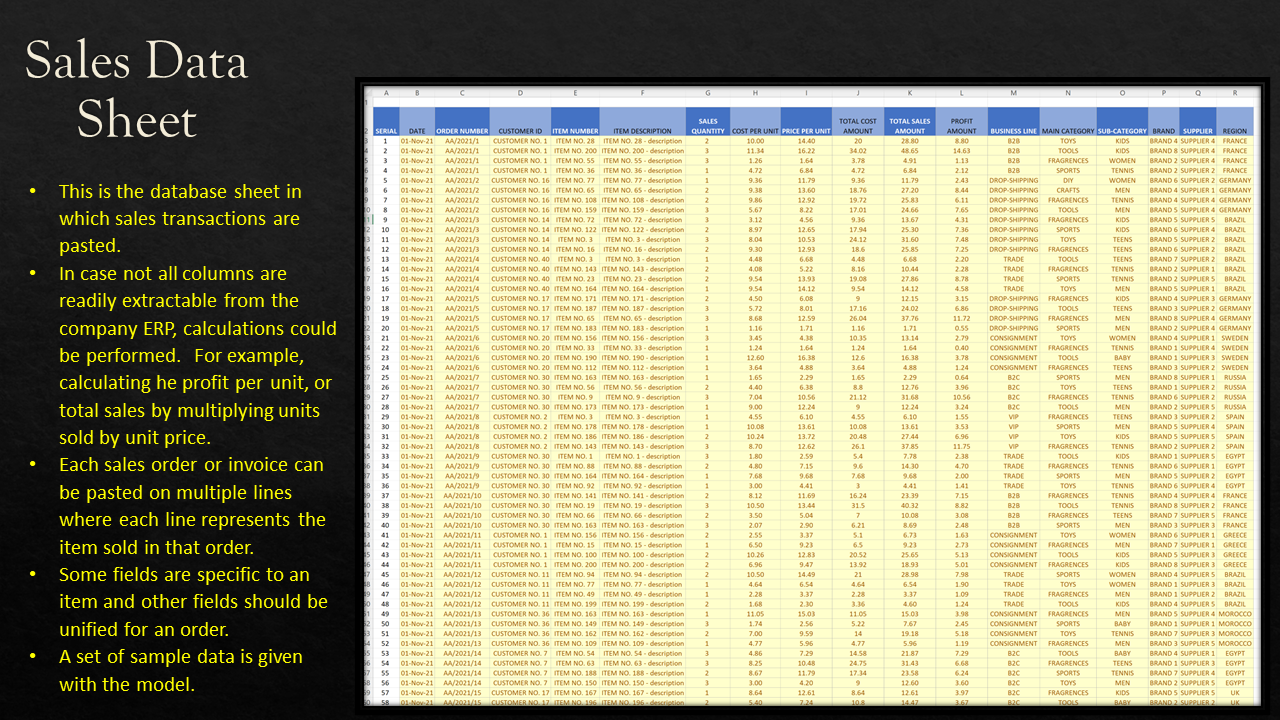
Sales Data Sheet: This is the database sheet in which sales transactions are pasted. In case not all columns are readily extractable from the company ERP, calculations could be performed. For example calculating he profit per unit, or total sales by multiplying units sold by unit price. Each sales order or invoice can be pasted on multiple lines where each line represents the item sold in that order. Some fields are specific to an item and other fields should be unified for an order. A set of sample data is given with the model.
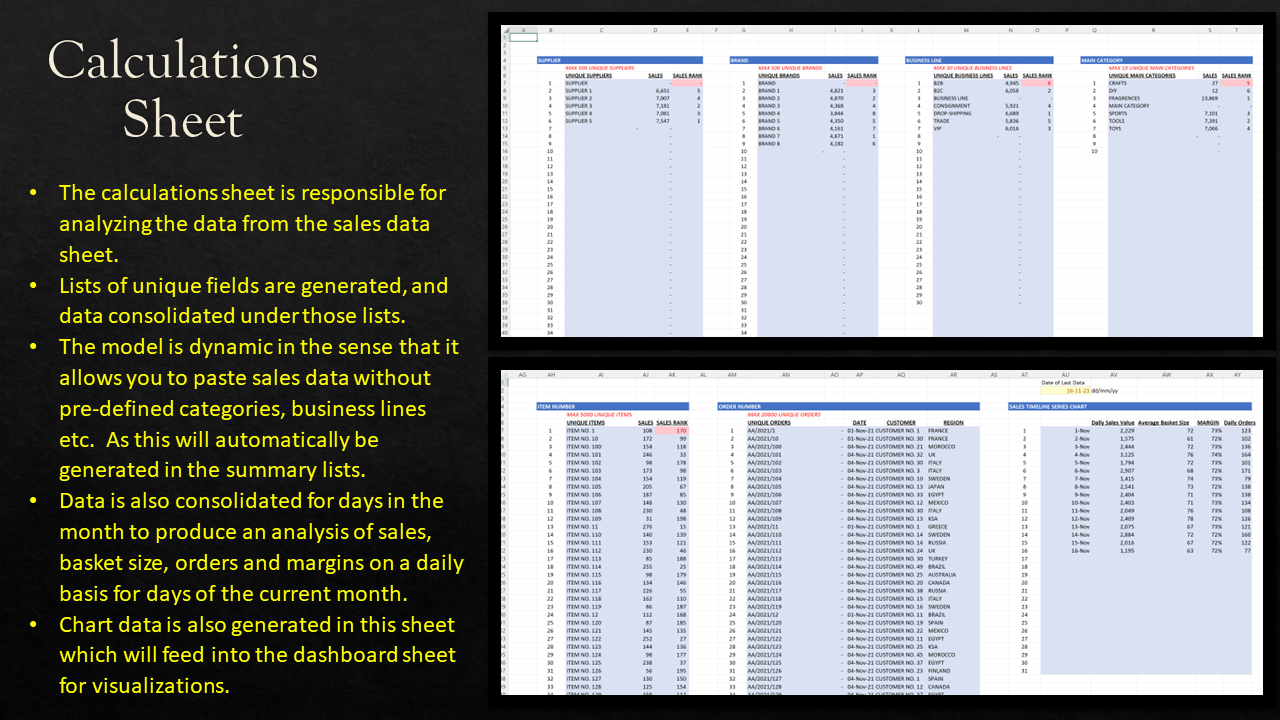
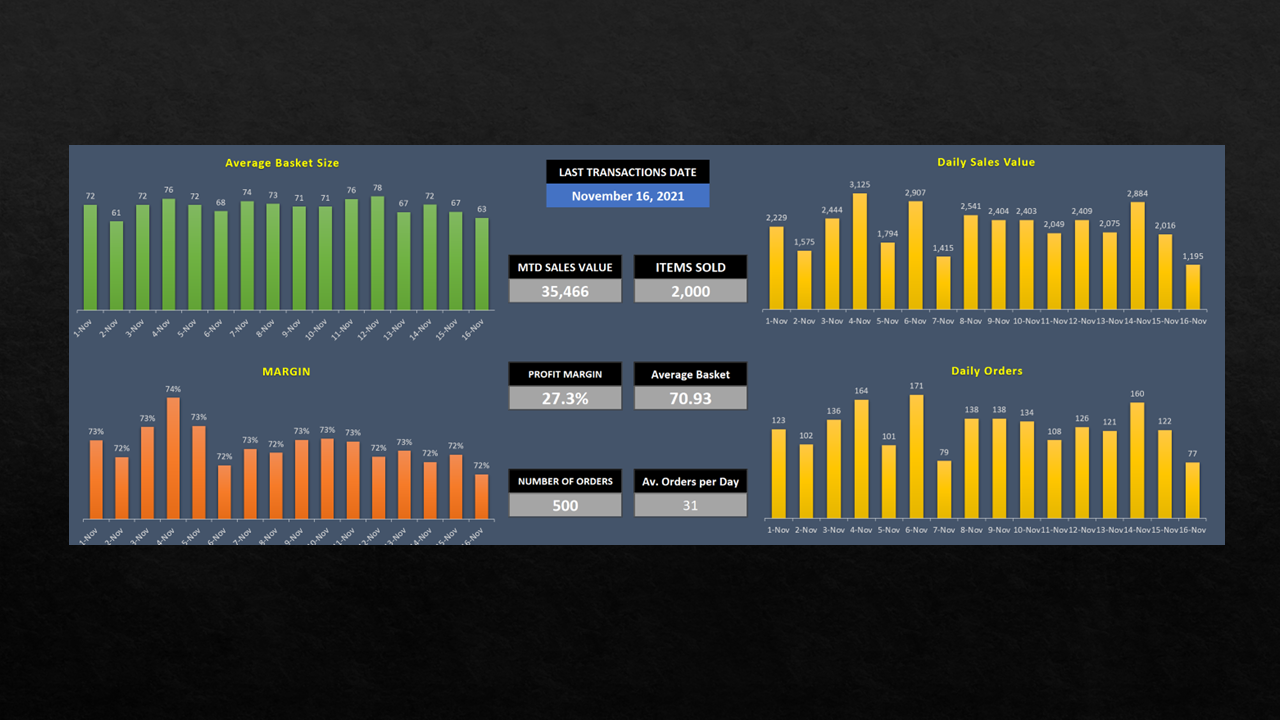
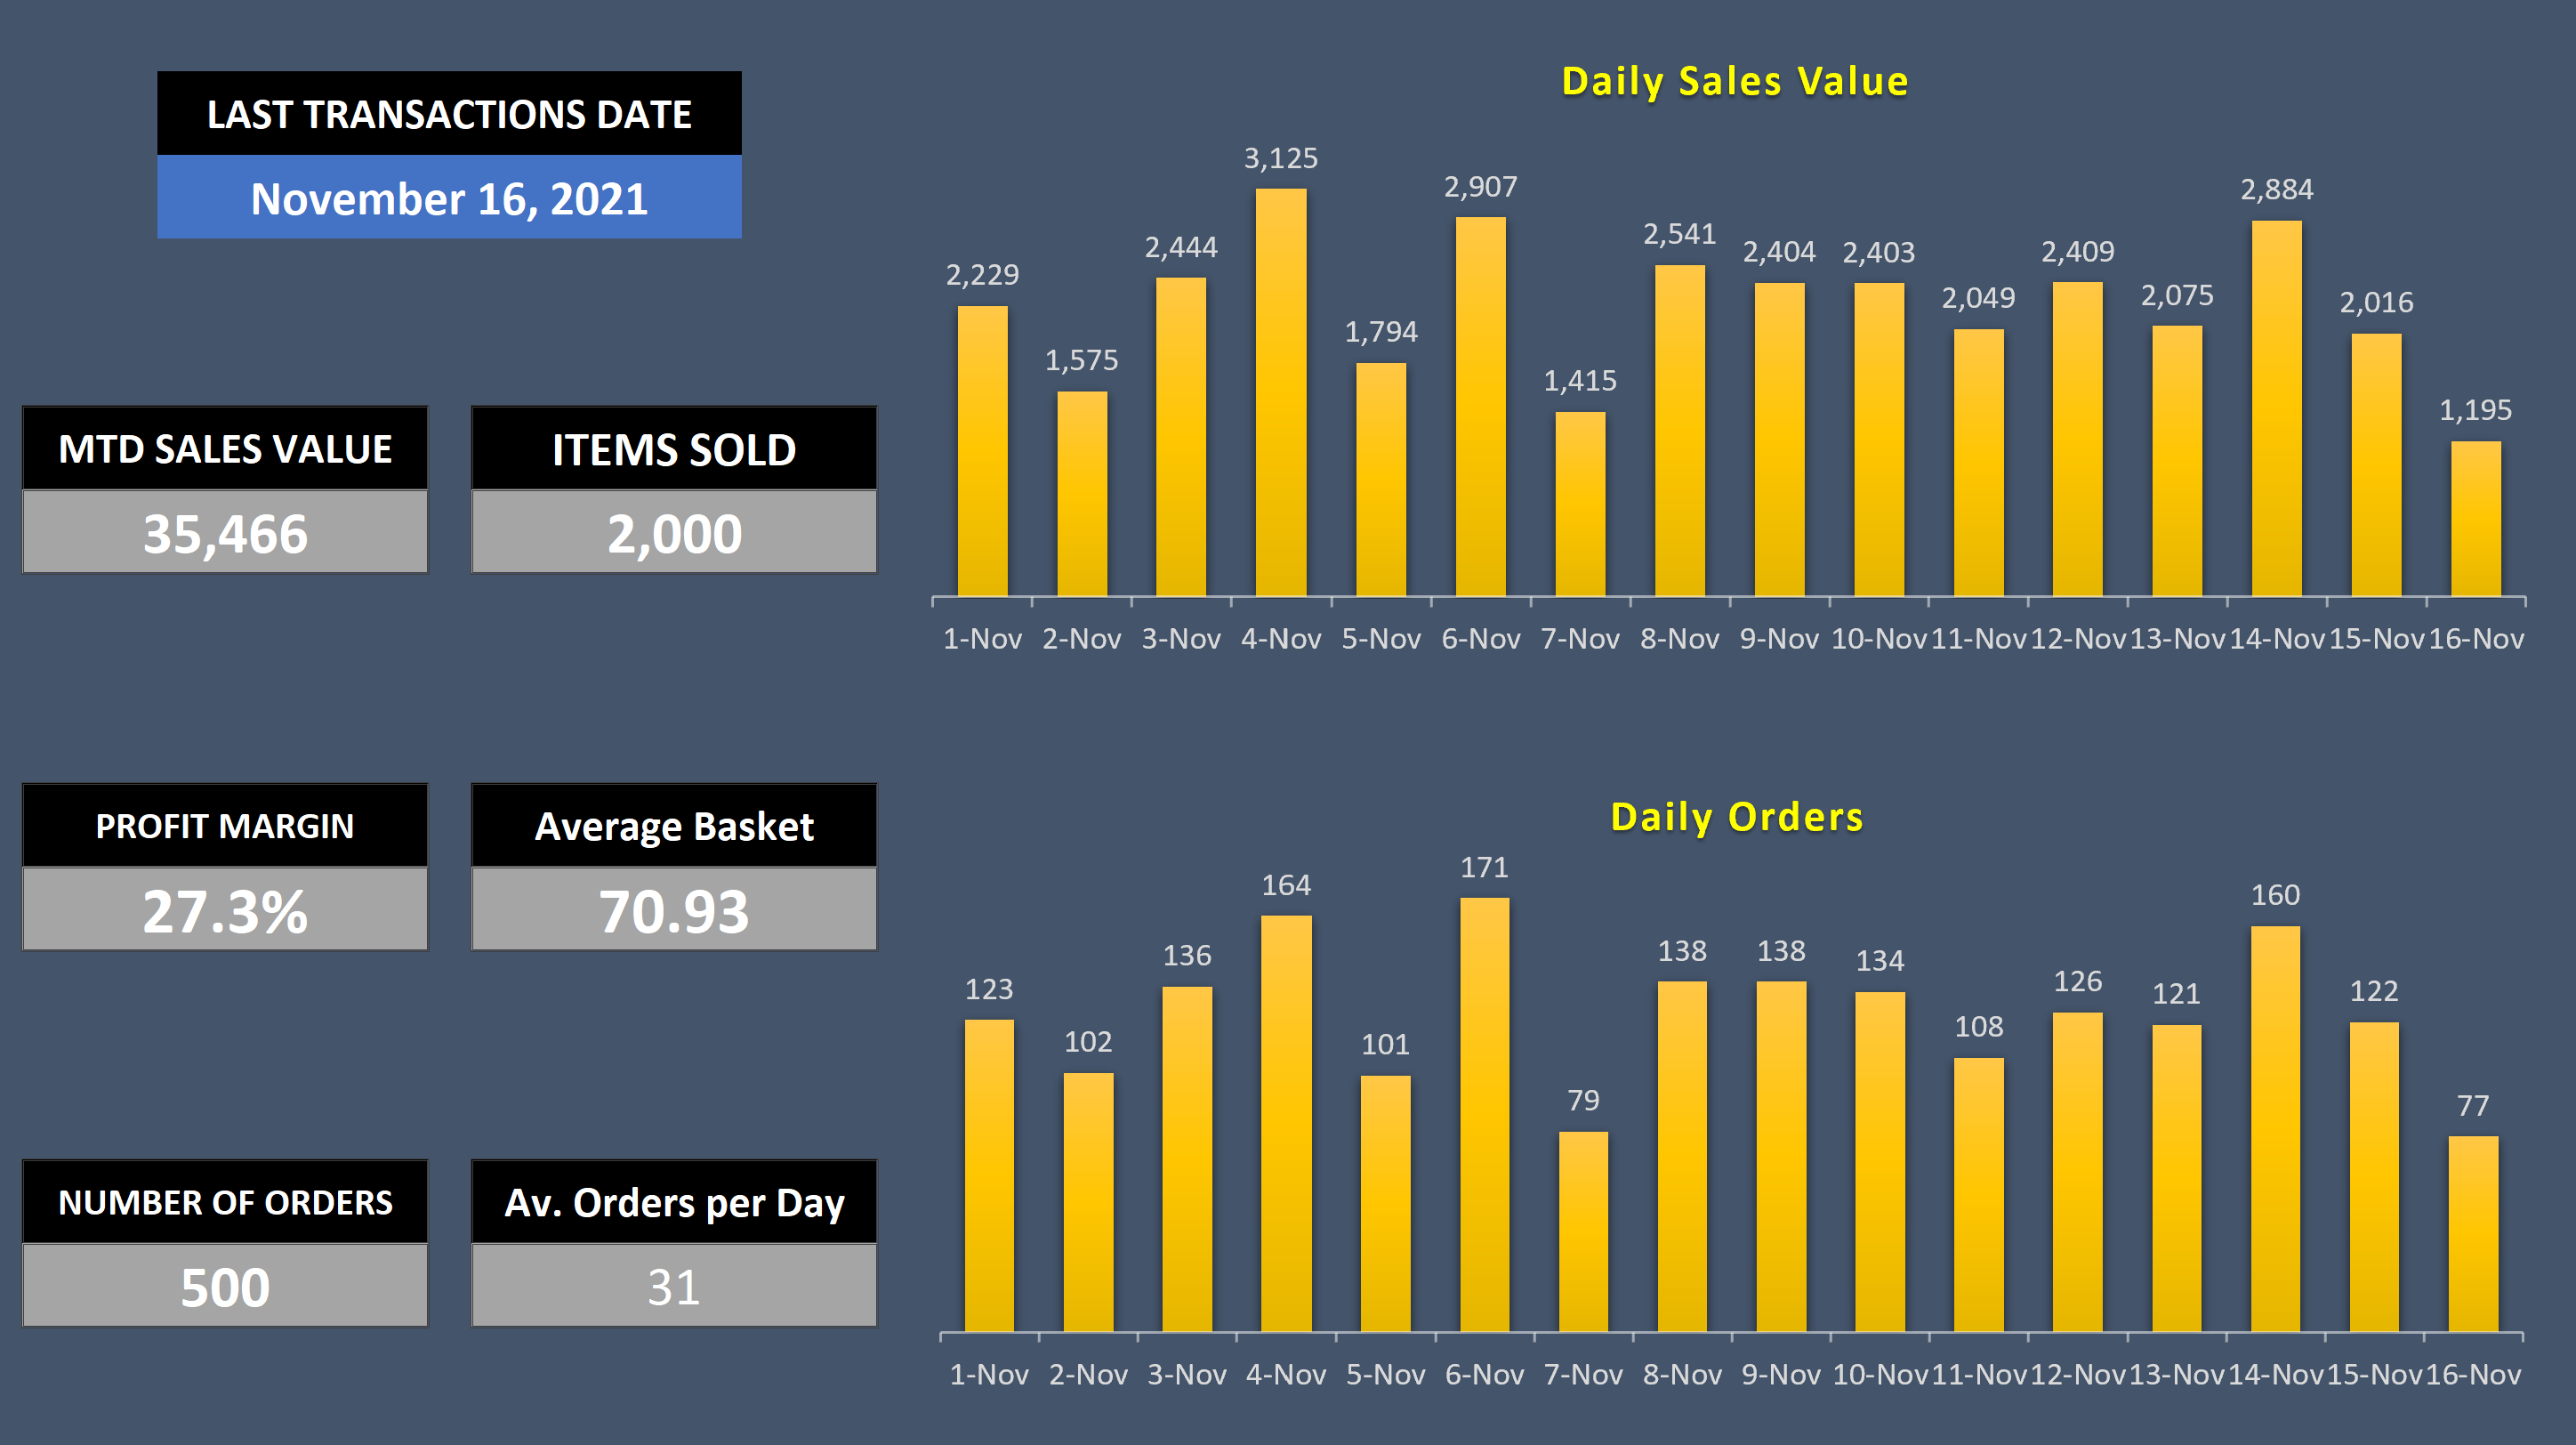
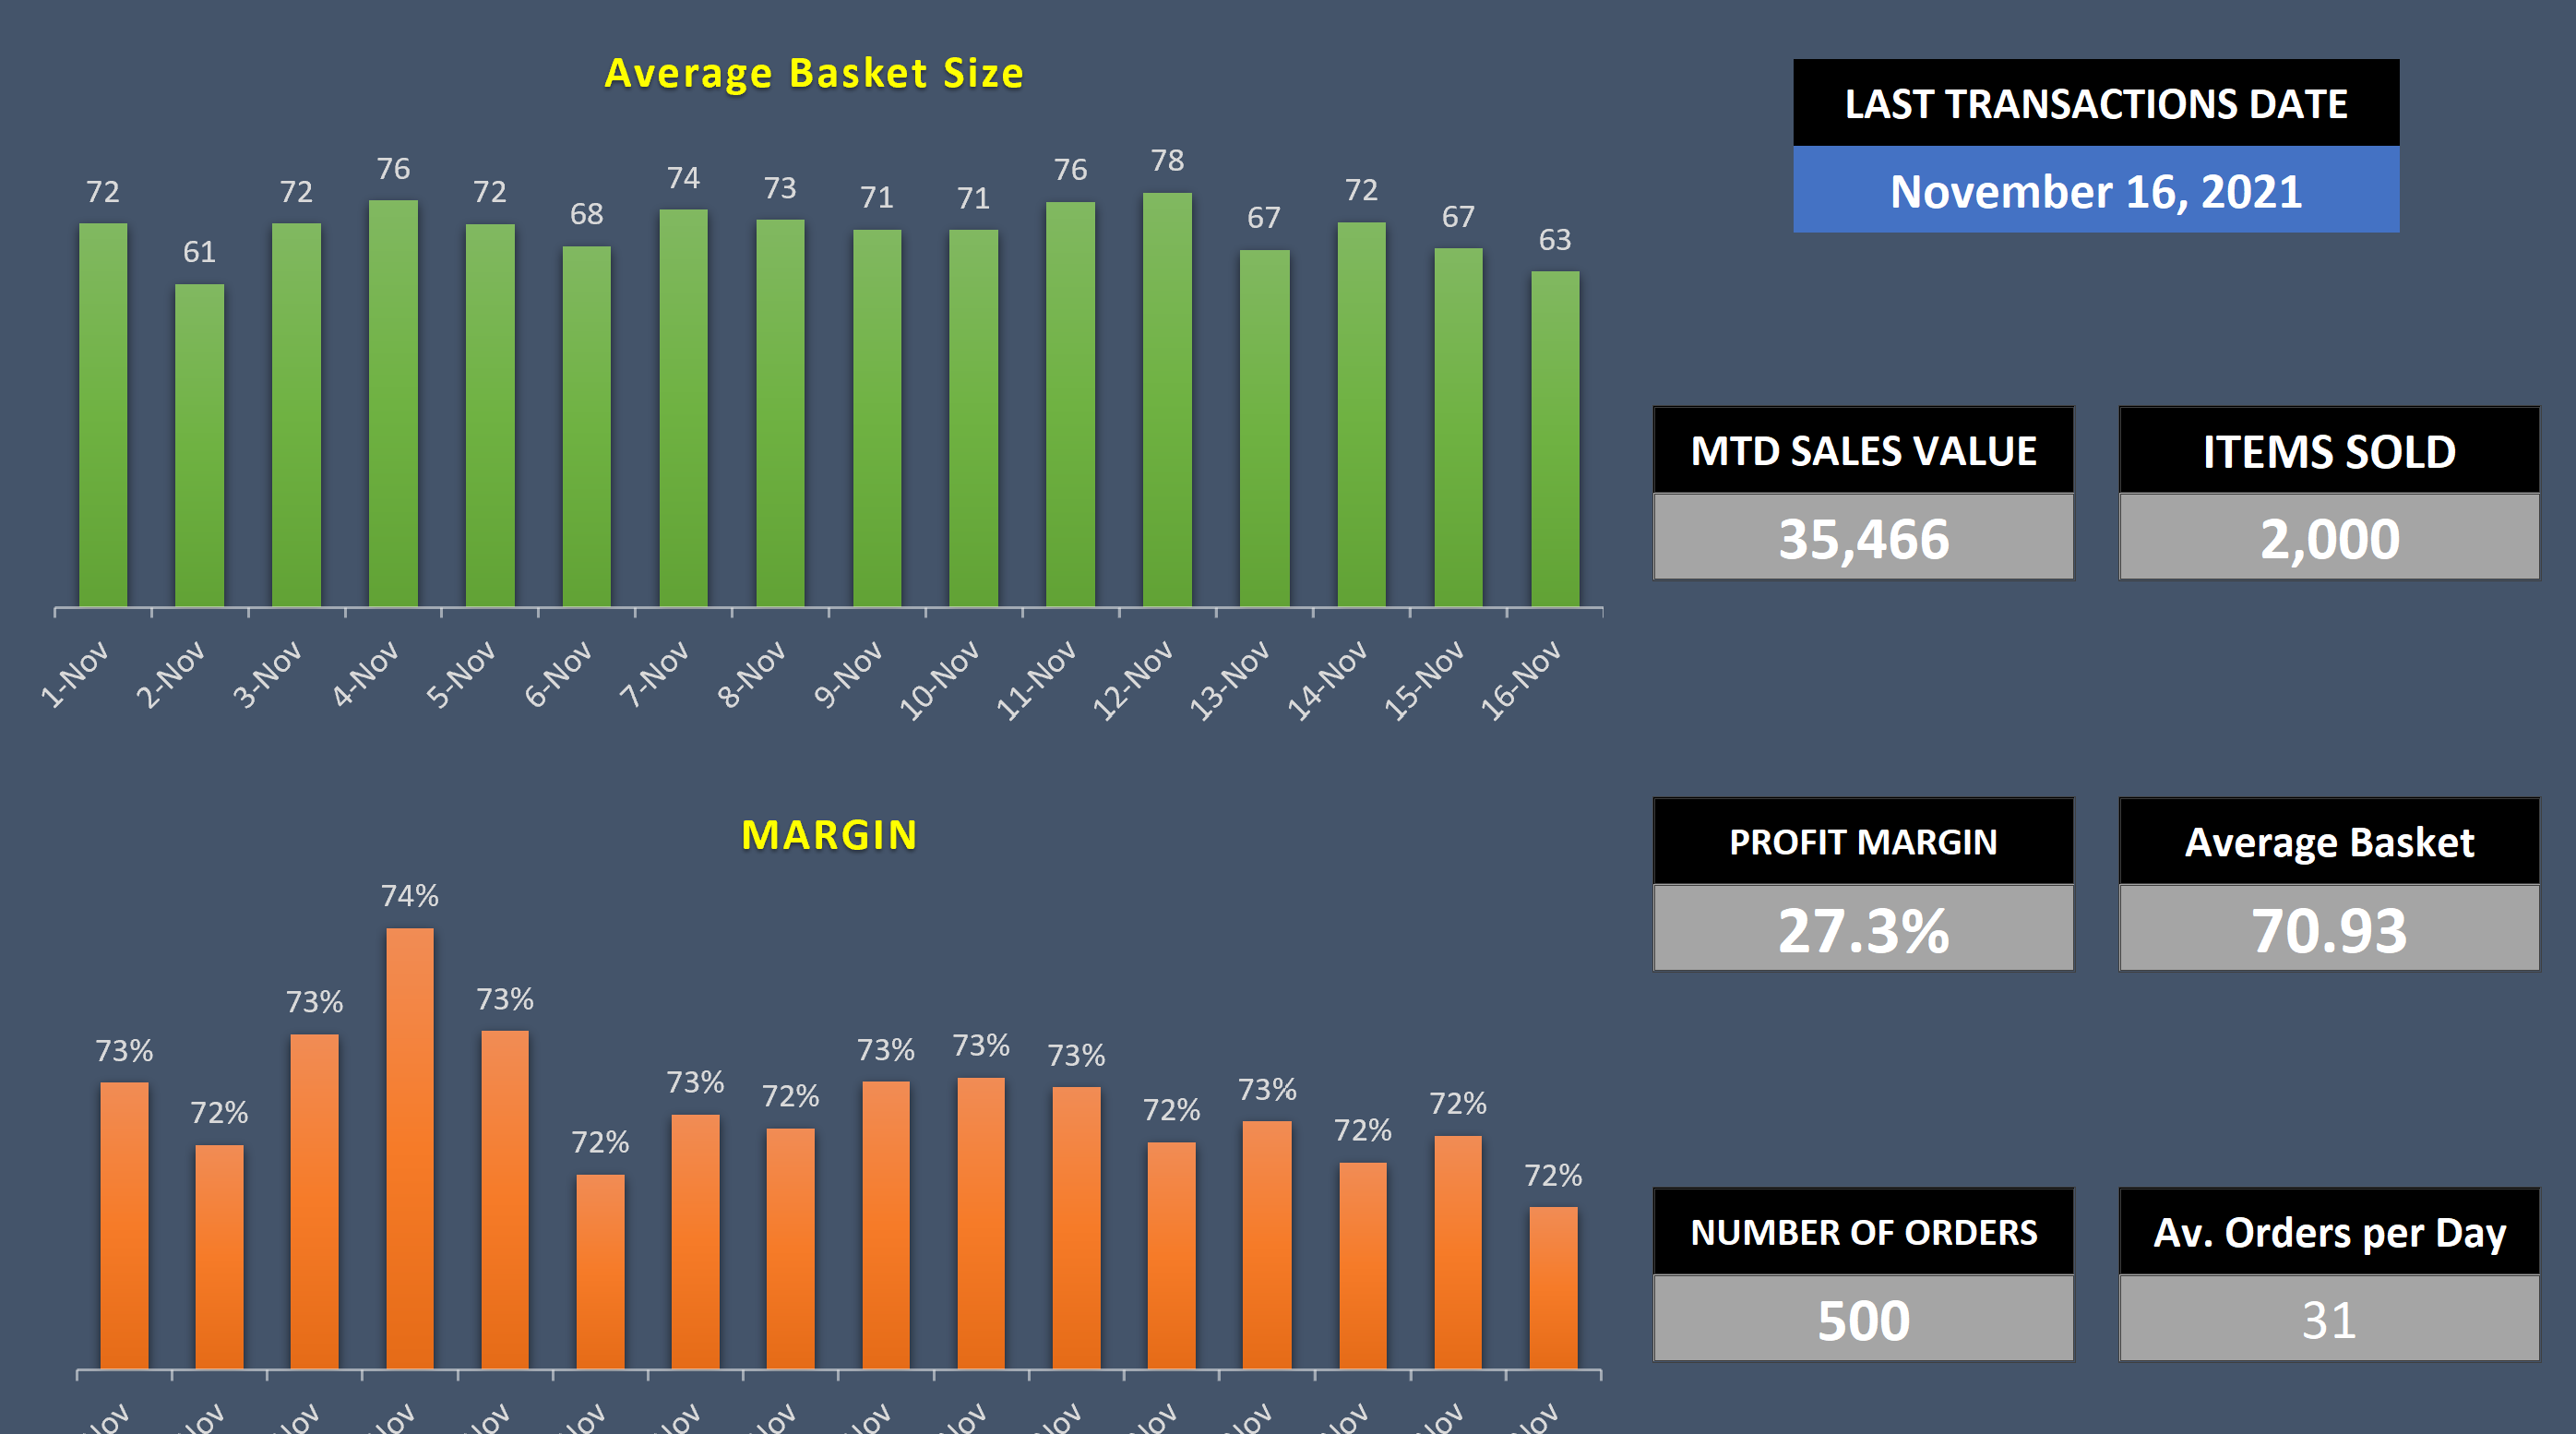
Calculations Sheet: The calculations sheet is responsible for analyzing the data from the sales data sheet. Lists of unique fields are generated, and data consolidated under those lists. The model is dynamic in the sense that it allows you to paste sales data without pre-defined categories, business lines etc. As this will automatically be generated in the summary lists. Data is also consolidated for days in the month to produce an analysis of sales, basket size, orders and margins on a daily basis for days of the current month. Chart data is also generated in this sheet which will feed into the dashboard sheet for visualizations.
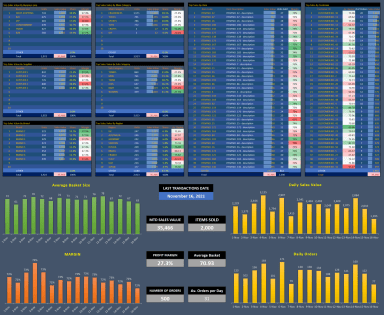
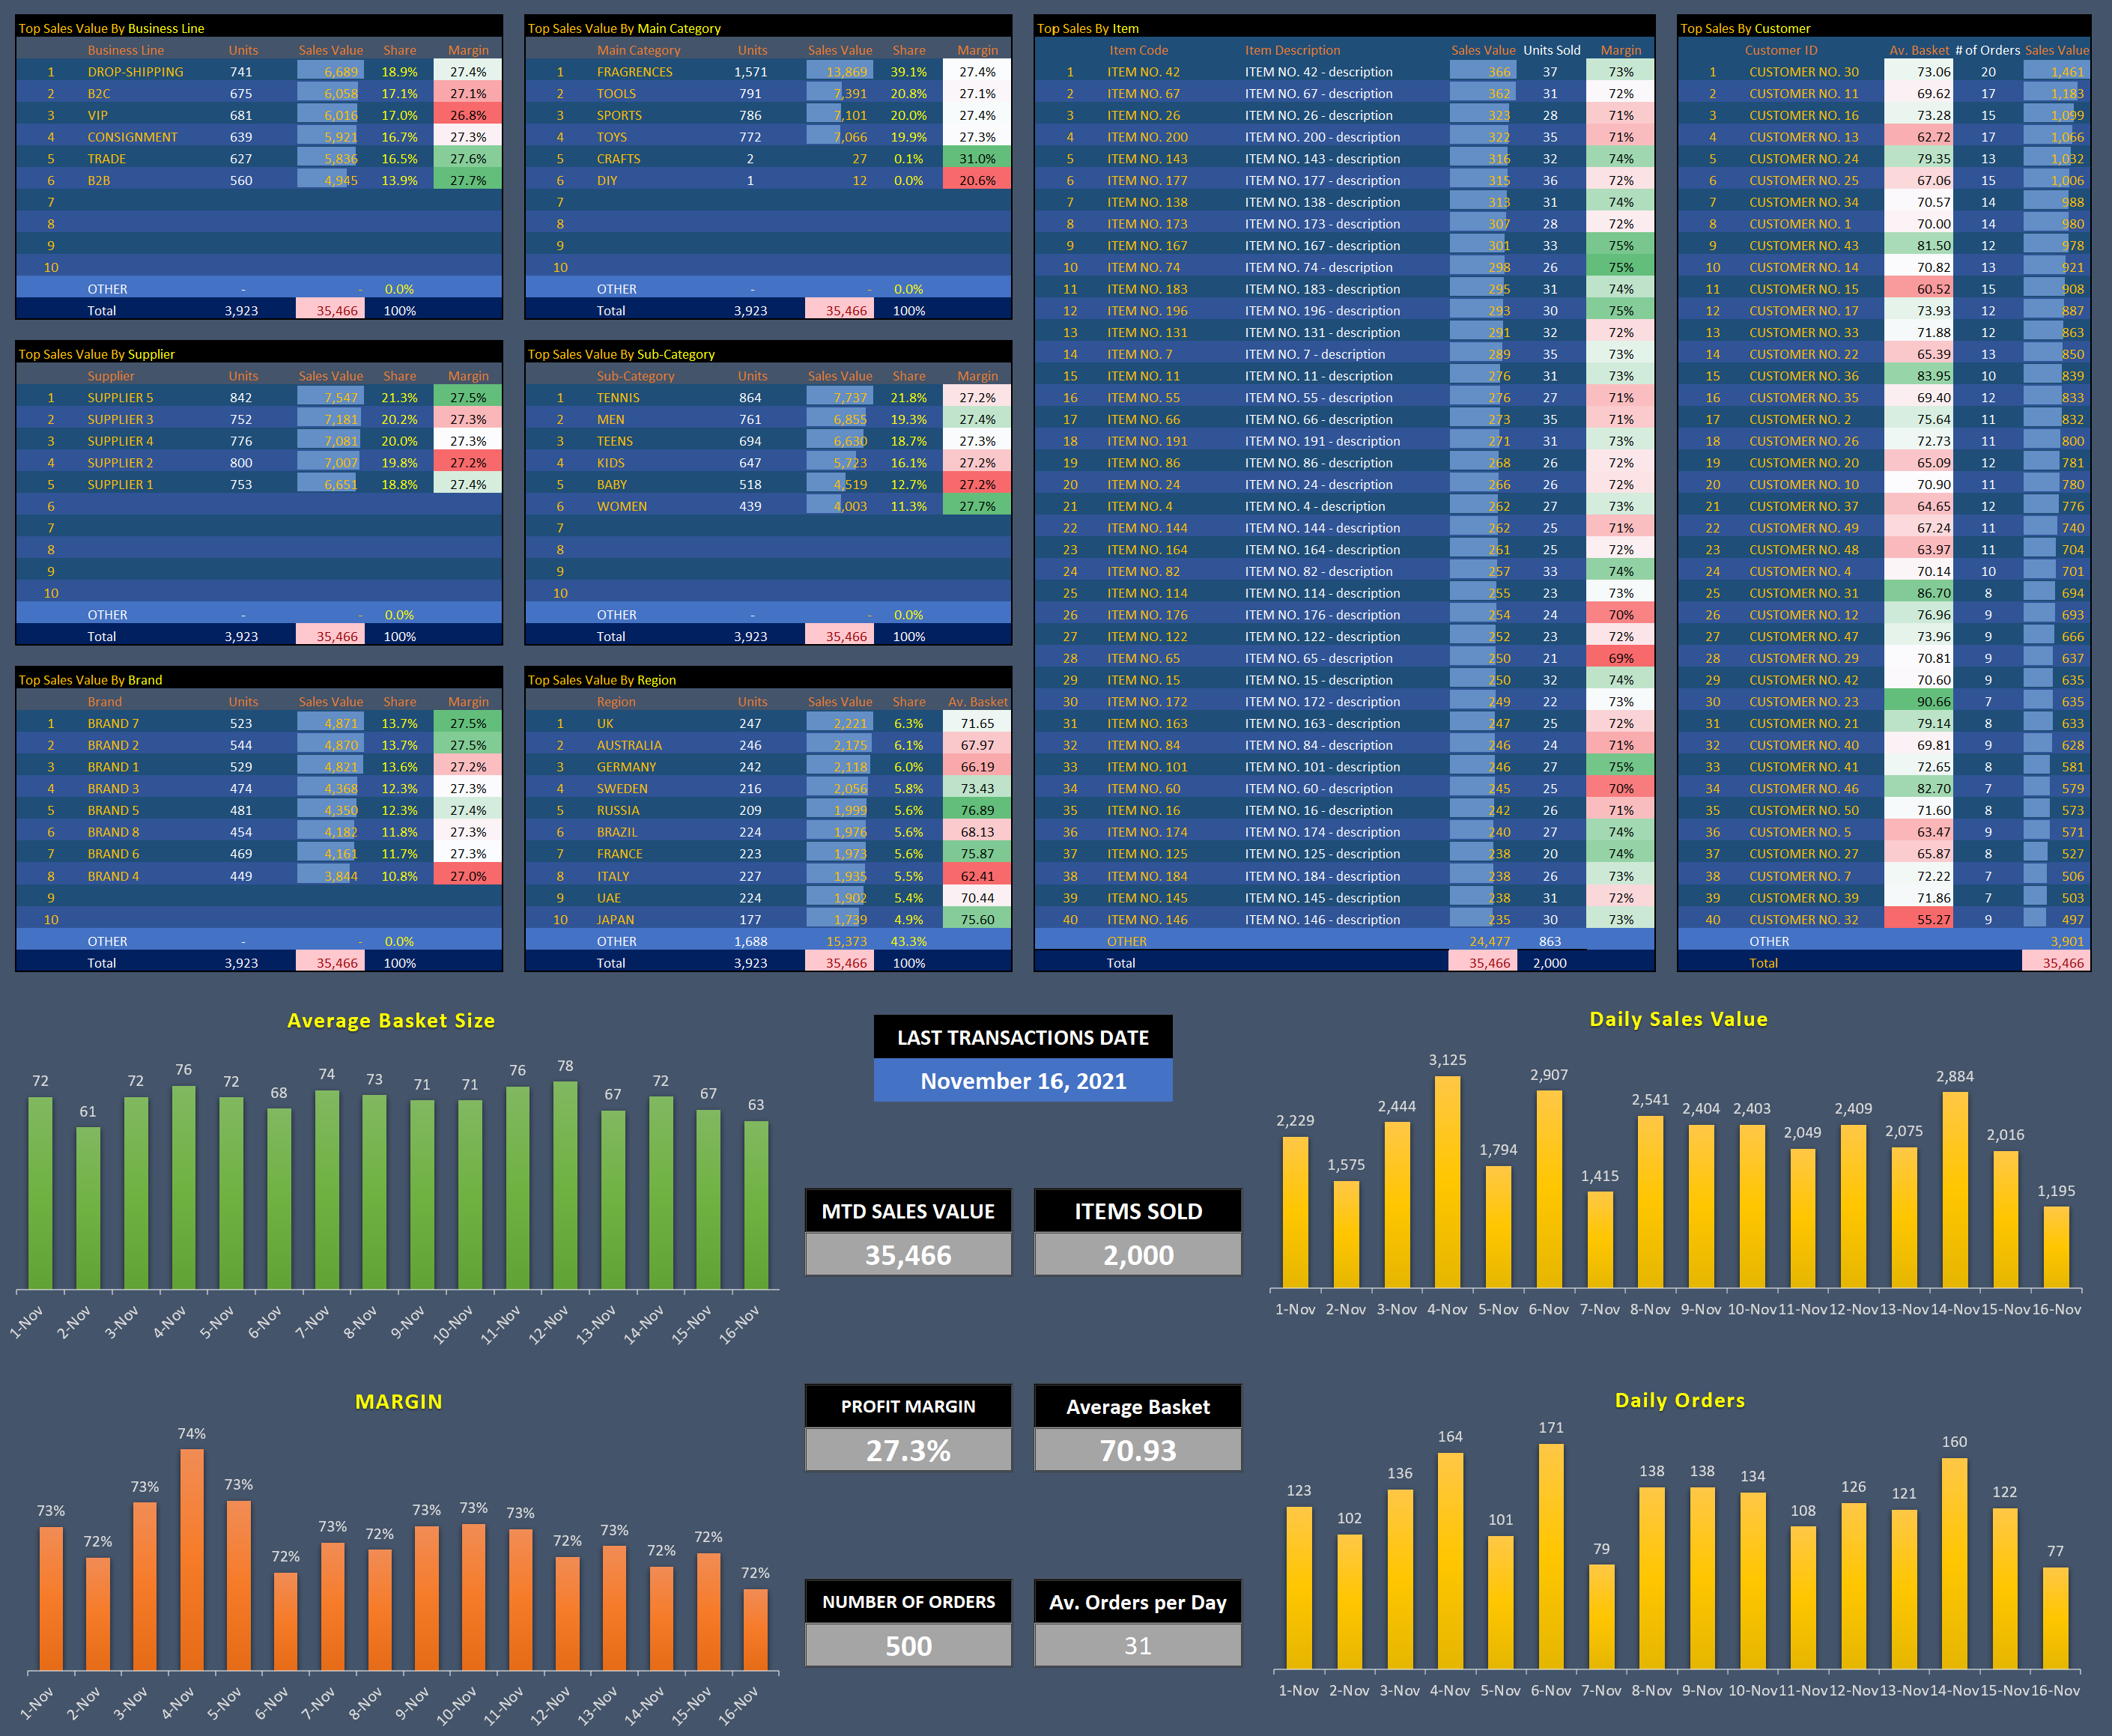
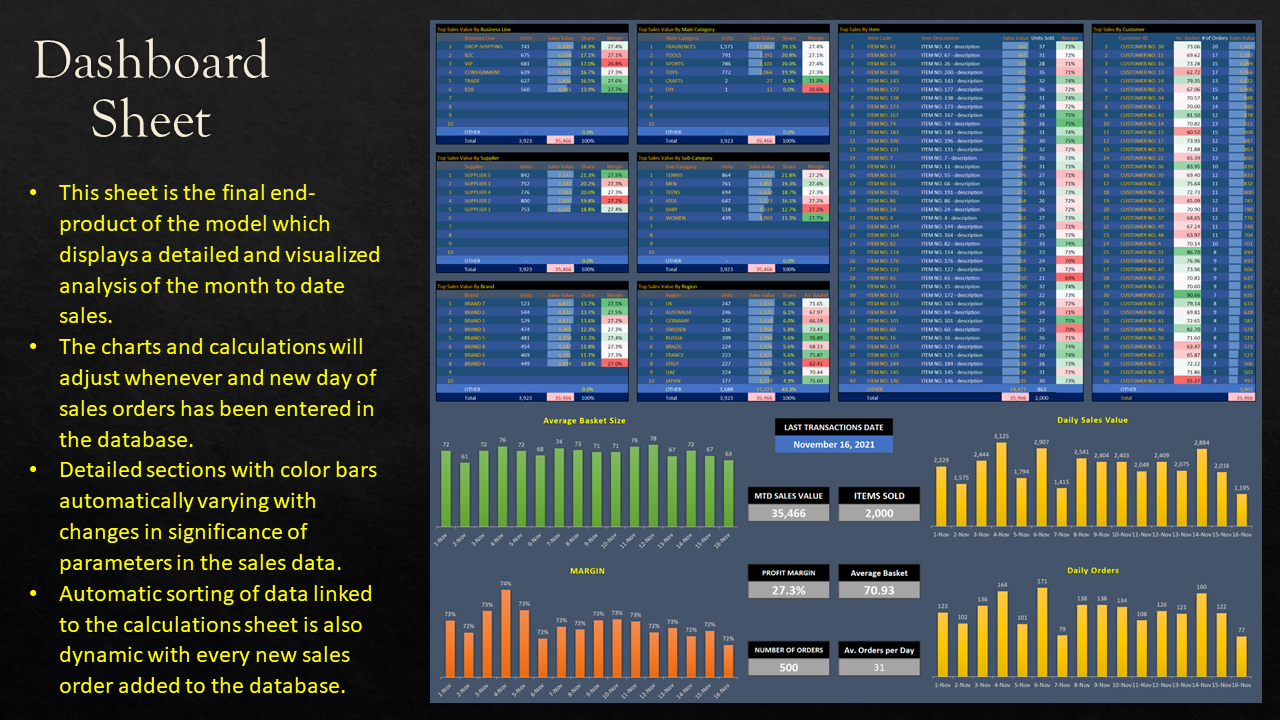
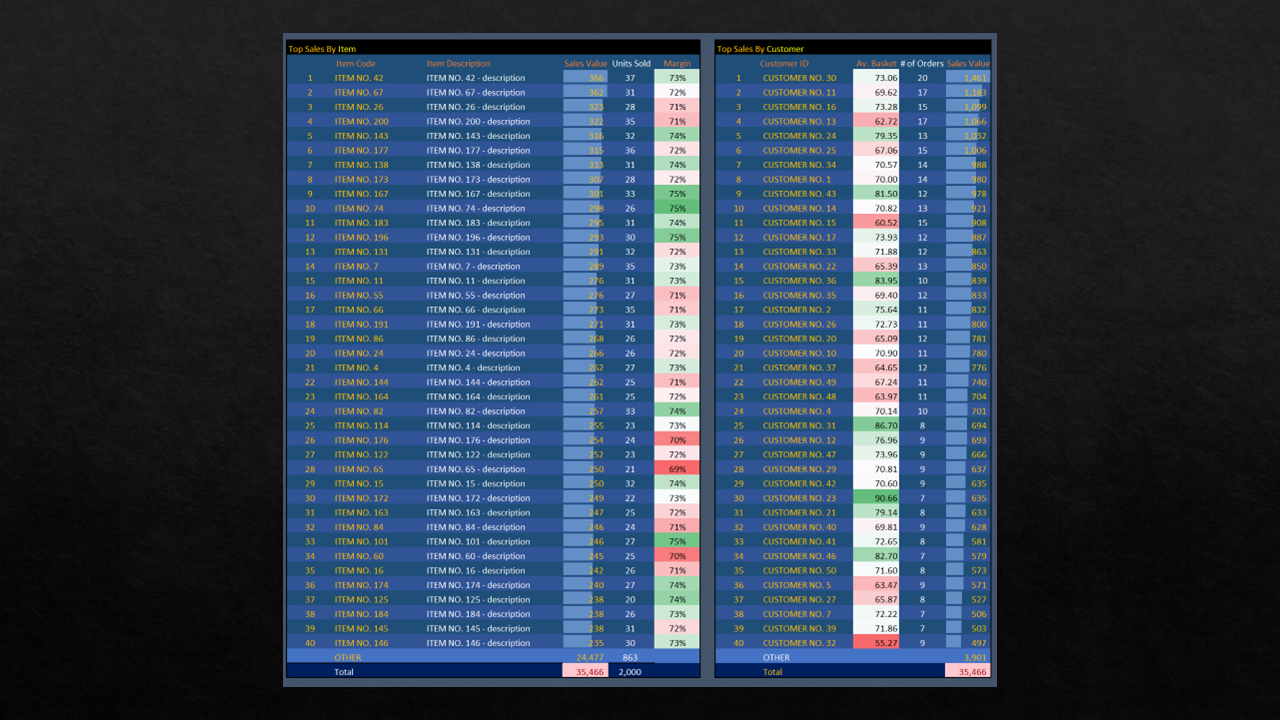
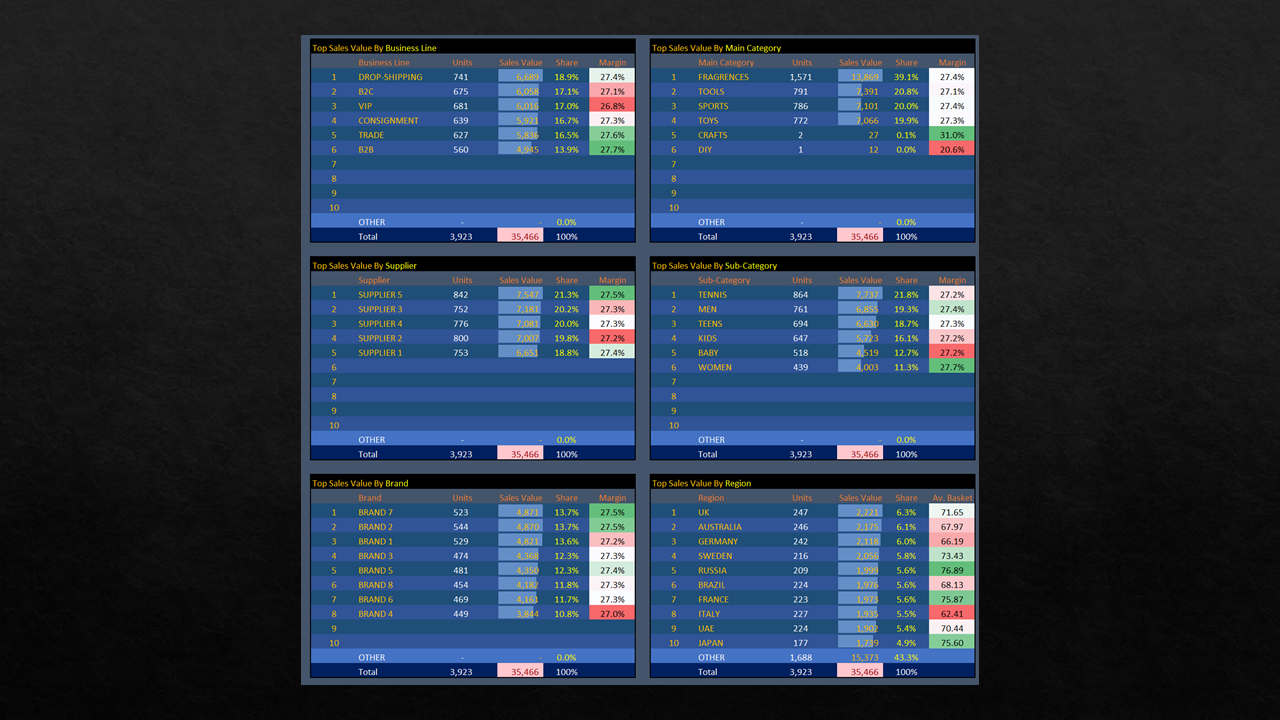
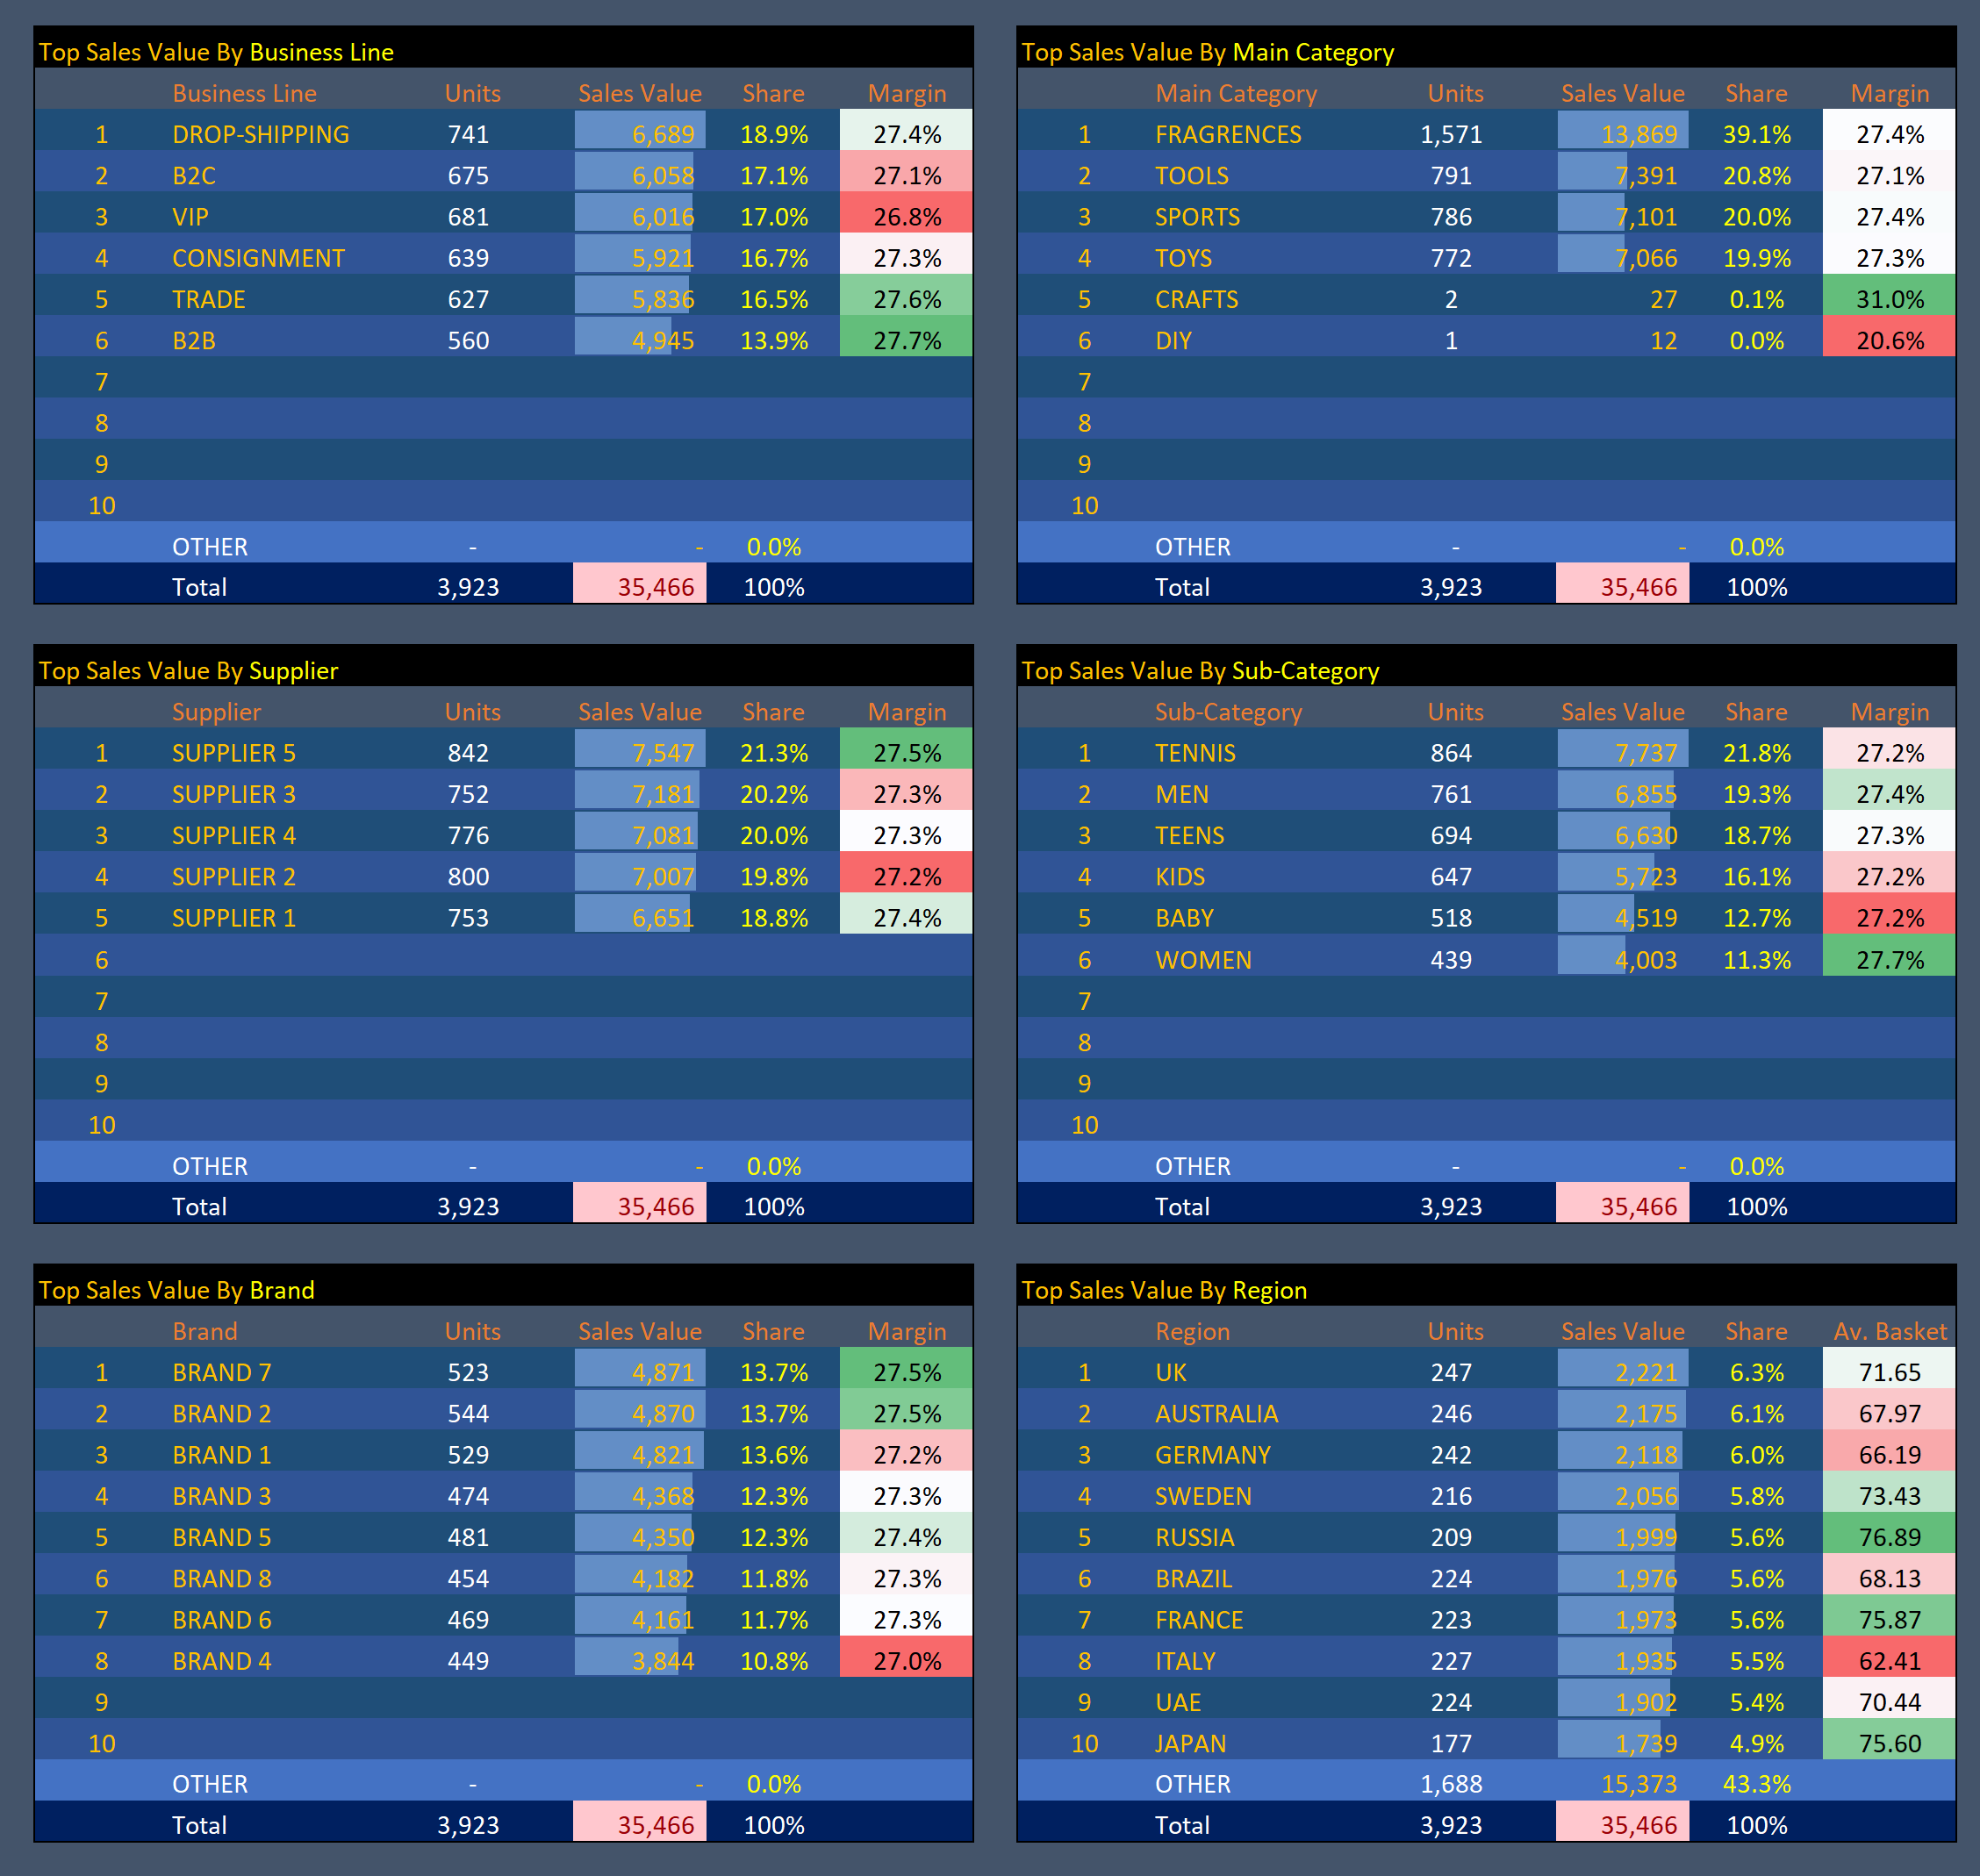
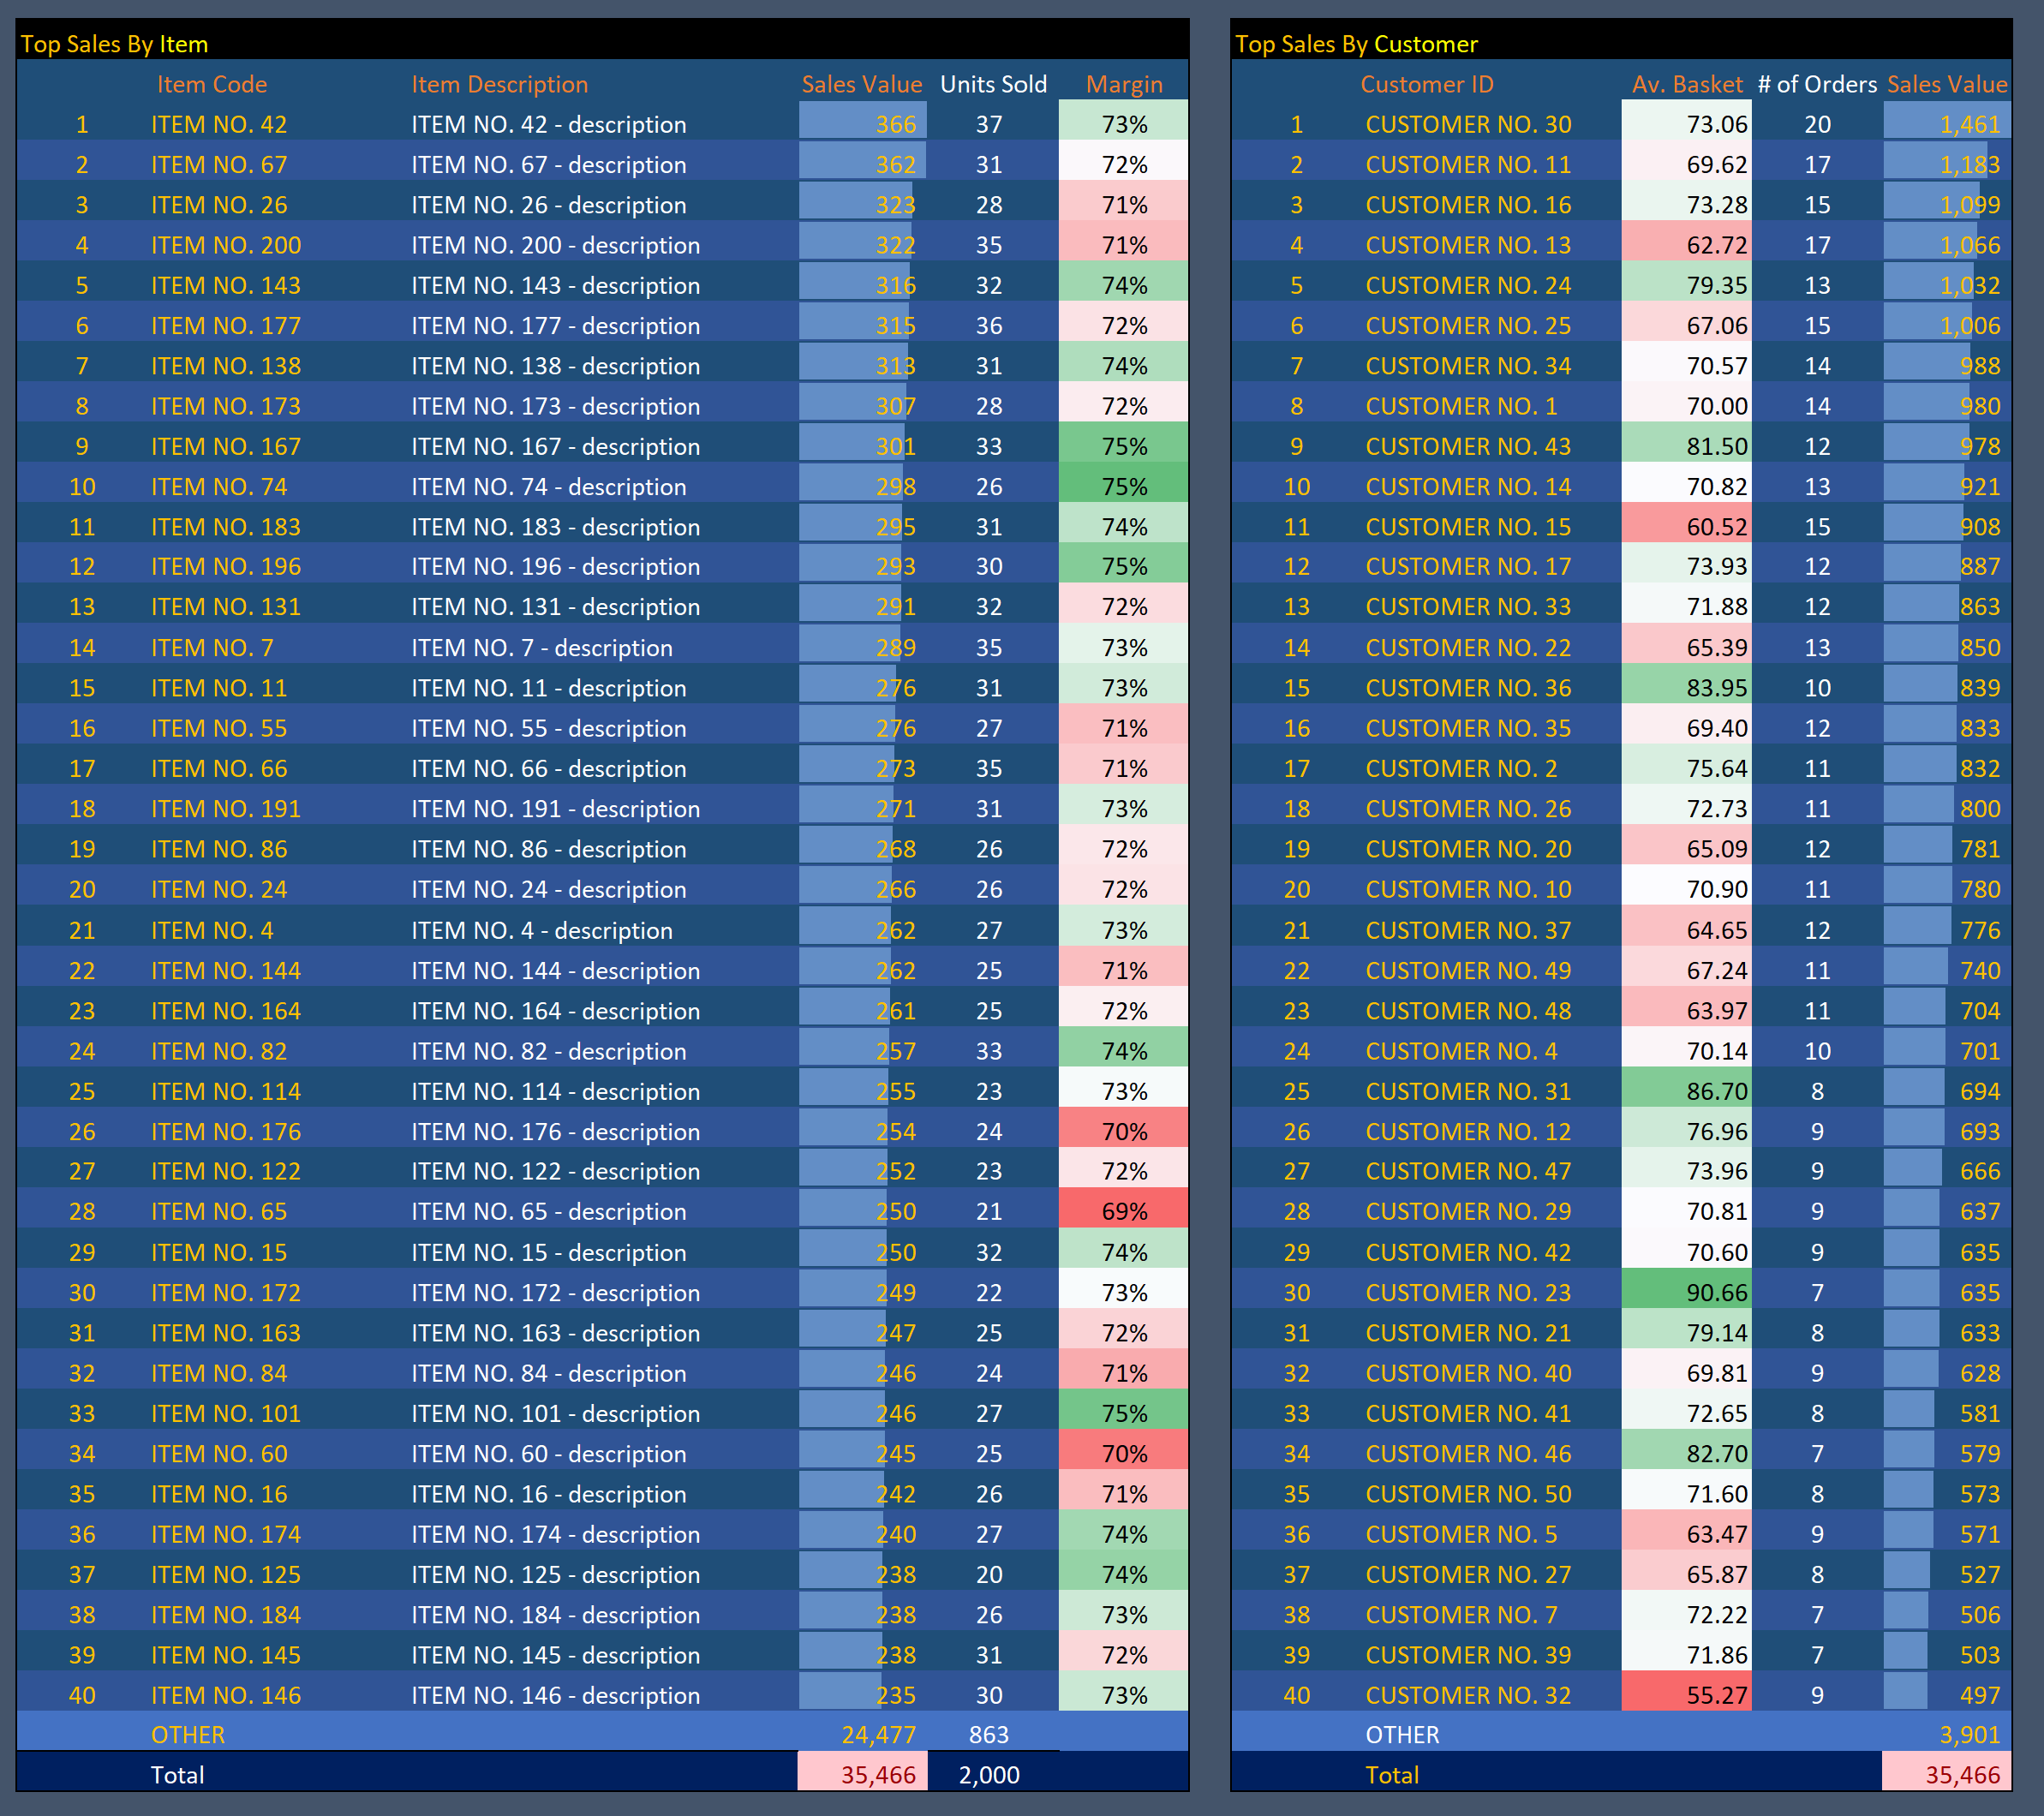
Dashboard Sheet: This sheet is the final end-product of the model which displays a detailed and visualized analysis of the month to date sales. The charts and calculations will adjust whenever and new day of sales orders has been entered in the database. Detailed sections with color bars automatically varying with changes in significance of parameters in the sales data. Automatic sorting of data linked to the calculations sheet is also dynamic with every new sales order added to the database.
The model comes with a set of sample sales data.
Even before the Covid period, businesses were becoming more and more serious about their e-commerce aspect of operations. Only those businesses that were robust and agile to shift their operations electronically, had managed to generate good returns during the lock-down months.
Despite the vast availability of software and developers to customize solutions for businesses that allow them to perform sales analytics, still it is sometimes useful to do it the old-fashioned way by downloading this data onto a spreadsheet and generate this analytics. At least till your organization has built a full-fledged ERP and linked it to live e-commerce sales while generating the necessary visualizations.
This model has a dynamic list creation for analysis tables. Which means that as you enter your sales data, the model will automatically generate your list of brands, categories, business lines, regions …etc. Such lists will then be built up in the analysis dashboard after a series of calculations are performed on such parameters in the calculations sheet.
The first step is to enter sales data in the form of an extract from your ERP. There are some columns in this data that could require computation on the sales data itself or can be generated directly from your data source. For example, the cost, selling price, units and profit for each unit sold.
The sales is gathered in the form of multiple rows per order, where each row is a unique item in the sales order. Each item in the sales order will have fields for this specific item, for example the brand, category, subcategory, item number, quantity, price, cost, supplier and brand. However there are items specific to an order like order number, region, customer number, business line etc.
Model Purpose: An affordable solution to perform month-to-date sales data analytics for e-commerce start-ups.
Model Specs:
Number of sales transactions rows: 20,000 formatted input rows of items sales, but can accommodate more depending in PC configuration.
Max number of transaction rows by item: 20,000
Max number of unique items: 5,000
Max number of unique orders: 2,000
Max number of unique suppliers: 500
Max number of unique brands: 500
Max number of unique business lines: 30
Max number of unique main categories: 10
Max number of unique sub-categories: 50
Max number of geographical regions: 50
Max number of unique customer IDs: 10,000
Model Components:
Sales Data Sheet: This is the database sheet in which sales transactions are pasted. In case not all columns are readily extractable from the company ERP, calculations could be performed. For example calculating he profit per unit, or total sales by multiplying units sold by unit price. Each sales order or invoice can be pasted on multiple lines where each line represents the item sold in that order. Some fields are specific to an item and other fields should be unified for an order. A set of sample data is given with the model.
Calculations Sheet: The calculations sheet is responsible for analyzing the data from the sales data sheet. Lists of unique fields are generated, and data consolidated under those lists. The model is dynamic in the sense that it allows you to paste sales data without pre-defined categories, business lines etc. As this will automatically be generated in the summary lists. Data is also consolidated for days in the month to produce an analysis of sales, basket size, orders and margins on a daily basis for days of the current month. Chart data is also generated in this sheet which will feed into the dashboard sheet for visualizations.
Dashboard Sheet: This sheet is the final end-product of the model which displays a detailed and visualized analysis of the month to date sales. The charts and calculations will adjust whenever and new day of sales orders has been entered in the database. Detailed sections with color bars automatically varying with changes in significance of parameters in the sales data. Automatic sorting of data linked to the calculations sheet is also dynamic with every new sales order added to the database.
The model comes with a set of sample sales data.
This Best Practice includes
1 pdf file, 1 excel file
Further information
An affordable solution to perform month-to-date sales data analytics for e-commerce start-ups.
this model requires users to be running office 365 with latest updates
