Originally published: 07/07/2023 08:53
Last version published: 24/02/2026 17:08
Publication number: ELQ-19945-4
View all versions & Certificate
Last version published: 24/02/2026 17:08
Publication number: ELQ-19945-4
View all versions & Certificate

Excel Project Management Dashboard 2
An Excel Project Management Dashboard template is a powerful tool that helps project managers effectively track, analyze, and visualize key project metrics.
Our online platform provides a wide range of engaging and useful templates that cater to various needs.Follow 85
Description
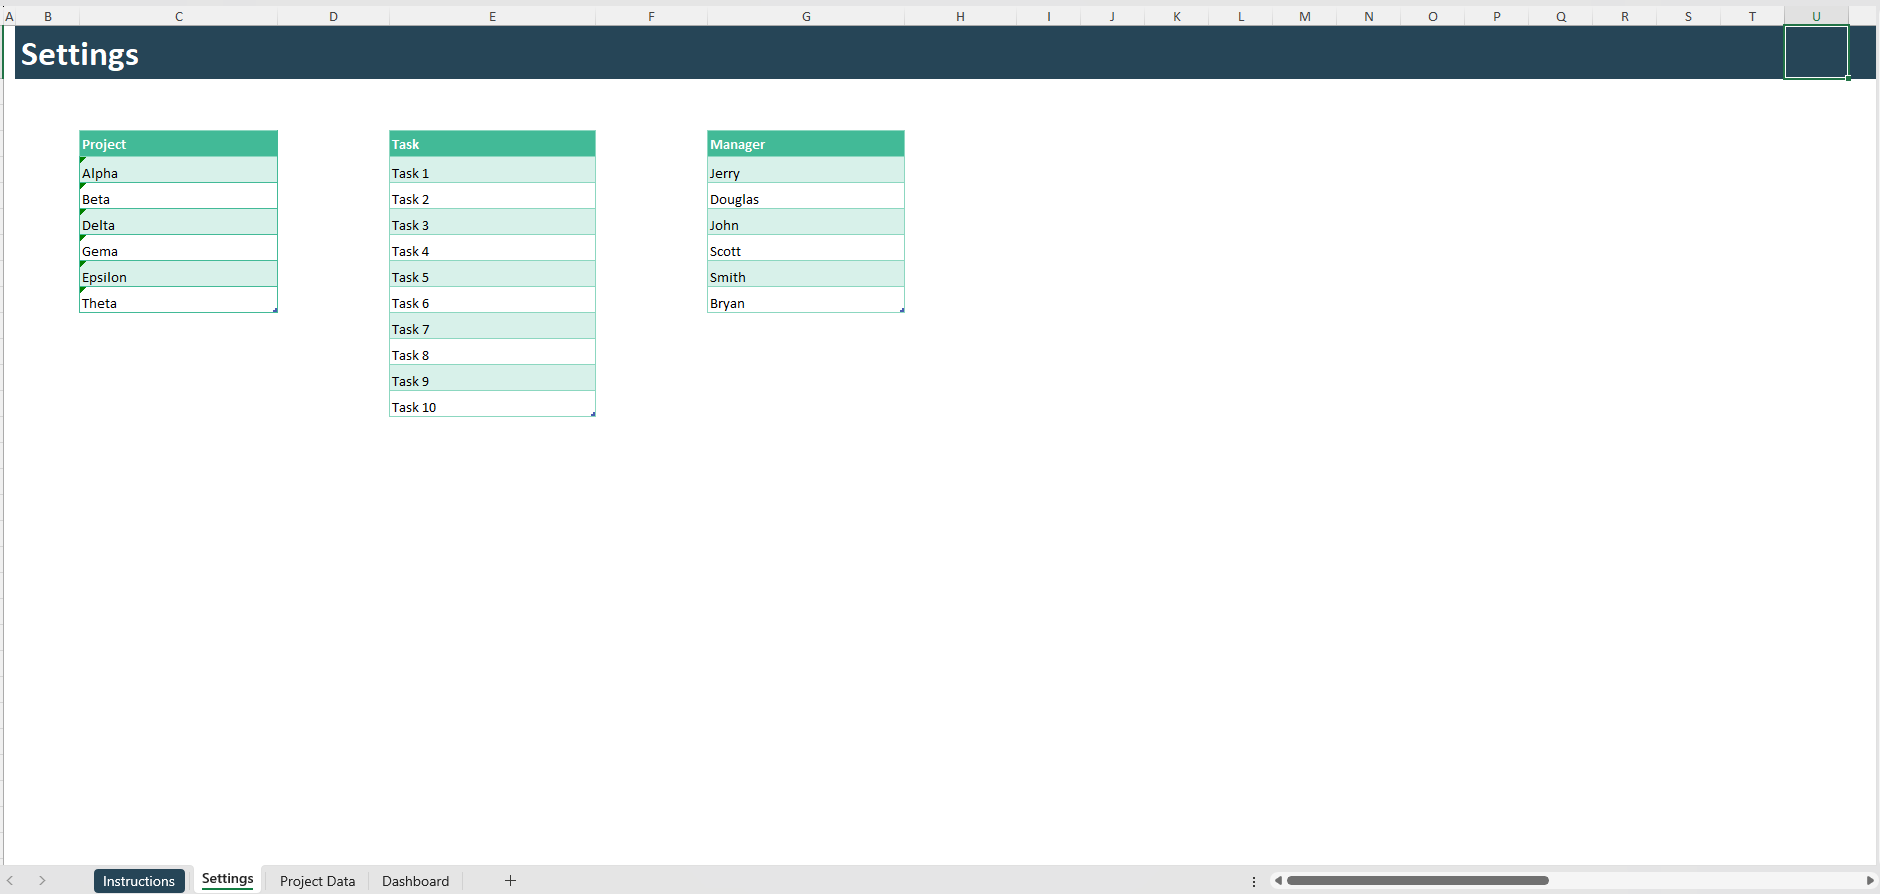
⚙️ Settings Sheet
The Settings sheet is the configuration area of the template. It allows you to customize the structure before entering any project data.
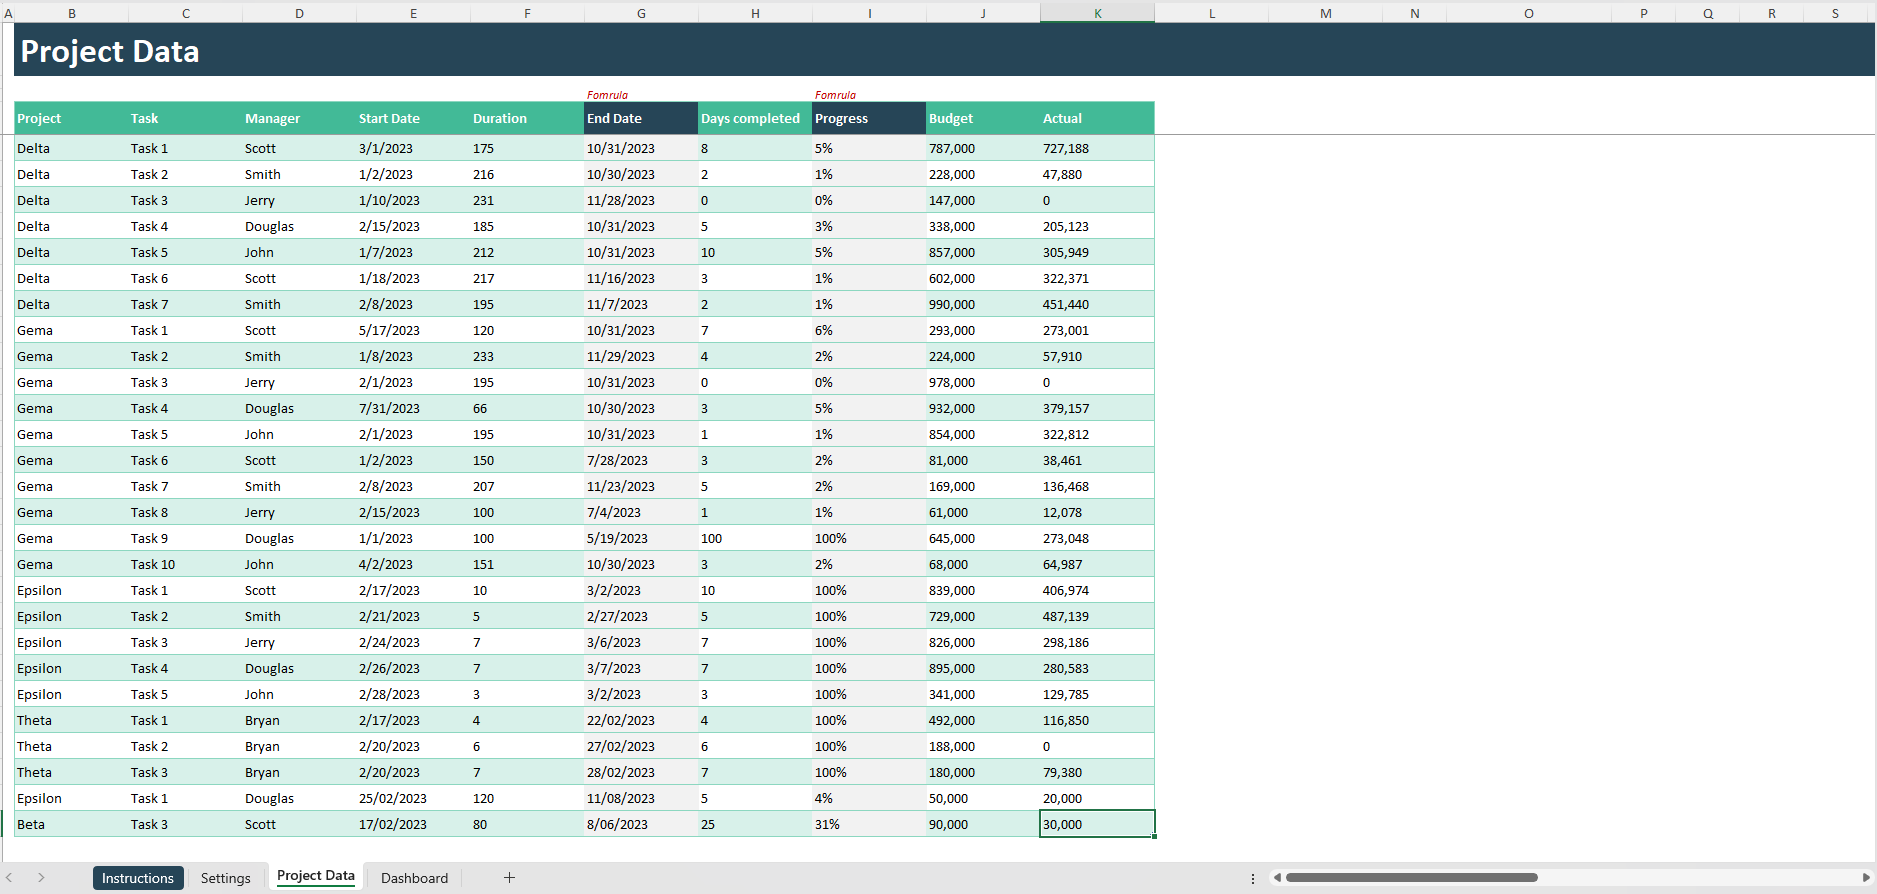
📋 Project Data Sheet
The Project Data sheet is the main input area of the template. Every row represents a single task and feeds the Dashboard and Gantt Chart automatically.
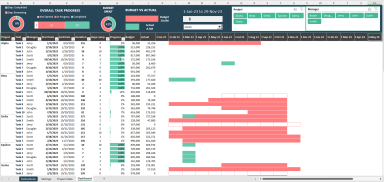
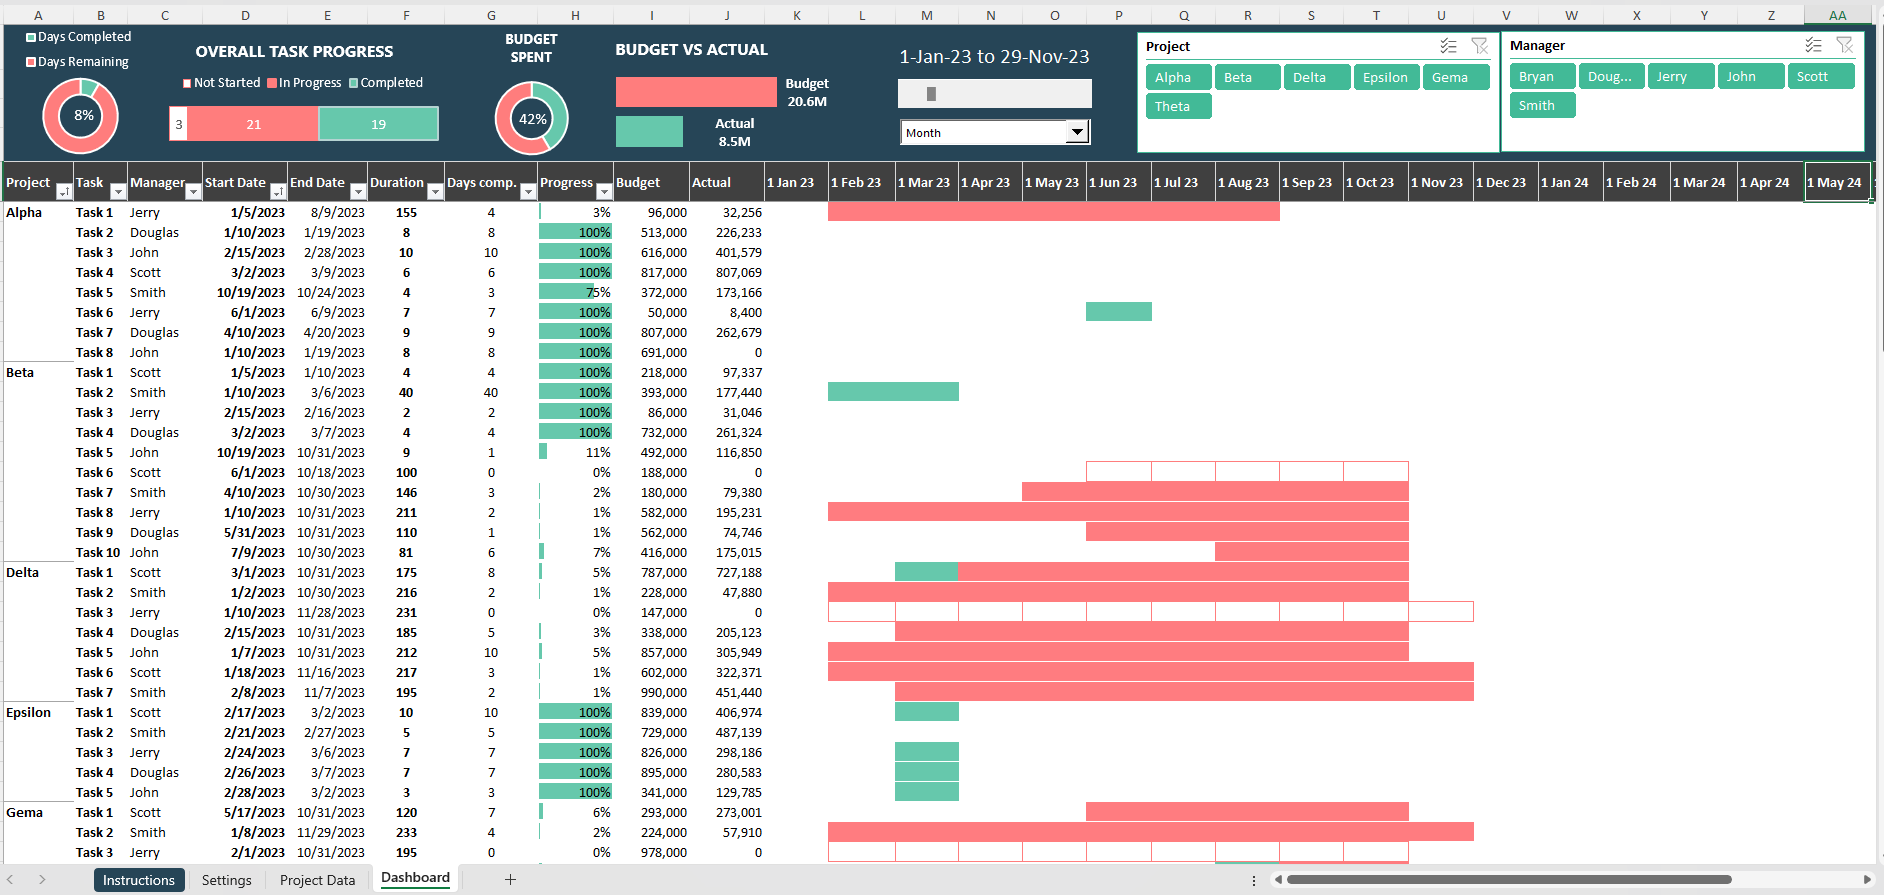
📈 Dashboard Sheet
The Dashboard sheet provides a high-level visual summary of your projects. It is fully automated and does not require manual data entry.
📅 Gantt Chart
The Gantt Chart provides a timeline view of all tasks across projects. It visually represents scheduling and progress.
🔄 Recommended WorkflowTo use the template effectively:
⚙️ Settings Sheet
The Settings sheet is the configuration area of the template. It allows you to customize the structure before entering any project data.
- This sheet contains predefined lists for Projects, Tasks, and Managers.
- These lists are connected to dropdown menus in the Project Data sheet.
- Updating these lists ensures consistent data entry and prevents spelling errors.
- You can add new projects, tasks, or managers at the bottom of each list.
- Do not leave blank rows within the lists, as this may affect dropdown functionality.
- Avoid renaming the sheet or deleting headers to maintain proper formula connections.
📋 Project Data Sheet
The Project Data sheet is the main input area of the template. Every row represents a single task and feeds the Dashboard and Gantt Chart automatically.
- Select the Project name from the dropdown menu.
- Select the Task name from the dropdown menu.
- Choose the responsible Manager.
- Enter the Start Date of the task.
- Enter the Duration in days.
- The End Date is calculated automatically (if formulas are enabled).
- Enter the number of Days Completed to track progress.
- The Progress percentage is calculated automatically based on completed days divided by total duration.
- Enter the planned Budget for the task.
- Enter the Actual cost spent so far.
- Do not delete or modify formula cells.
- Do not change the table headers.
- Always use valid date formats.
- Update progress and actual costs regularly to keep reports accurate.
📈 Dashboard Sheet
The Dashboard sheet provides a high-level visual summary of your projects. It is fully automated and does not require manual data entry.
- Displays overall project performance metrics.
- Shows task completion percentages.
- Compares Budget vs Actual spending.
- Highlights manager performance.
- Provides visual charts and KPI indicators for quick insights.
- Updates automatically when changes are made in the Project Data sheet.
📅 Gantt Chart
The Gantt Chart provides a timeline view of all tasks across projects. It visually represents scheduling and progress.
- Displays tasks across a calendar timeline.
- Shows task start and end dates visually.
- Highlights planned task duration.
- Indicates completed portion of each task.
- Helps identify delays or overlapping tasks.
- Updates automatically based on Project Data entries.
🔄 Recommended WorkflowTo use the template effectively:
- First, customize project names, tasks, and managers in the Settings sheet.
- Second, enter all task details in the Project Data sheet.
- Third, review insights in the Dashboard sheet.
- Finally, monitor timelines in the Gantt Chart sheet.
This Best Practice includes
Excel File
