


Originally published: 28/06/2023 15:09
Publication number: ELQ-93849-1
View all versions & Certificate
Publication number: ELQ-93849-1
View all versions & Certificate

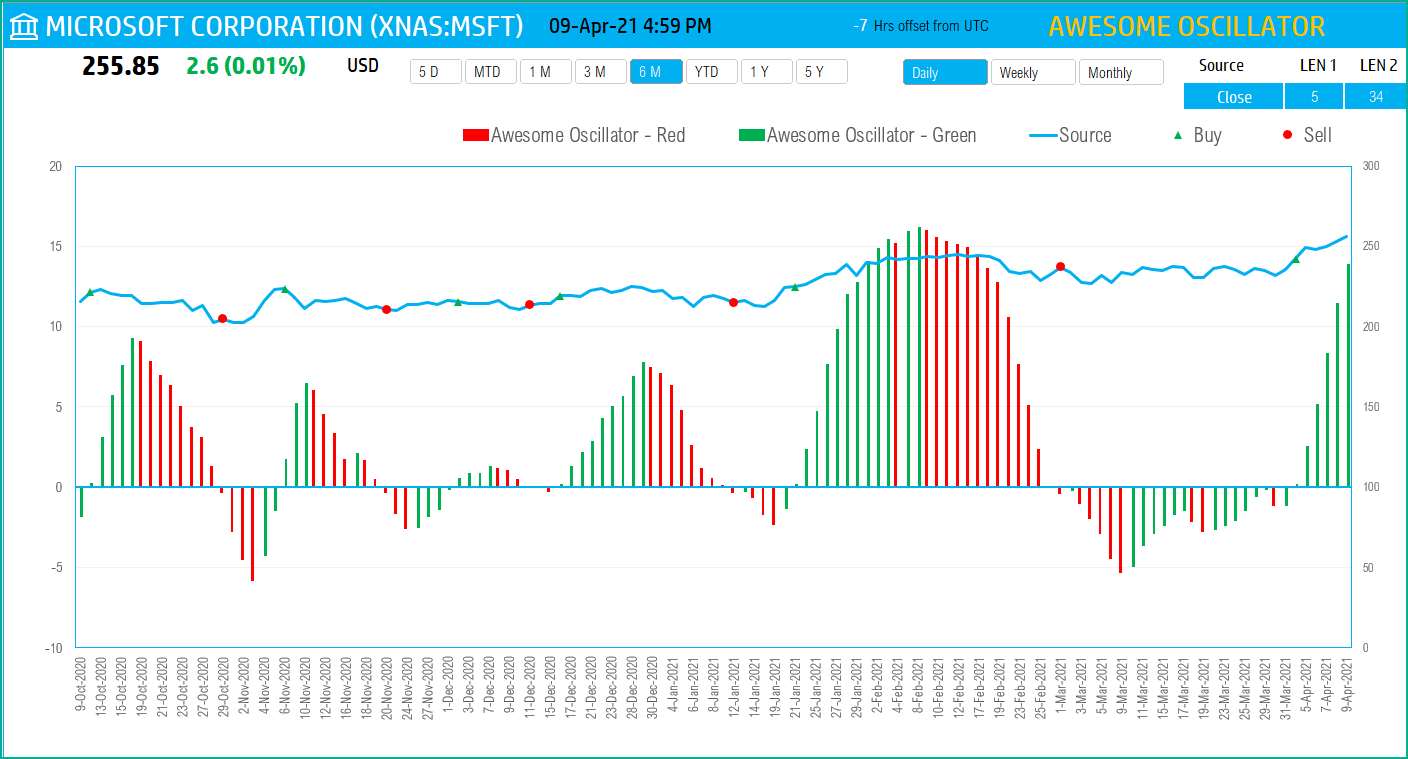
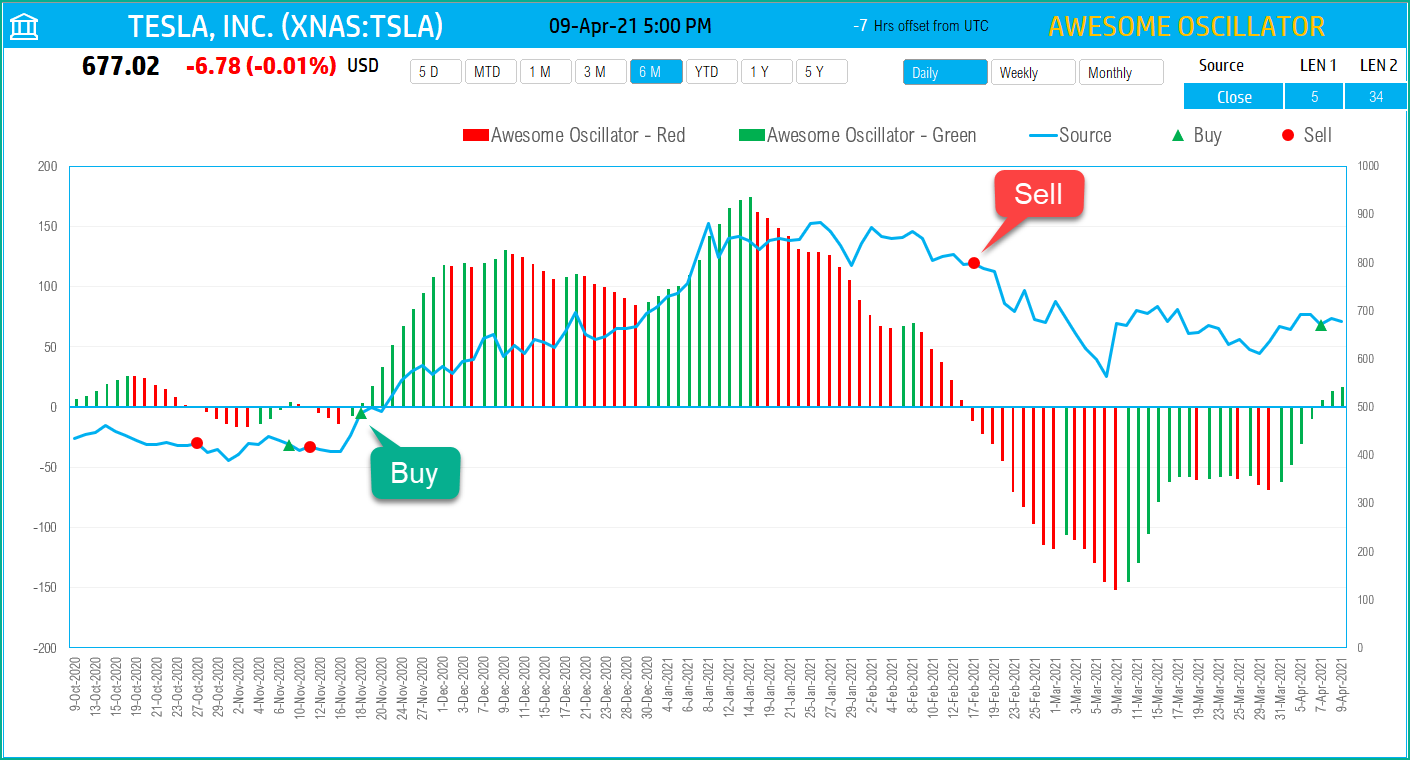
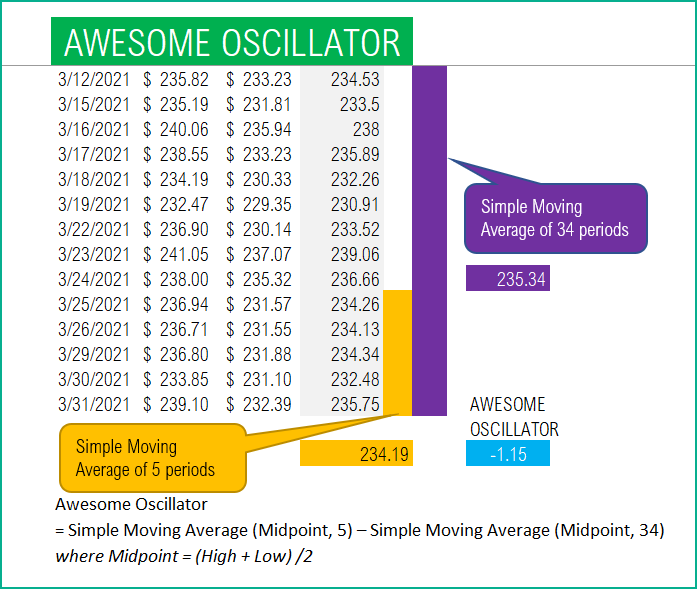
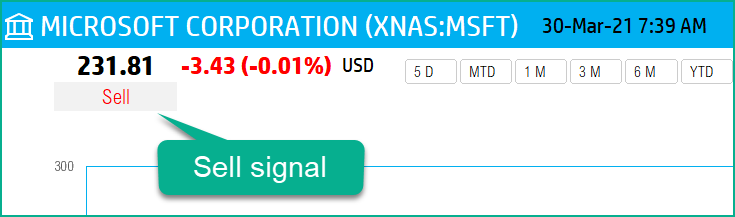
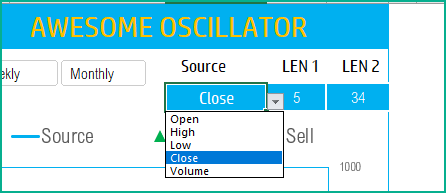
Awesome Oscillator Indicator – Technical Analysis - Stock Market Excel Template
This amazing free Microsoft Excel template uses the Awesome Oscillator technical indicator to analyze stock performance.
