Originally published: 31/08/2025 20:33
Publication number: ELQ-43485-1
View all versions & Certificate
Publication number: ELQ-43485-1
View all versions & Certificate

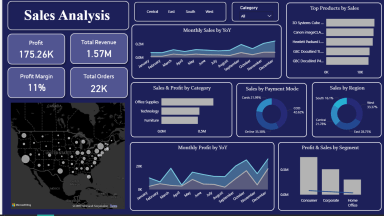
Sales Analysis Power BI Dashboard with KPI Tracking & Insights
A modern Power BI dashboard for sales performance tracking, featuring key KPIs, regional insights, top products, and profit analysis.
Data Analyst | Excel, Power BI, Python, SQL Expert | Turning Data into Decisions | Business AnalystFollow
Further information
The objective of this Sales Dashboard is to provide a comprehensive and real-time overview of the company’s sales performance. It aims to help business stakeholders track key metrics such as total sales, revenue trends, top-performing products, regional sales distribution, and sales growth over time. By visualizing data in an interactive and easy-to-understand format, this dashboard enables faster decision-making, identifies sales opportunities, highlights underperforming areas, and supports strategic planning to increase overall sales efficiency and profitability.
