Linked 3-Statement Financial Model with KPI Dashboard – Fully Connected Excel Income Statement, Balance Sheet & Cash Flo
Originally published: 19/08/2026 16:31
Publication number: ELQ-17497-1
View all versions & Certificate
certified

Linked 3-Statement Financial Model with KPI Dashboard – Fully Connected Excel Income Statement, Balance Sheet & Cash Flo

A genuinely linked 3-statement financial model in Excel — Income Statement, Balance Sheet, and Cash Flow Statement cross-connected.

Description
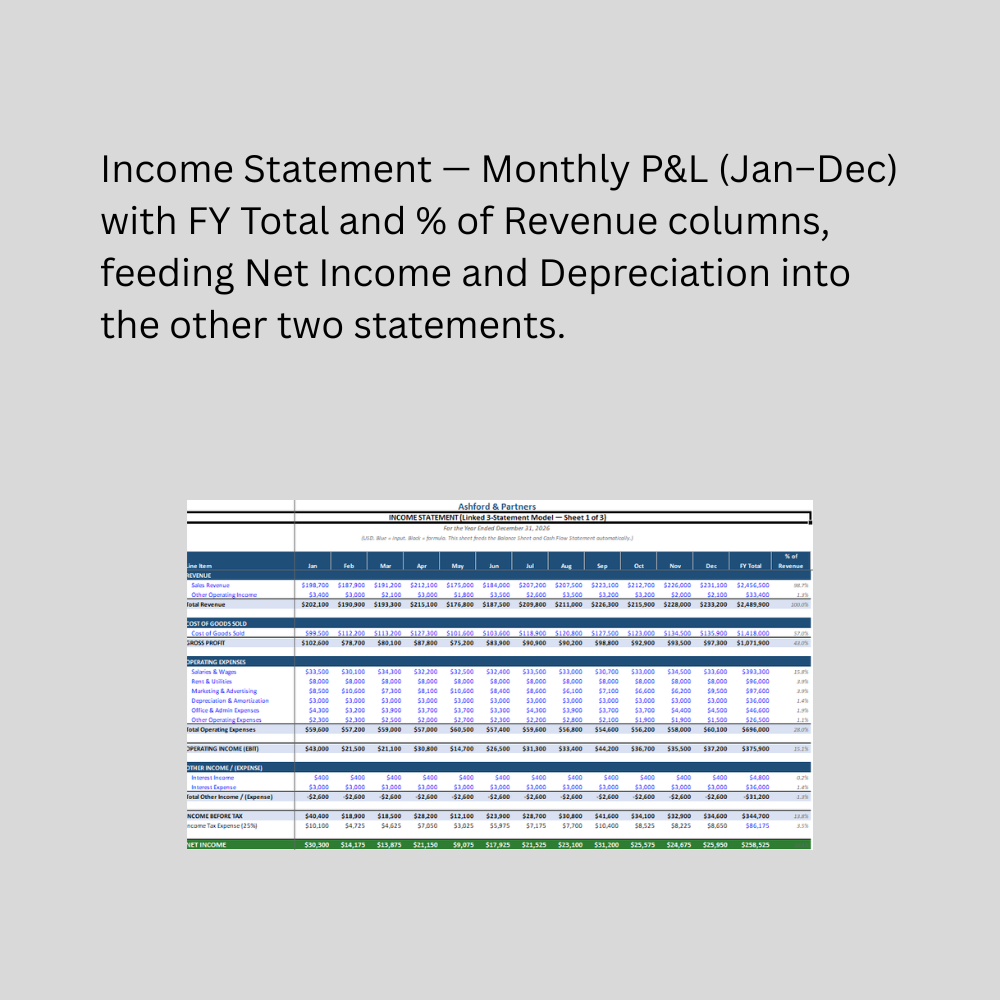
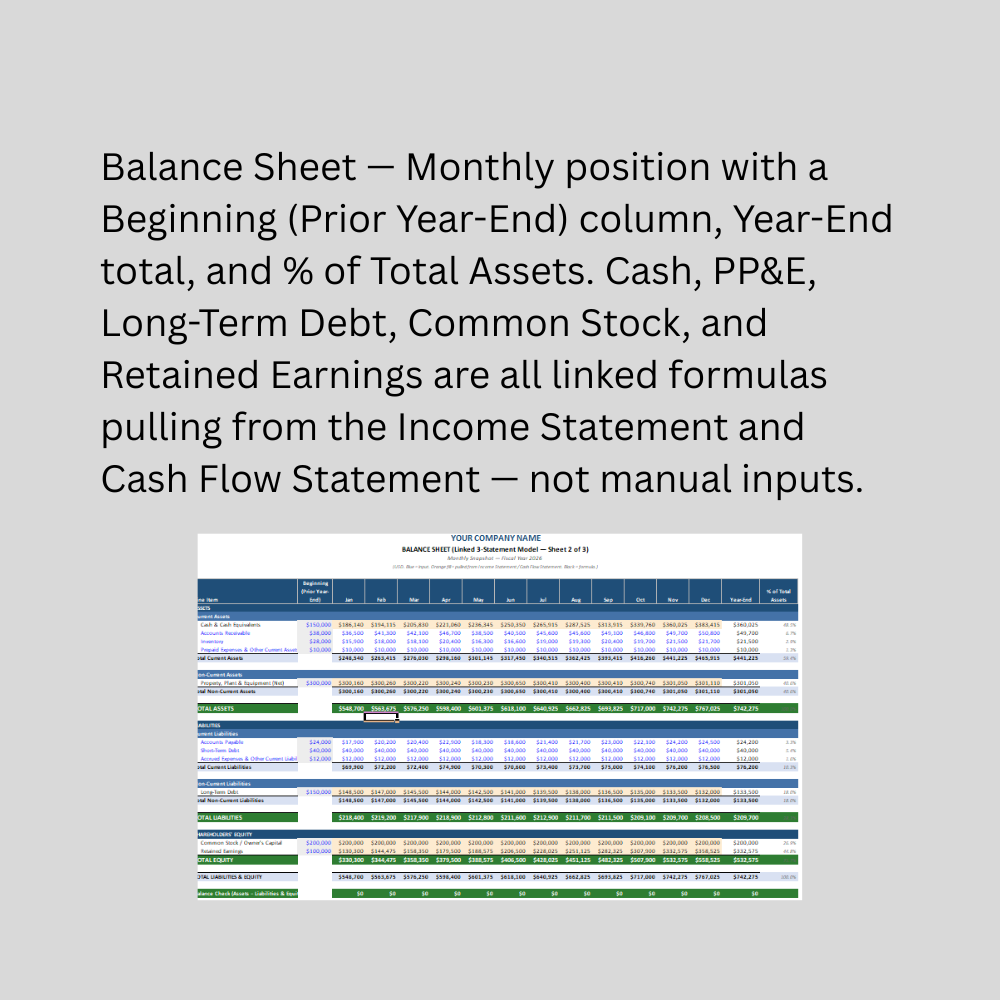
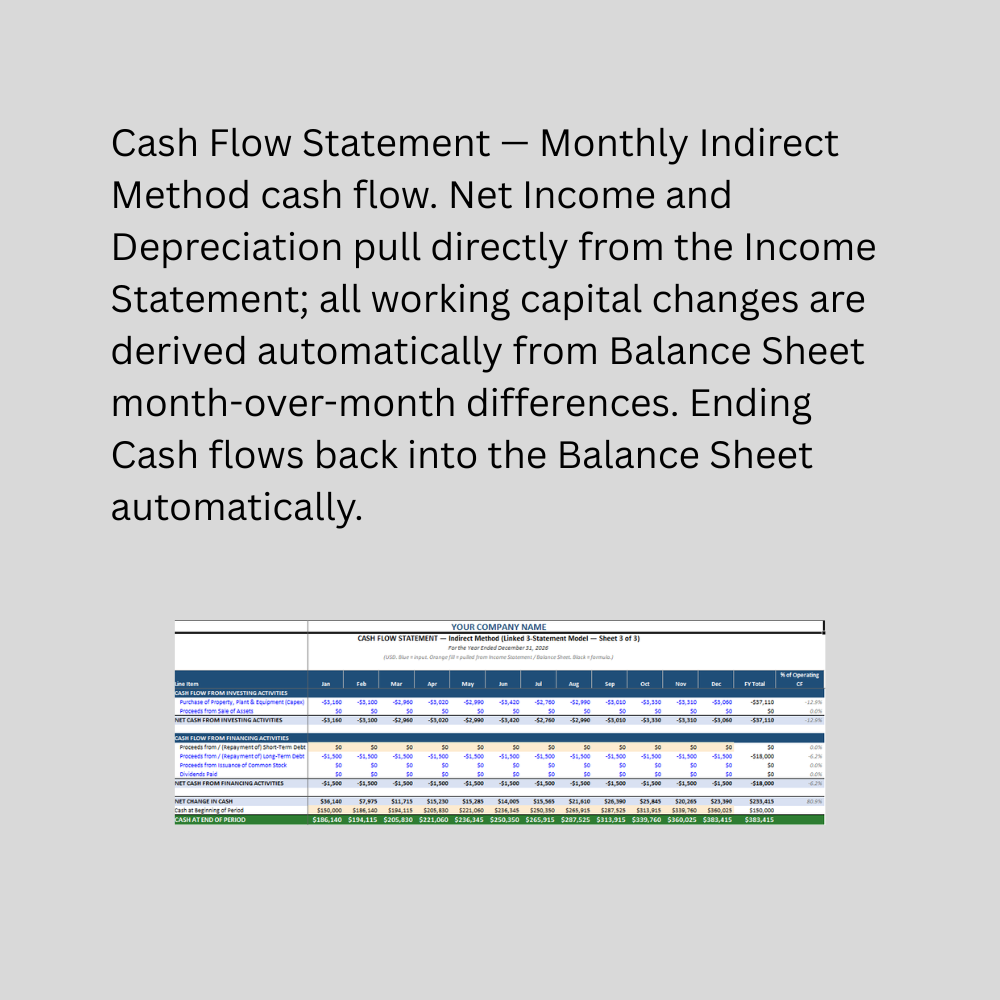
This is the complete, connected version of our 3-statement financial reporting series — combining the Income Statement, Balance Sheet, and Cash Flow Statement into a single, genuinely linked model, with a full KPI dashboard layered on top. Unlike three statements simply placed in one file, every number here is mathematically tied together: change any input on the Income Statement, and Net Income flows automatically into the Balance Sheet's Retained Earnings and the Cash Flow Statement's Operating Activities; change a Balance Sheet input like Accounts Receivable, and the Cash Flow Statement's working capital adjustment recalculates on its own. A built-in Balance Check row confirms Assets always equal Liabilities plus Equity, across every month, with zero manual reconciliation.
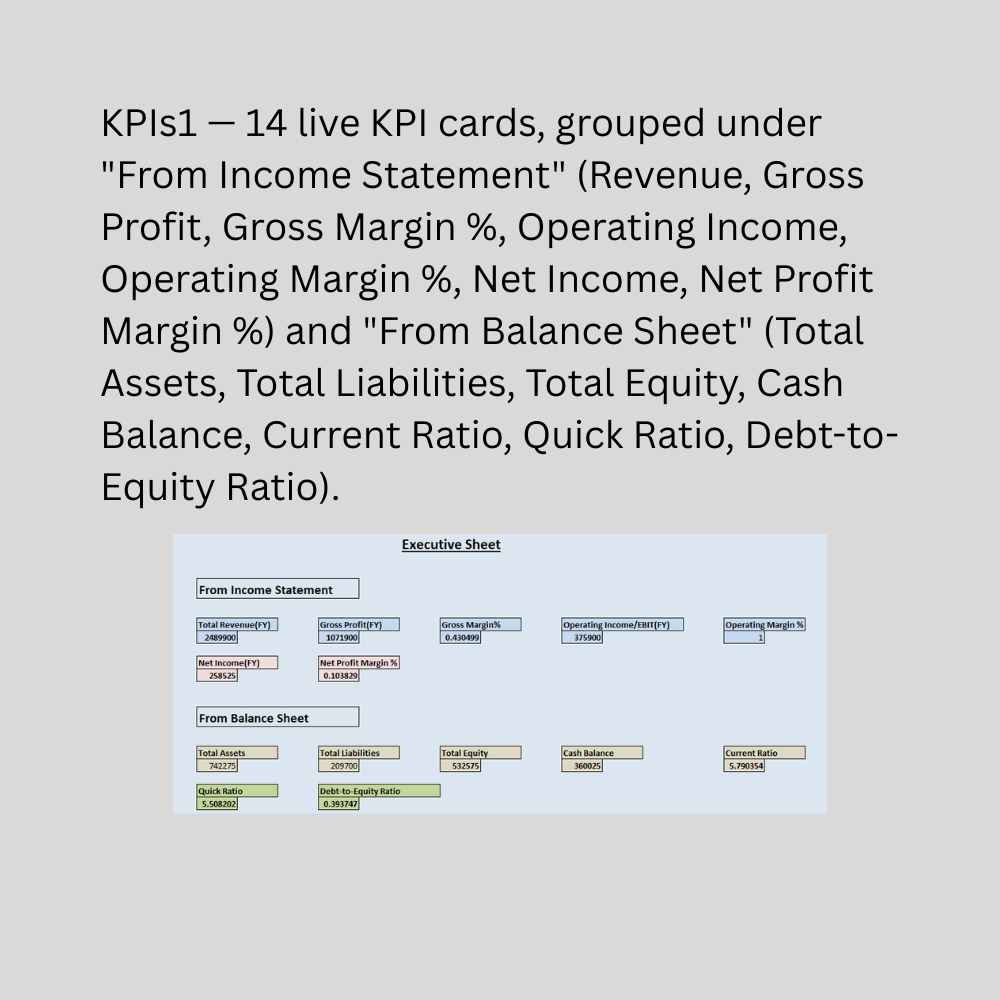
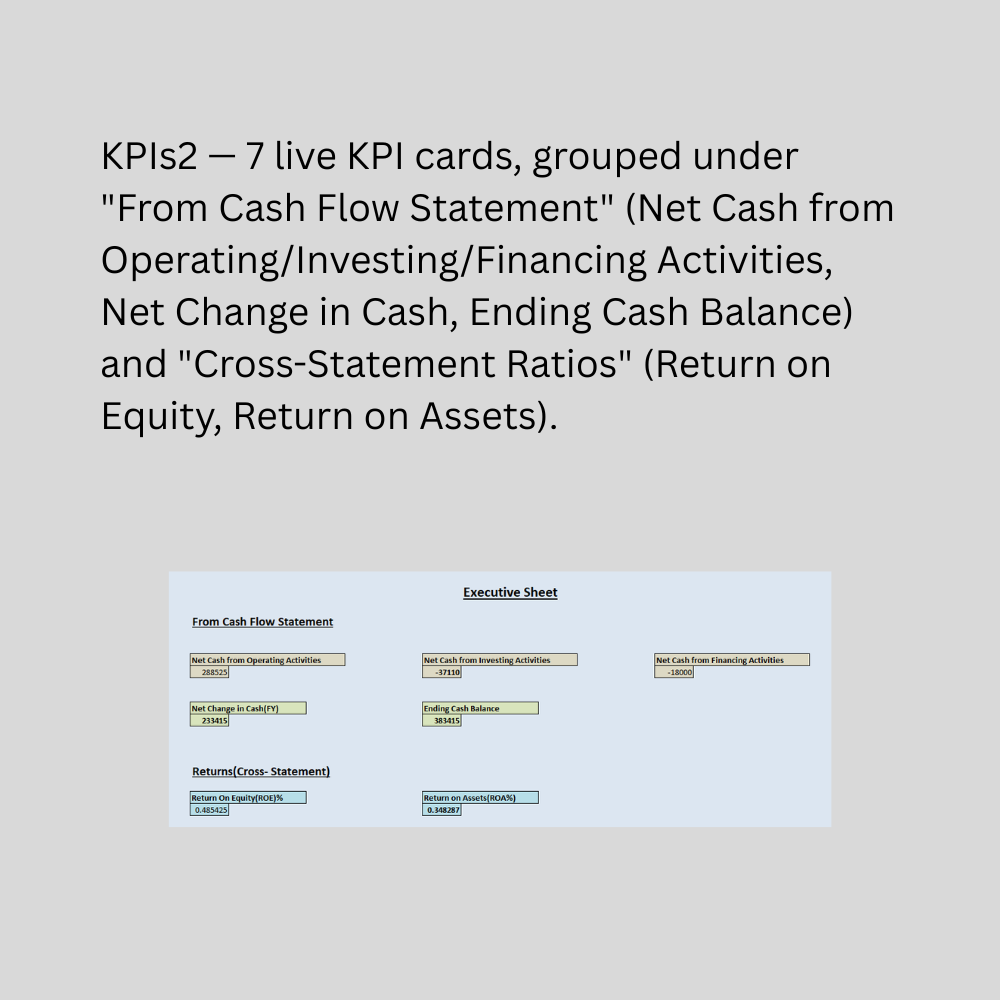
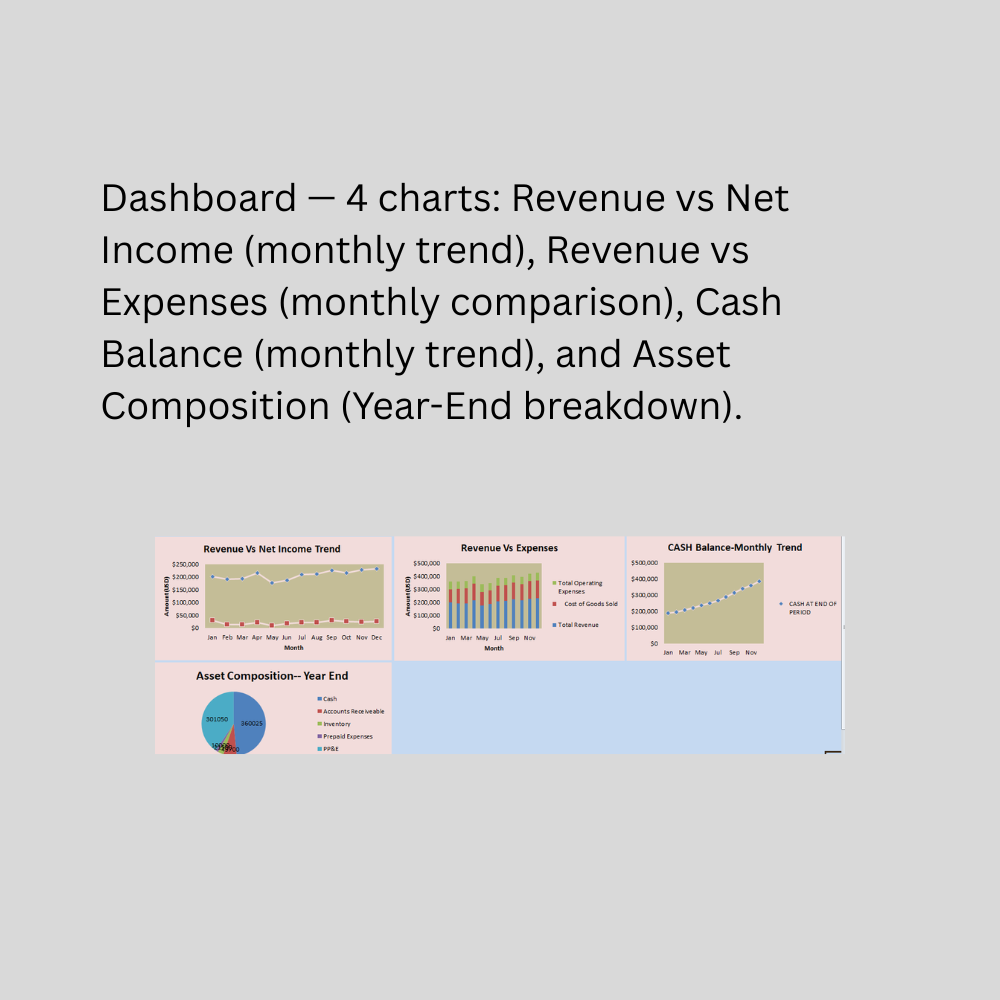
The model is organized across six sheets. Income Statement, Balance Sheet, and Cash Flow Statement present each statement in full, professional format — monthly columns, FY Total/Year-End rollups, and common-size analysis columns, exactly like our standalone statement templates, but here the numbers actually connect. Two KPI sheets (KPIs1 and KPIs2) present 21 live metrics grouped by source statement — profitability ratios, balance sheet strength, cash flow activity, and cross-statement returns like ROE and ROA. A dedicated Dashboard sheet holds four charts: a Revenue vs. Net Income trend, a Revenue vs. Expenses comparison, a Cash Balance trend, and a Year-End Asset Composition breakdown.

Every KPI and chart is formula-driven, not pivot-table-based — meaning they update instantly the moment any input changes, with no refresh button and no risk of a buyer viewing stale numbers. This model is structured for a 12-month fiscal year; editing any existing cell updates everything instantly, while extending the model to additional months or new line items requires copying an existing column/row and adjusting formulas — full step-by-step instructions are included in the companion usage guide (PDF).

This is the flagship, most complete product in our Finance series. Each individual statement (Income Statement, Balance Sheet, Cash Flow Statement) is also available separately if you only need one.

This Best Practice includes
1 excel dashboard file (xlsx) with instruction set

Acquire business license for $25.00

Add to cart

Add to bookmarks

Discuss

Further information

Provide a genuinely linked 3-statement financial model, not three separate files placed together
Automatically flow Net Income into Retained Earnings and reconcile Cash between statements
Confirm balance sheet accuracy instantly with a built-in Balance Check row
Summarize business performance through 21 live KPIs covering profitability, liquidity, leverage, and returns
Visualize trends and composition through 4 dashboard charts, all updating instantly with any edit
Save the significant time and error-risk of manually building and reconciling a linked financial model from scratch

Business owners, founders, and finance teams who want one connected model instead of three separate statements
Users preparing investor, lender, or board-ready financial summaries with supporting visuals
Anyone wanting to understand or teach how the three core financial statements connect to each other
Businesses with a standard 12-month fiscal year and relatively standard account structure
Users comfortable replacing sample data with their own monthly actuals and, occasionally, extending formulas for new months or line items

Businesses needing automatic multi-year extension without manual column/row copying (see the companion guide for how this works)
Companies needing GAAP/IFRS-compliant, audit-ready statements prepared by a qualified accountant
Multi-entity consolidation, multi-currency translation, or complex equity structures
Users who want pivot-table-style, freely re-sliceable data exploration (this model uses fixed, formula-driven KPIs and charts for reliability, not ad-hoc pivoting)
Situations requiring certified financial statements or projections — this is a management-reporting and financial literacy tool, not a substitute for professional advice


0.0 / 5 (0 votes)

please wait...