

Publication number: ELQ-60789-1
View all versions & Certificate

Promotional Pricing Analyzer
Most e-commerce promotions look profitable until you check the margin — this Excel tool shows you the real number, adjusted for seasonality and break-even.

📊 Promotional Pricing Analyzer — Excel Template
By Data'sOk
━━━━━━━━━━━━━━━━━━━━━━━━
Your last promotion looked great. But did it actually make money?
A spike in sales during a discount doesn't mean the promotion was profitable. You might have just sold at a lower margin to customers who would have bought anyway — while missing the ones who wouldn't. This tool tells you the truth.
The Data'sOk Promotional Pricing Analyzer is an Excel template that breaks down exactly what your promotion did to your revenue, your margin, and your bottom line — SKU by SKU.
━━━━━━━━━━━━━━━━━━━━━━━━
WHAT YOU GET
7-tab Excel workbook, fully unlocked:
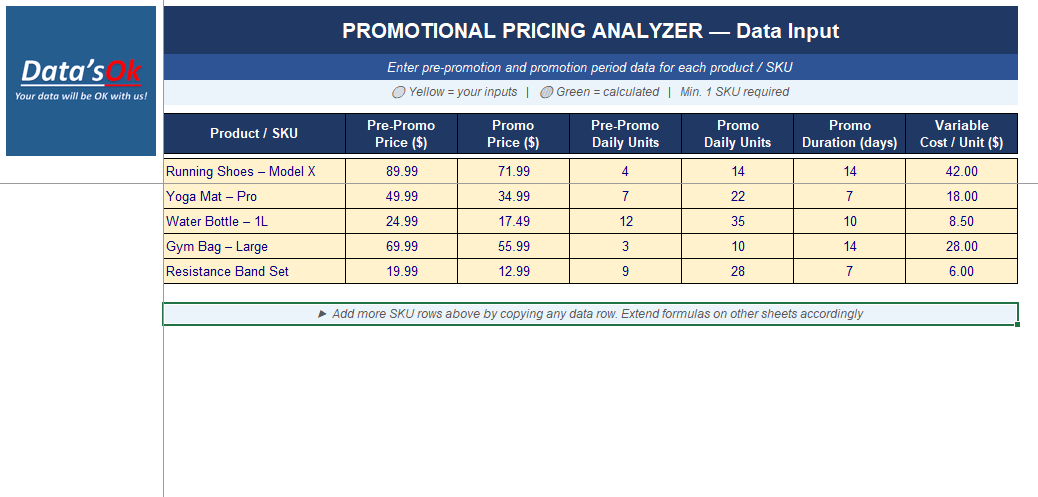
📥 Data Input — Enter your SKUs, prices, quantities, promotion duration, and variable costs
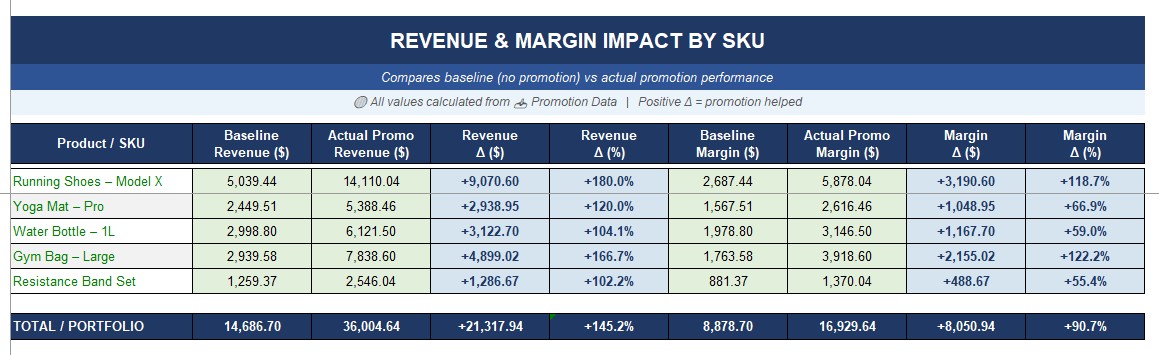
📊 Revenue & Margin Impact — Baseline vs actual revenue and margin per SKU, with portfolio totals
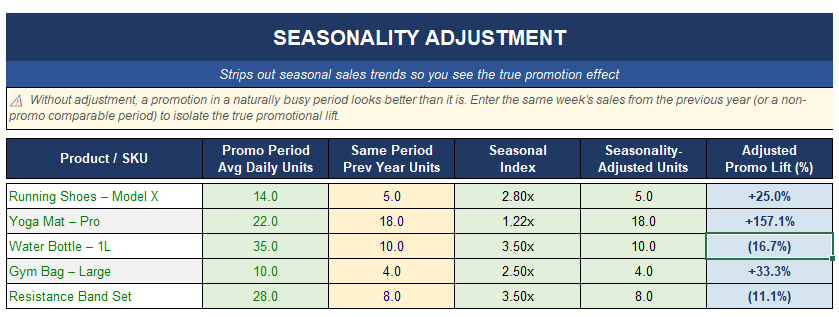
📐 Seasonality Adjustment — Strip out seasonal trends to isolate the true promotion effect (the feature most tools skip entirely)
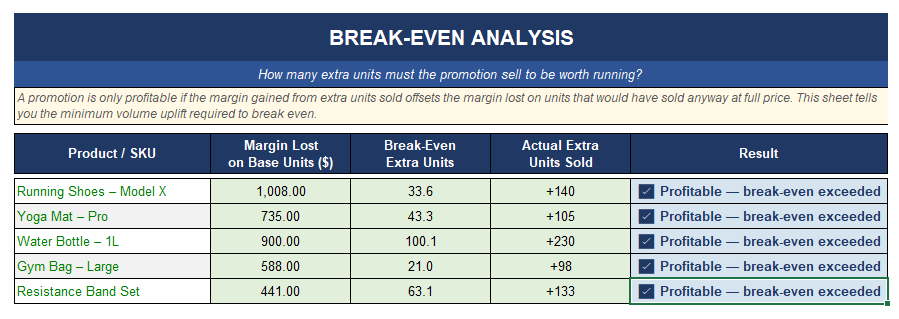
⚖️ Break-Even Analysis — The minimum volume uplift each promotion needed to be profitable — vs what actually happened
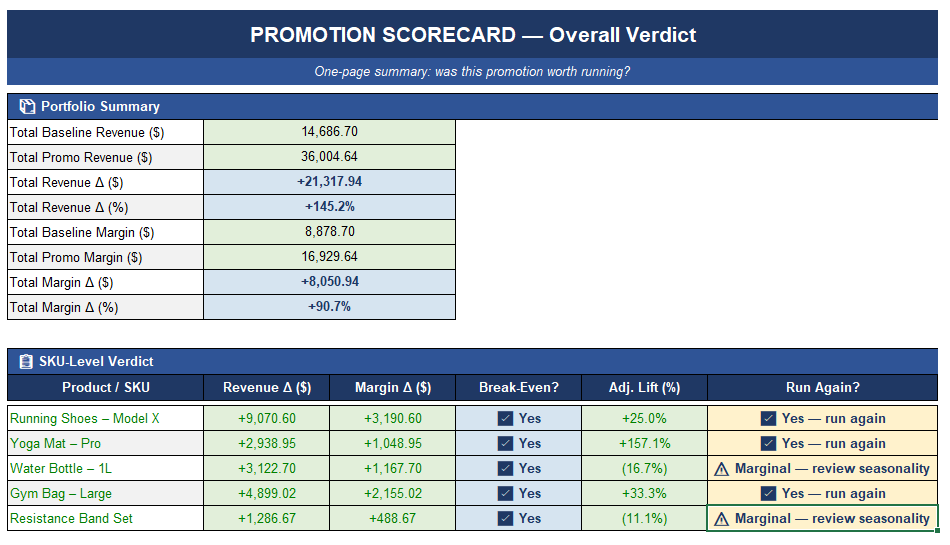
🏆 Promotion Scorecard — One-page verdict: did it work, and should you run it again?
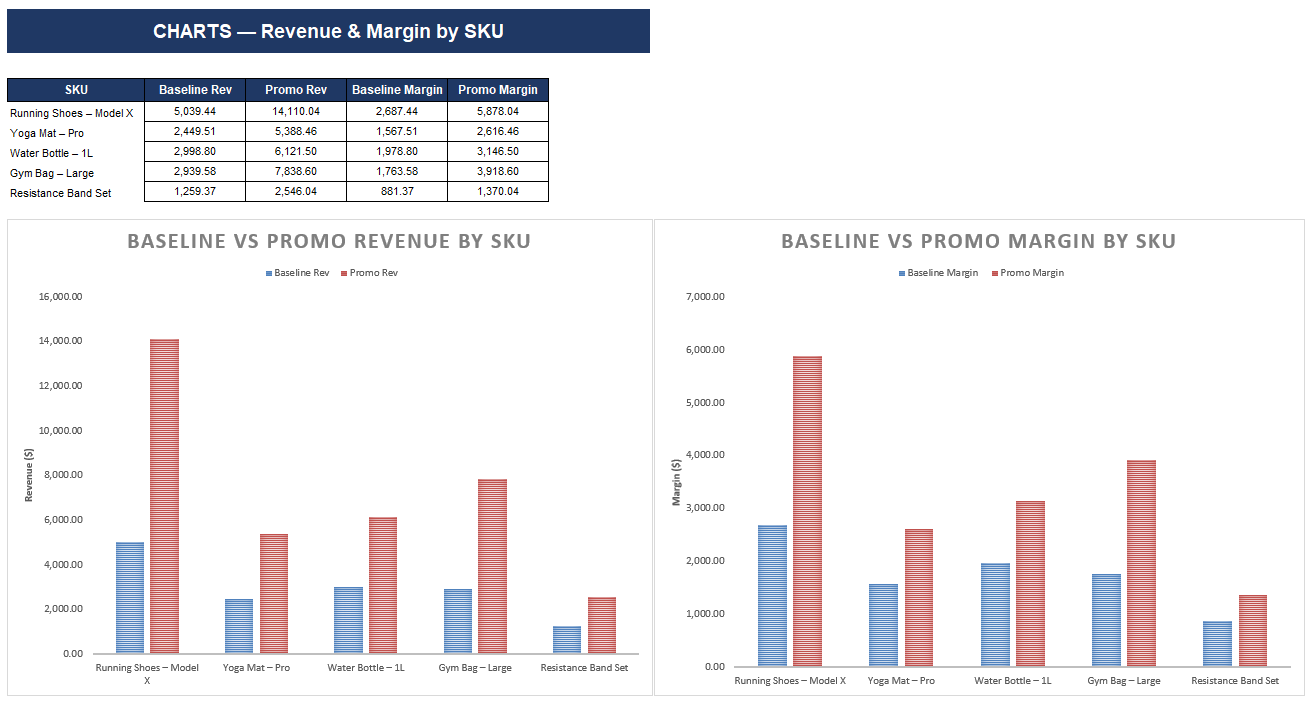
📉 Charts — Auto-generated bar charts comparing baseline vs promo revenue and margin
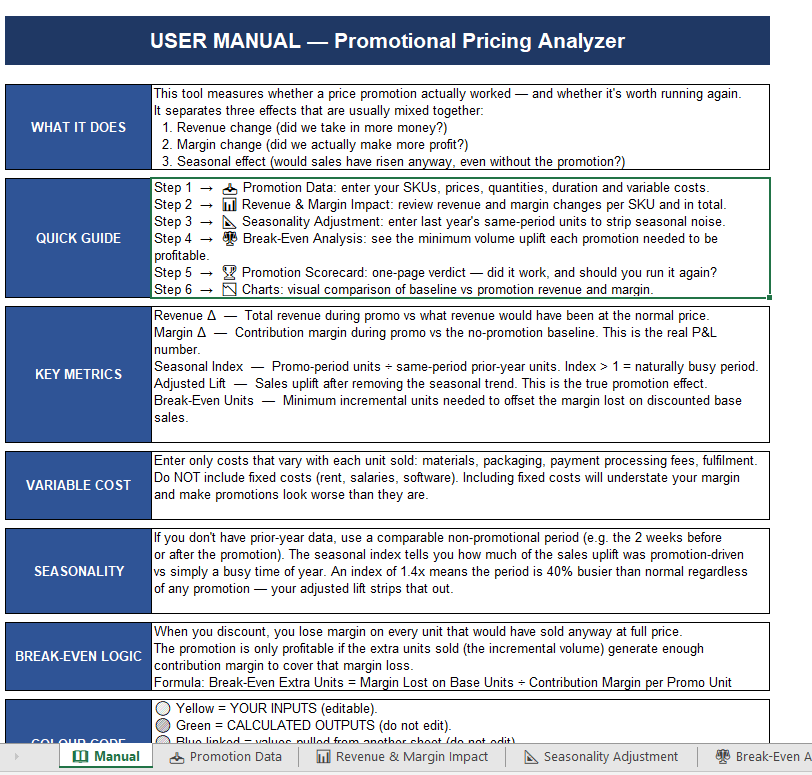
📖 Manual — Plain-English guide explaining every metric, formula, and decision signal
━━━━━━━━━━━━━━━━━━━━━━━━
WHO IT'S FOR
→ E-commerce store owners evaluating whether discounts and sales events are worth running
→ Retail managers building a post-promotion report for leadership
→ Consultants analysing promotional ROI for clients
→ Anyone who has ever run a sale and wondered whether it helped or hurt
━━━━━━━━━━━━━━━━━━━━━━━━
WHY IT'S DIFFERENT
Most promotion trackers just compare sales before and after. This one goes further:
→ It separates margin impact from revenue impact — a promotion can boost sales while destroying profit
→ It includes a seasonality adjustment — so you know how much of the uplift was the promotion vs a naturally busy period
→ It calculates the break-even uplift required — the number almost no one checks before running a discount
No subscription. No software to install. No data uploaded anywhere. Just Excel.
━━━━━━━━━━━━━━━━━━━━━━━━
REQUIREMENTS
Microsoft Excel 2016 or later (Windows or Mac). Not tested in Google Sheets.
At least 1 SKU with pre-promotion and promotion period data.
This Best Practice includes
1 Excel file.
