Quality KPI Dashboard Excel Template, Integrated Framework for Continuous Problem Solving and Risk Management
Originally published: 07/04/2026 21:27
Publication number: ELQ-20809-1
View all versions & Certificate
certified

Quality KPI Dashboard Excel Template, Integrated Framework for Continuous Problem Solving and Risk Management

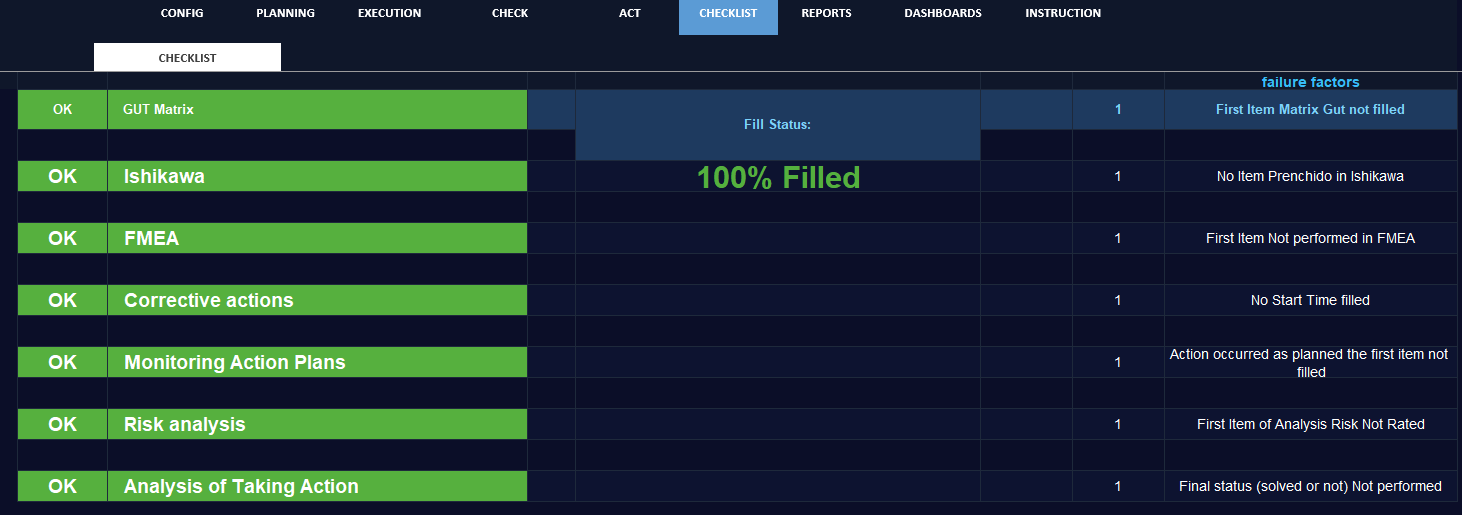
Comprehensive quality management methodology integrating problem analysis, risk assessment, and corrective action tracking.

Description
Quality KPI Dashboard Excel Template, Integrated Framework for Continuous Problem Solving and Risk Management is a comprehensive, integrated framework designed to systematically address organizational challenges through continuous improvement and data-driven problem-solving. This methodology combines six interconnected phases: problem identification and prioritization, root cause analysis, failure mode evaluation, corrective action planning, implementation tracking, and solution verification.
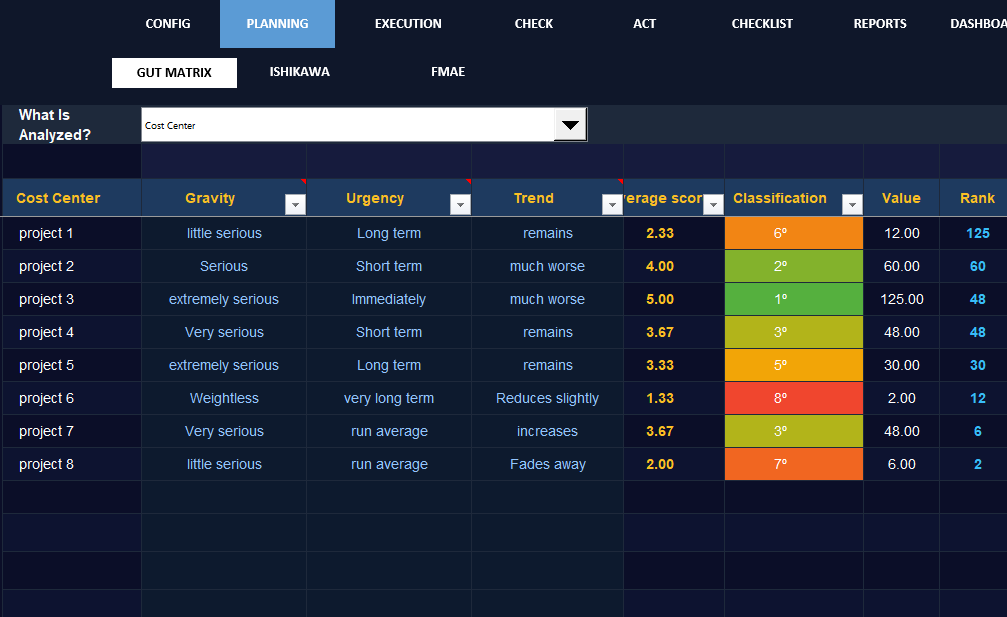
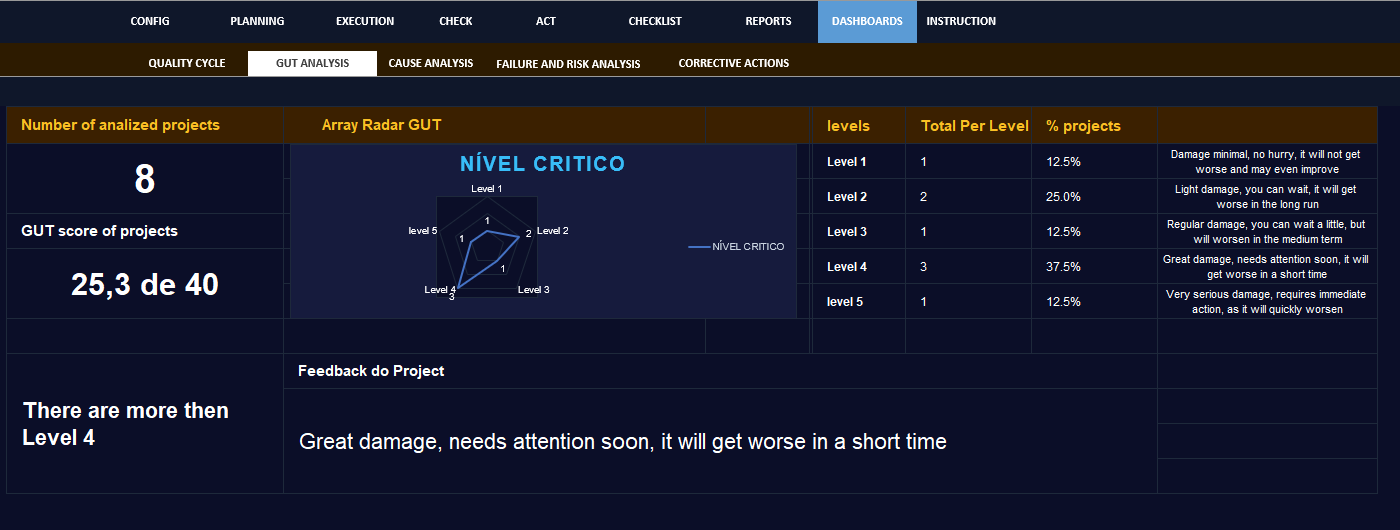
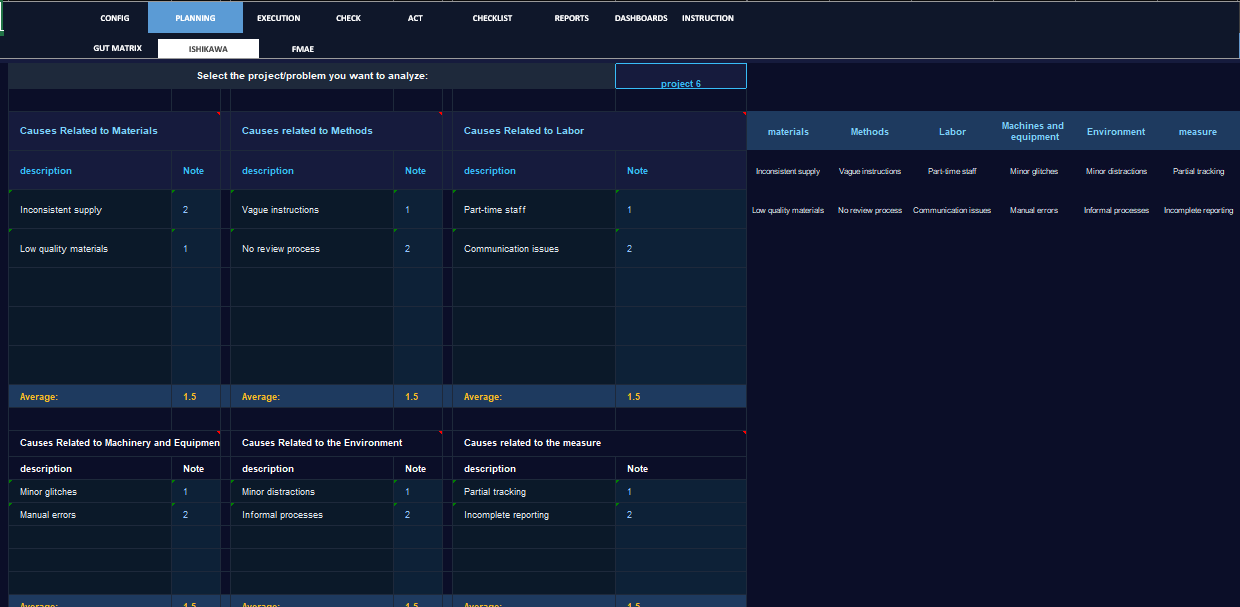
The framework leverages proven quality management tools including the GUT Matrix (Gravity-Urgency-Trend) for objective problem prioritization, Ishikawa diagrams for systematic root cause identification across materials, methods, labor, equipment, environment, and measurement categories, and FMEA (Failure Mode and Effects Analysis) for comprehensive risk assessment.
Organizations can apply this systematic approach to operational, technical, process, and managerial challenges across all departments and functions. The system includes comprehensive tracking mechanisms for corrective actions, performance monitoring, and verification of actual solution effectiveness.
Through structured analysis and continuous feedback loops, organizations achieve measurable improvements in quality, efficiency, safety, and risk reduction. This methodology has demonstrated significant effectiveness in reducing critical and high-risk incidents, improving team accountability, preventing problem recurrence, and establishing sustainable data-driven decision-making processes.
The framework operates on continuous cycling principles: as each problem is systematically resolved through all six phases, organizational teams immediately address the next priority challenge, creating a culture of relentless improvement.
Implementation requires cross-functional team collaboration, executive sponsorship, and commitment to systematic problem resolution rather than quick fixes.

. CONTENTS
Phase 1: Problem Identification & Analysis
  • GUT Matrix Analysis (Gravity, Urgency, Trend assessment)
  • Project/Problem Prioritization
  • Stakeholder and Area Mapping
Phase 2: Root Cause Analysis
  • Ishikawa (Fishbone) Diagram Development
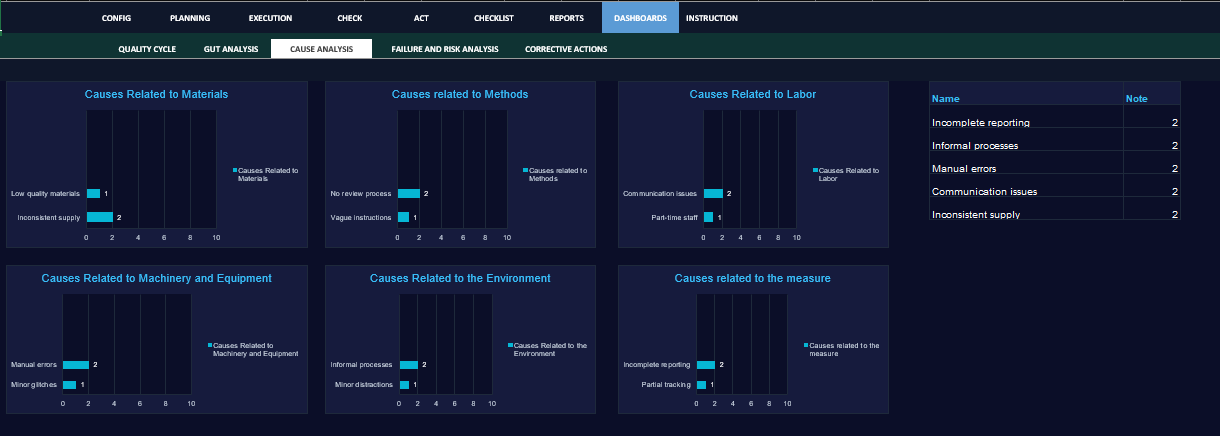
  • Six Category Analysis (Materials, Methods, Labor, Machines/Equipment, Environment, Measurement)
  • Cause Documentation and Note Tracking
Phase 3: Risk & Failure Assessment
  • FMEA Implementation (Failure Mode and Effects Analysis)
  • RPN Calculation (Risk Priority Number)
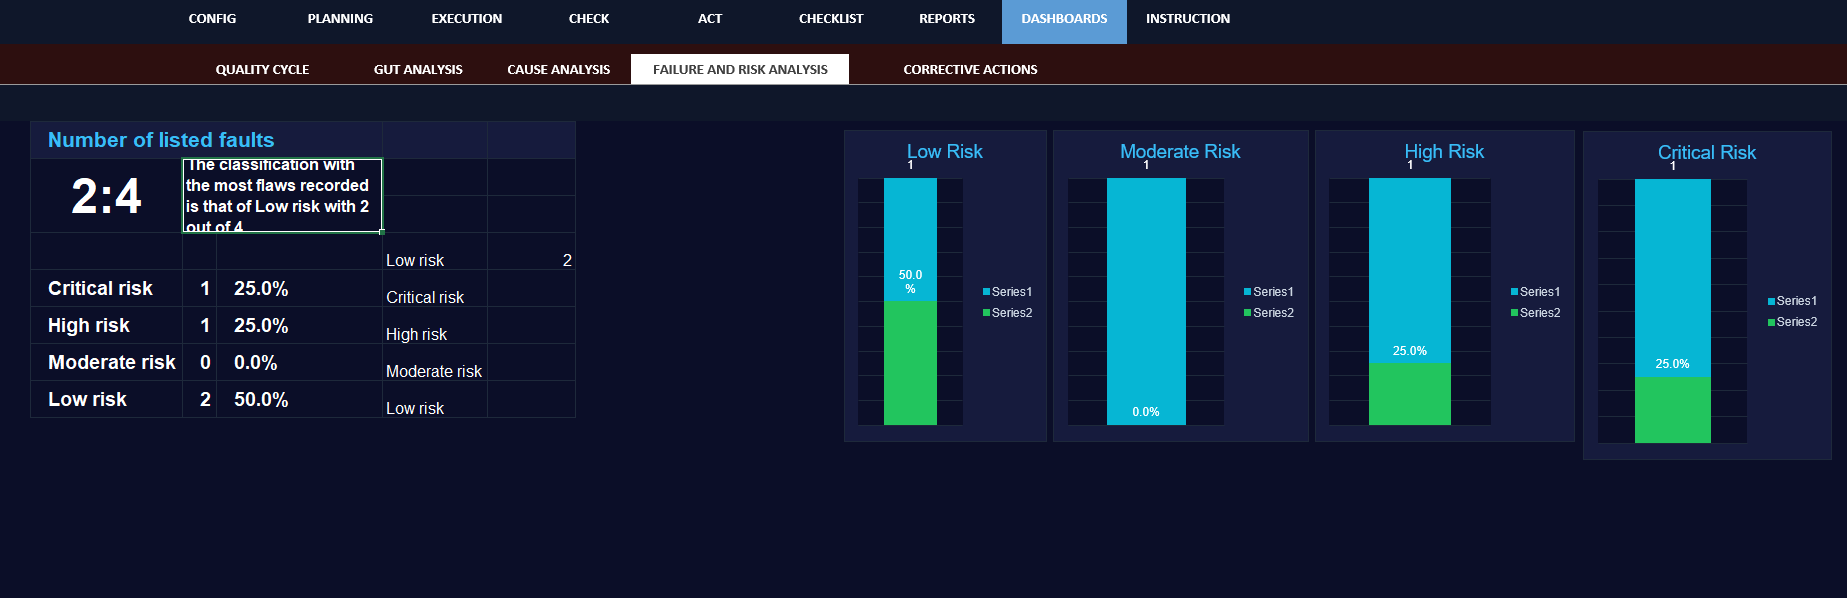
  • Risk Classification System
Phase 4: Corrective Action Planning
  • Action Definition and Resource Allocation
  • Responsible Party Assignment
  • Timeline and Forecast Scheduling
  • Preventive Measure Development
Phase 5: Implementation & Monitoring
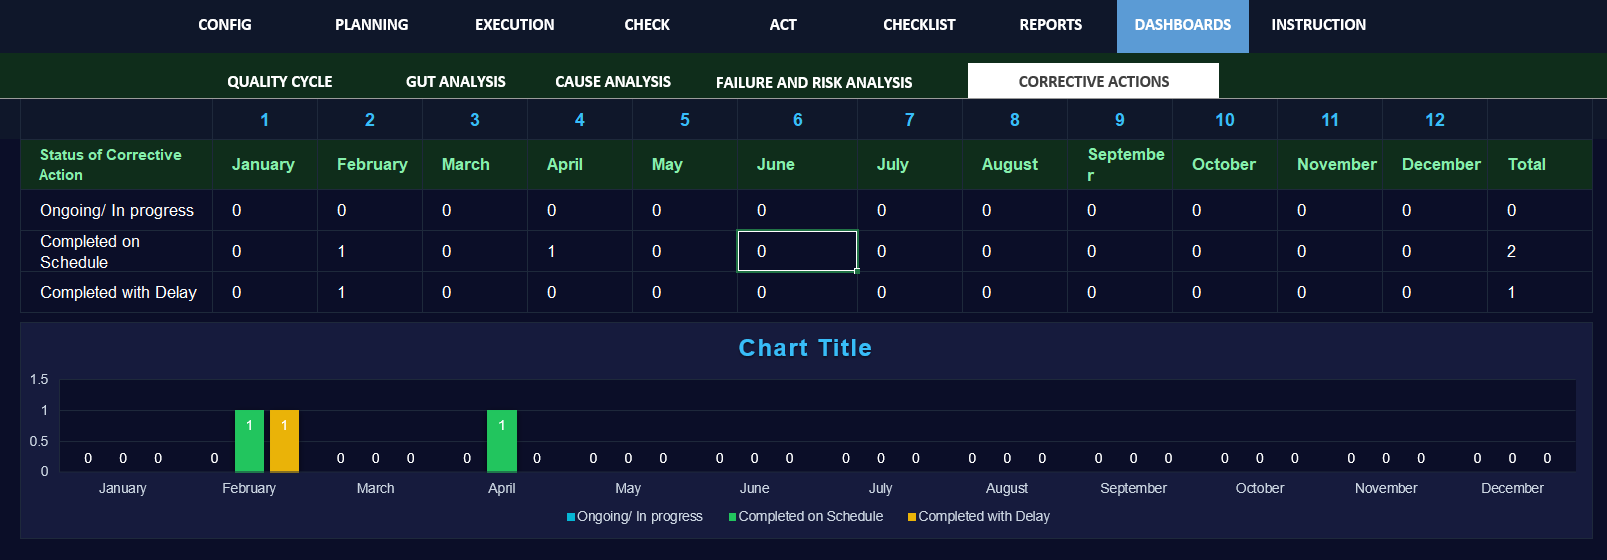
  • Corrective Action Status Tracking
  • Plan Adherence Verification
  • Effectiveness Assessment
  • Action Completion Documentation
Phase 6: Verification & Closure
  • Solution Validation
  • Final Status Confirmation
  • Continuous Improvement Loop Restart
Supporting Analytics
  • Pareto Analysis for Impact Prioritization
  • Risk Matrix (Consequence vs. Probability)
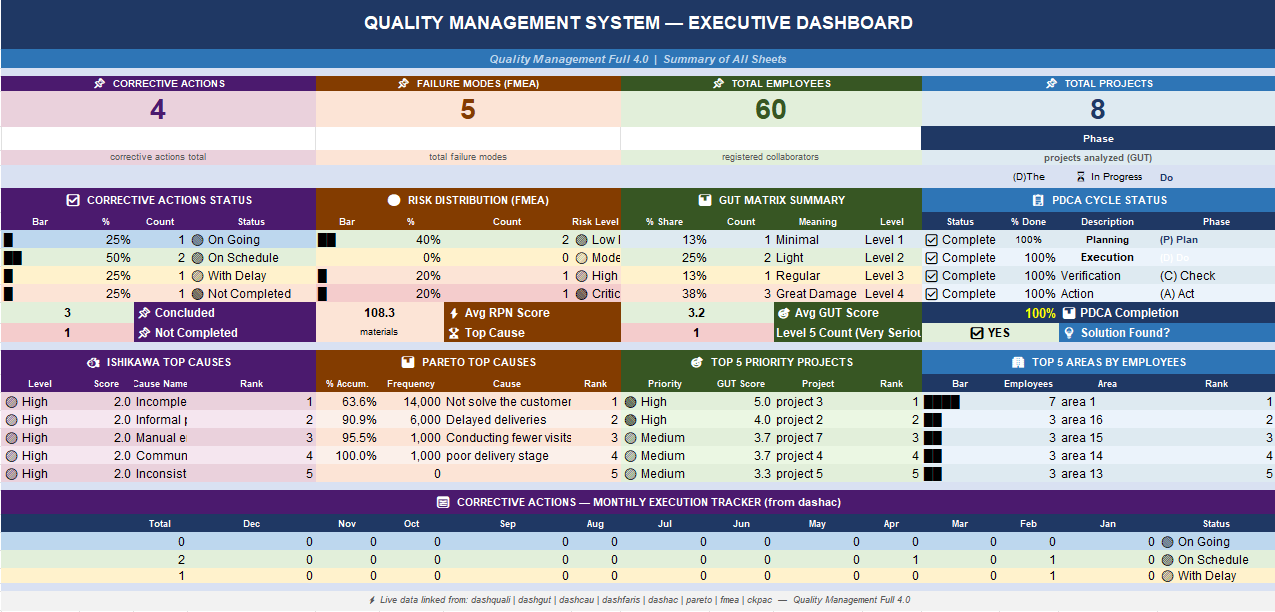
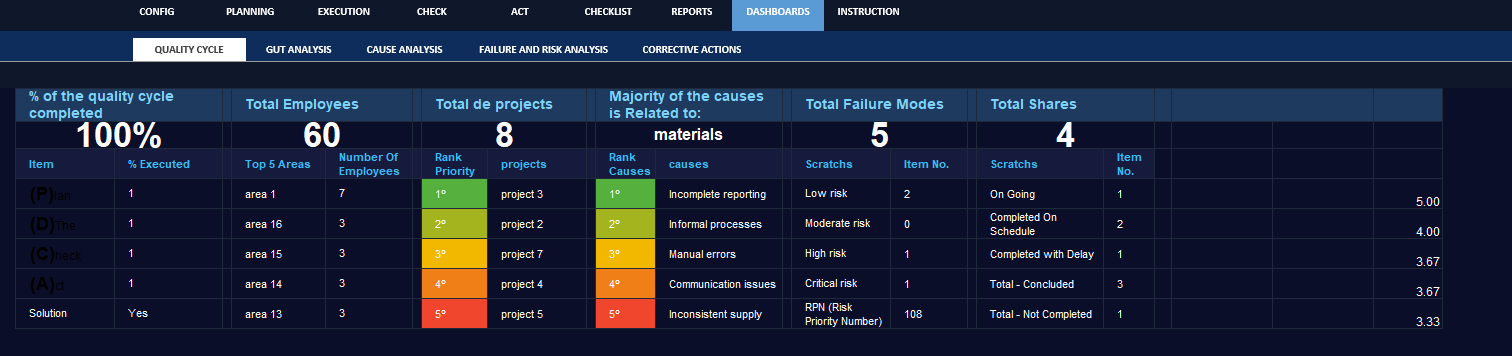
  • Dashboard Reporting and KPI Tracking
  • Area and Team Performance Monitoring
5. TAGS (Maximum 10)
  1. Quality Management
  2. Continuous Improvement
  3. PDCA Cycle
  4. Root Cause Analysis
  5. FMEA
  6. Risk Management
  7. Problem Solving
  8. Corrective Actions
  9. Process Improvement
  10. Organizational Excellence

This Best Practice includes
Dashboard Excel Template, Integrated Framework for Continuous Problem Solving and Risk Management.xlsm

Acquire business license for $50.00

Add to cart

Add to bookmarks

Discuss

Further information

Primary Objectives:

Systematic Problem Resolution - Provide a structured methodology for identifying, analyzing, and resolving organizational problems at all levels
Risk Mitigation - Enable proactive identification and assessment of failure modes, reducing critical and high-risk incidents before they impact operations
Accountability & Tracking - Establish clear responsibility assignment and measurable tracking of corrective actions through completion
Data-Driven Decision Making - Replace subjective problem-solving with quantitative analysis using GUT prioritization, FMEA scoring, and Pareto principles
Continuous Improvement Culture - Foster organizational commitment to systematic improvement through repeatable processes and documented learning
Cross-Functional Collaboration - Facilitate team engagement across departments through structured analysis requiring diverse expertise and perspectives
Performance Measurement - Establish metrics and dashboards to monitor quality cycle progress, corrective action effectiveness, and organizational improvement trends
Compliance & Documentation - Create comprehensive audit trails and documentation supporting regulatory compliance and management system requirements

✓ Organizations facing recurring operational problems requiring systematic resolution beyond quick fixes
✓ Risk-critical industries (manufacturing, healthcare, engineering, finance) where failure analysis is essential
✓ Multi-departmental operations with complex interdependencies requiring cross-functional problem-solving
✓ Companies implementing ISO 9001, ISO 14001, or similar quality/environmental management systems
✓ Organizations with 50+ employees where structured communication and documentation are necessary
✓ Businesses experiencing quality or delivery issues where root cause analysis is needed, not symptom treatment
✓ Projects or products with multiple failure points requiring comprehensive FMEA assessment
✓ Organizations committed to continuous improvement as a core cultural value
✓ Supply chain or operational complexity where Ishikawa analysis can map multiple contributing causes
✓ Team environments with established accountability structures and capacity for process discipline
✓ Situations requiring audit trails and compliance documentation for internal or external stakeholders
Optimal Context:

Organizations with quality management infrastructure or ISO certification aspirations
Leadership committed to systematic improvement investments
Teams with analytical skills or capacity for rapid training
Operations with measurable quality or process metrics


5.0 / 5 (1 votes)

please wait...